Climate Science Glossary

Term Lookup

Enter a term in the search box to find its definition.

Settings

Use the controls in the far right panel to increase or decrease the number of terms automatically displayed (or to completely turn that feature off).

Term Lookup

Settings


All IPCC definitions taken from Climate Change 2007: The Physical Science Basis. Working Group I Contribution to the Fourth Assessment Report of the Intergovernmental Panel on Climate Change, Annex I, Glossary, pp. 941-954. Cambridge University Press.

Home Arguments Software Resources Comments The Consensus Project Translations About Support

Bluesky Facebook LinkedIn Mastodon MeWe

Twitter YouTube RSS Posts RSS Comments Email Subscribe


Climate's changed before
It's the sun
It's not bad
There is no consensus
It's cooling
Models are unreliable
Temp record is unreliable
Animals and plants can adapt
It hasn't warmed since 1998
Antarctica is gaining ice
View All Arguments...


Username
Password
New? Register here
Forgot your password?

Latest Posts

Archives

Urban Heat Islands: serious problem or holiday destination for skeptics?

Posted on 31 August 2010 by mothincarnate

The Urban Heat Island Effect (UHI) is a phenomenon whereby the concentration of structures and waste heat from human activity (most notably air conditioners and internal combustion engines) results in a slightly warmer envelope of air over urbanised areas when compared to surrounding rural areas. It has been suggested that UHI has significantly influenced temperature records over the 20th century with rapid growth of urban environments.

Scientists have been very careful to ensure that UHI is not influencing the temperature trends. To address this concern, they have compared the data from remote stations (sites that are nowhere near human activity) to more urban sites. Likewise, investigators have also looked at sites across rural and urban China, which has experienced rapid growth in urbanisation over the past 30 years and is therefore very likely to show UHI. The difference between ideal rural sites compared to urban sites in temperature trends has been very small:
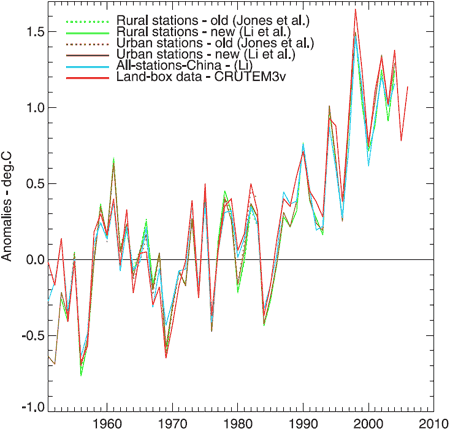

Figure 1. Annual average temperature anomalies. Jones et al (dotted green and brown) is a dataset of 42 rural and 42 urban sites. Li et al (solid green and brown) is an adjusted dataset of 42 rural and 40 urban sites. Li (blue) is a non-adjusted set of 728 stations, urban and rural. CRUTEM3v (red) is a land-only data set (Brohan et al., 2006). This plot uses the 1954–83 base period.

Another way to explore the UHI would be to look at where the majority of warming has occurred across the globe. The UHI should match where most people live. However, if you look at the 2006 global temperature anomaly (figure 2.), you find that the greatest difference in temperatures for the long term averages where across Russia, Alaska, far north Canada and Greenland and not where major urbanisation has occurred.


Figure 2. Using source data from NASA/GISS, this illustration shows the amount of change in global surface temperatures in 2006 from 1885.

The Urban Heat Effect has no significant influence on the record of global temperature trends.

This post is the Basic version (written by mothincarnate) of the skeptic argument It's urban heat island effect.

0 0

Printable Version  |  Link to this page

Comments

Prev  1  2  

Comments 51 to 68 out of 68:

  1. Whoops, "decreases it locally" it should say. I would have to say that I am assuming that UHI is largely air heated by dark surfaces rather than waste heat.
    0 0
  2. Ned #46 Fair enough. However I will note that BP has posted here since I flagged his cop out in #42, and since then I've decided that it was worse than a mere cop out. So I'd figure I'd flag him to follow it up properly when he's back, or ignore it at his peril.
    0 0
  3. David, Go to the link at post 39 for a recent summary of UHI data compared to rural stations. The whole paper is available (free) at Dr. Hansons web site if you want to read it. It appears that UHI was overestimated 20 years ago. The adjustments made for UHI probably resulted in underestimation of the warming to date- the opposite of what the deniers claim. Current data indicate that the UHI effect is small. There are significant heat budget changes due to albeido effects when forest is changed into farms. These exceed UHI because farms are much bigger than cities. On the other hand, all these effects are anthropogenic changes in the Earth weather system. In the end the sum of all changes is what matters. The IPCC considers all known changes in its reports.
    0 0
  4. michael sweet, >>On the other hand, all these effects are anthropogenic changes in the Earth weather system. In the end the sum of all changes is what matters.<< -That's kinda what I was thinking, I was just unaware of how UHI effect compared to other AGW causes. I appreciate the help. As for Dr. Hanson, -just read "Storms of my...." Along with Skeptical Science, Dr. Hanson's website and some others I have bookmarked maybe you could cite a few more for me. I especially like to point out observable effects of AGW to my (many) friends who are deniers.
    0 0
  5. Re: davidwwalters (54)
    "Along with Skeptical Science, Dr. Hanson's website and some others I have bookmarked maybe you could cite a few more for me. I especially like to point out observable effects of AGW to my (many) friends who are deniers."
    Here's some resources I've found helpful in providing visual documentation of climate changes: Double Exposure Extreme Ice Survey Swiss Glaciers On-line James Balog's Glacier Melt Video Mauri Pelto's Glacier Change Blog Mauri Pelto's Glacier Website US Scientific Assessments of Change (with links to IPCC versions of same) Sea Level Rise Maps (you can play with various levels of rises in various places to visually see future inundations) Websites (brief list - I'm leaving out literally dozens of favorites here): Arctic Sea Ice - Neven's Blog Climate Charts & Graphs Climate Progress Deep Climate Open Mind OSS Foundation Real Climate - Start Here Scott Mandia When I get the time, I'll post a more comprehensive listing on my (very rudimentary as yet) Typepad blog. Hope this helps, The Yooper
    0 0
  6. Yooper, 'Preciate it, it'll keep me busy i'm sure.
    0 0
  7. David, Yooper's list is more comprehensive than mine. As you read more you find sites that cater to what you are interested in. I read a lot about ice and not much about changes in animal behaviours. Skeptical Science covers a lot of issues at a basic level and there are often references to other sites for more detailed information. Realclimate is very good but also technical.
    0 0
  8. Since BP's analysis on the first page of this thread has become the subject of discussion elsewhere, I thought I'd revisit it briefly. Recall that BP picked 270 GHCN stations, calculated their temperature trend over the decade 1990-2000, and then calculated their change in population density over the same period from GPWv3. He then created a model relating temperature trend to the number of doublings of population density. His claim was that the Y-intercept of this model showed that a hypothetical station located at a site with no change in population density would have a trend of +1.5C/century over that decade. For context, note that a bunch of different reconstructions using land stations only show an actual trend of +2.25C/century over the same time period. Thus, BP's results, if you grant all the various assumptions underlying his analysis and assume that his hand-picked stations were representative of all land stations, would suggest that UHI explained about 1/3 of the observed temperature increase over land and about 10-12% of the global increase. Commenter kdkd and others have questioned the statistical significance of that model. Since BP hasn't been able to explain that, I've tried to sort-of replicate it. Of course, without knowing what stations he used it's not possible to replicate his analysis exactly, and for a number of reasons (to be explained below) I don't think it's worth going through all the work of fully replicating it even if we did know what stations he used. Instead, I took the short-cut of just digitizing the points on the graph from his comment, and re-doing the regression analysis. Unfortunately, the graphic is noisy and it's not possible to identify all 270 points. I got 204 of them, but for the rest I'm just not confident in my ability to correctly identify them in the noise. Using those 204 points gives a model with an r2 of 0.075, meaning it explains very little of the variance within the data. (This is not surprising given the spread among the points in the graph). The estimate for the intercept is 1.4C/century, just a hair below BP's calculation of 1.5. The 95% confidence interval around this estimate is approximately 0C/century to 3.0C/century. In other words, UHI could explain all the observed warming over land, or at the opposite extreme it could be artificially cooling the data, actually reducing the land surface trend from its "true" value of 3.0C/century to the observed 2.25C/century. Of course, neither of those extremes seems likely. Given that the land is presumably warming faster than the ocean (heat capacity), UHI can't realistically explain most or all of the observed warming over land. Likewise, I don't think anyone seriously suggests that overall, globally, UHI would be negative. So my admittedly crude attempt to replicate BP's analysis suggests that his model is not very informative, since it fails to exclude what are almost certainly unrealistic values at both the high and low extremes. That's OK, it's still interesting (though probably not publishable....) As I've mentioned earlier in this thread and elsewhere, there are serious concerns/problems with BP's analysis that probably make it non-worthwhile to pursue it much further. First, the quality of the locational information in the GHCN metadata is known to be poor, and the spatial resolution of the GPW population density data is clearly insufficient to provide estimates of local population density at individual stations. Second, one decade is a very short time to be looking at trends in both temperature and population density. Third, we don't have any reason to believe that BP's hand-picked 270 stations are representative of the overall land surface, and in fact there are good indications that they are not (according to BP's original comment their mean trend differs substantially from the observed land surface trend based on various reconstructions). This is not to suggest that BP deliberately picked unrepresentative stations -- it's just difficult to get a representative sample without using somewhat sophisticated methods. It's worth noting that there's no a priori reason to expect that the real world would actually conform to this model, particularly when extrapolated to low population densities. On the contrary, it seems physically improbable. It's also worth noting that we have reliable and well-validated satellite measurements of sea surface temperature trends which show clear warming during this period. Given that there are good physical reasons to expect warming over the ocean to lag warming over land, the global SST trend would seem to limit how much land warming could be explained by UHI (if your claims for UHI would bring the land trend below the ocean trend, you've probably made a mistake somewhere). If you dealt with the first three objections, and found that the resulting model actually explained a large proportion of the variance in the observed data, it would definitely be worth pursuing this. What we have right now, though, is an analysis that is crippled by those three objections and only yields an r2 of around 0.075, and fails to rule out more or less impossible answers at both extremes. Bottom line, BP's analysis doesn't really do anything to support the claim that UHI explains as much as 10% to 12% of the observed global temperature increase. The true value is probably in the low single digits. Apologies for the length of this comment.
    0 0
  9. As a postscript, I'm happy to discuss this all further, but I'll be leaving town shortly for the weekend and may not be revisiting the site much if at all before Monday.
    0 0
  10. Ned #58 Thanks for this. Any chance you can post the csv file of the raw data that you used up to a site like this one so that I can take the regression diagnostics a bit further. It looks like with a correlation coefficient of 0.23 uncorrected for autocorrelation while statistically significant, is of very little practical significance. BP's mistake has been to assume that his estimate of the slope is not an estimate but is the true value of the slope, and so therefore has not accounted for uncertainty in his estimate. This appears to be an excellent example of confirmation bias in action.
    0 0
  11. kdkd writes: Thanks for this. Any chance you can post the csv file of the raw data that you used up to a site like this one so that I can take the regression diagnostics a bit further. I'm still traveling but a friend of mine posted the file for you. Hopefully it worked OK -- let me know if it doesn't. csv file The columns X and Y are the x and y coordinates, respectively, of the points on BP's graph. Presumably the X coordinate is the base 2 log population density difference between 2000 and 1990, while the Y coordinate is the raw temperature trend in K/year, but I have not verified either of those calculations. Disclaimer: See all the various caveats in my comment above. This is not an actual replication of BP's analysis since I don't know what stations he used and don't have his actual data -- I basically just attempted to digitize the points off his graph. Note that he says he used 270 stations, but I was only able to get about three quarters of them off the graph (some may have been overlapping or otherwise lost in the noise of the jpeg-compressed image). kdkd continues: [...] uncorrected for autocorrelation [...] It's important not to lose sight of this. Without knowing anything about the spatial distribution of the stations that BP used, it's impossible to know how much of the already-low significance of the model is just due to autocorrelation.
    0 0
  12. Thanks Ned, that's brilliant. Well here's the standard simple regression diagnostics Ned's forensic re-approximation of Ned's analysis. Just to show how trivial this stuff it (and show up BP as looking bad), here's the state of play: I did a little bit of very basic regression on Ned's data in R which you can see here. Take home message - the 95% confidence interval of the R squared is between 0.02 and 0.16, and the regression is significant before correcting for autocorrelation. In order to determine if temporal autocorrelation is likely to be a problem I ran a more advanced diagnostic which strongly suggests that it is (see link function statistic). Properly accounting for temporal autocorrelation would almost certainly bring the effective R2 value to somewhere even closer to zero (or possibly below) indicating that BP's model is not significant, but this is beyond my area of expertise - I'm a psychometrician, not a time series analyst, so I know a different subset of the black arts than the TSAs. And that's before we even start thinking about spatial autocorrelation, which if significant would lower the effective correlation coefficient and R2 even further. Over to you BP. Which part of your findings would you like to retract first?
    0 0
  13. kdkd, I can easily understand the spatial dependence in the decadal temperature trends and population density data. Where does temporal autocorrelation come in? I'm guessing you mean that the trend estimates for individual stations would have larger uncertainty than would be expected without correction for autocorrelation in the monthly data. But how does that work in this analysis, which is just considering each station's trend as one datum? Of course, this is all basically a tempest in a teapot, since even if one granted all BP's assumptions and waved away all the problems with the analysis, you'd end up with UHI explaining something like 10% to 12% of the observed warming. Now, I think there's basically no value to BP's analysis for reasons discussed above, and I'd further suggest that the actual magnitude of UHI is probably rather less than this 10-12% ... but let's play along here. So, if 88% to 90% of the observed warming is real, and Hansen's model would fit the observed warming with a climate sensitivity of 3.4C, then the "real" climate sensitivity should be right around 3.0C ... which handily enough just happens to be the exact value for the best estimate of climate sensitivity from the IPCC AR4 Summary for Policymakers. Nifty, huh?
    0 0
  14. Ned: Fair enough, temporal autocorrelation isn't an issue with this data. It's been a long day, and this stuff is out of my comfort zone. Hey, if we're extra generous and give BP the upper limit of the confidence limit on R2 (0.16) then we're still well within one standard deviation of estimated climate sensitivity. I guess we can expect that retraction any minute now :)
    0 0
  15. Ned, I am not familiar with this type of data analysis. I wondered if you could remove the UHI "bias" by choosing countries that have had negative population growth and doing an analysis on them. I checked on Wikipedia and most of eastern Europe, including Russia and Poland, and Japan have had negative population growth for many years. If you showed their warming was the same as areas with increasing population (or the global average) would that show that the UHI effect BP claims was not true? It might be possible to lose population in one area and gain it elsewhere and have an effect, but that would be an extraordinary set of circumstances. Greenland has had population decline and we know how fast it has been cooling there. I thought it was ironic that Poland had negative population growth and BP is from there.
    0 0
  16. Urban Heat Island discussion In the following discussion about UHI, I will assume that the world is divided into two parts i.e. Urban Heat Island and non-Urban Heath Islands. This discussion is bases on “a back of an envelope calculation” without use of IT resources. Only simple differential calculus, few assumptions and judgments’ are used in order to calculate the maximum impact of UHI on the global warming. Estimation the share of the UHI out of Earth’s surface The total surface area of the Earth is 510,072,000 km2, land areal 148,940,000 km2 and the ocean area is 361,132,000 km2. From Schneider et al [1] the urban area is estimated from 308,000 km2 to 3,524,000 km2 with the best estimate of 658,760 km2 based on data from the years 2001 - 2002. This means that the share of UHI is in the range from 0.06% to 0.69% with the best estimate 0.12% of the total area. Below I have used 0.12%. The uncertainty about the UHI area originates from the definition of UHI and poor sampling. However Schneider et al [1] has reduced the uncertainty significantly. Discussion In the discussions about UHI, I will point out that an effect may come from two sources. Firstly, it may come from differences in the rate of increase of the temperatures in UHI’s and in non-UHI areas. And secondly, it may come from the increase of the total areal of the Urban Heat Island. If we define alpha(t)= Share of the Urban Heat Islands of total area at time t T1(t)=Temperature of the Urban Heat Islands at time t T2(t)=Temperature of the non-Urban Heat Islands at time t T(t)= Temperature of total surface of the planet at time t, At time t we have T(t)=alpha(t)*T1(t)+(1-alph(t))*T2(t). If alpha(t)=0.0012 and T1(t)=T2(t)+2.0 then T(t)=0.0012*2+T2(t) =0.0024+T2(t) This means, that if the temperature in UHI’s are 2 °C higher that on non-UHI, then the total temperature will be affected only with 0.0024 °C. If alpha(t)=0.05 and T1(t)=T2(t)+2 then T(t)=0.05*2+T2(t) =0.25+T2(t) This means, that if the temperature in UHI’s are 2 °C higher that on non-UHI and the UHI area is 5% of the total area, then the total temperature will be affected only with 0.10 °C. If we want to study the development over time, we have by differentiation that T’(t)=alpa’(t)*(T1(t)- T2(t))+ alpha(t)*T’1(t)+(1-alpha(t))*T’2(t) If alpha’(t)>0, then the rate of increase of the total temperature will be affected by the difference in temperatures between UHI and non-UHI in any case. If alpha’(t)=0, then the rate of increase and the total temperature will be affected only from then differences in the rate of increases in Urban Heat Island and non-Urban Heat Islands. If T1’(t)=T2‘(t) and alpha’(t)=0 then there will be no impact from Urban Heat Islands. What can be said about alpha(t) ? A good guess is that alpha(t) is proportional to an exponential function i.e. alpha(t) = k*exp(β*(t-t0)), where β=0.033 , k=0.0012 and t0 =2001. and alpha’(t)=β*k*exp(β*(t-t0))=β*alpha(t) The constant β is estimated from USA. From 1950 to 2000 the growth of UHI in USA is 400%. This corresponds to an annual rate of increase of 0.033=51/50. This will produce the following expression for T’(t) T’(t)= β*alpha(t) )*(T1(t) - T2(t))+ alpha(t)*T’1(t)+(1-alpha(t))*T’2(t) Assuming that alpha(t)≈0.0012 and β ≈0.033 then alpha’(t) *β≈0.0012*0.033=0.0000396. If T1(t) - T2(t)=2 we then have approximately T’(t)≈0.0000396*2+ alpha(t)*T’1(t)+(1-alpha(t))*T’2(t) =0.0000792+ alpha(t)*T’1(t)+(1-alpha(t))*T’2(t) A good proxy for T’(t)≈ 0.015 °C pr. year and alpha(t)*β/T’(t)=0.0000792/0.15 = 0.52%. If the UHI areas is 5% of the total area, then alpha(t)*β/T’(t)=0.00165000/0.15 = 1.1%. This means that the contribution from the rate of increase of the UHI share is only 0.52% and therefore marginal and if a dramatic increase of the UHI area takes place, then the impact will be 1.1%. This means, that the influence on the total temperature from the increased share of the UHI is insignificant. If we assume that T1’(t)=γ*T2’(t) we have T1(t)=γ*T2(t)+δ, where δ is a constant. This means that the rate of increase of the temperature of UHI’s is proportional to the rate of increase of the temperature outside UHI plus a constant. If γ>1 then the rate of increase of the temperature of UHI’s are larger than the non-UHI’s. This assumption means that we can express T(t) only trough fixed constants and T2(t): T’(t)=β*alpha(t)*((γ-1)*T2(t)+δ)+(1+alpha(t)*(γ-1))*T2’(t) Assuming that alpha(t)≈0.0012, β ≈0.033 , γ≈1.1 and δ=2, then we have approximately that T’(t)≈0.033*0.0012*0.1*T2(t)+(1+0.0012*0.1)*T2(t)=0.00000396*T2(t)+1.00012*T2’(t) So that T’(t) is dominate by the rate of increase of the temperature for the non-UHI area. In the future, where the UHI area could increase significantly as well as the UHI temperatures, the UHI effect on the global temperature will increase. This is however not a proof of that the UHI ‘s have no or a marginal influence on the global temperature. It is only an indication. To improve these remarks, I need a better estimated of the UHI area for the last 50 years as well as the UHI temperatures. Summary: 1. It is unlikely, that higher temperature in UHI ‘s up to now has any influence on the global temperature 2. It is unlikely, that the difference in the rate of increase in the temperature up to now has any significant influence on the global temperature. 3. The definition of urban areas and estimation of the urban area has improved thanks to Schneider et al [1]. 4. In the future it can’t be excluded that the UHI area could have a influence on global warming. Reference: [1] http://iopscience.iop.org/1748-9326/4/4/044003/pdf/erl9_4_044003.pdf
    0 0
  17. As Spock would say, "Fascinating." I'm reading this article in June 2012, quite a while after the BEST study was published (*deliciously* funded by the uber-deniers, the Koch Bros) and as such, it all looks a bit....not sure of the word. Suffice it to say, the results of the BEST paper, coupled with its funding source, have essentially laid the UHI effect, at least as a proximate cause of all GW, to its deserved rest, rendering it useless as a viable "fact" for the deniers' pursuit of any small crumb thay can latch onto, to reject all of the published science on AGW. I love it when a plan comes together....;)
    0 0
    Moderator Response: [DB] Hot-linked quote. :)
  18. vroomie, And yet both Anthony Watts and Roy Spencer continue to pursue it. What does that tell you?
    0 0

Prev  1  2  

You need to be logged in to post a comment. Login via the left margin or if you're new, register here.


The Consensus Project Website

THE ESCALATOR

(free to republish)


© Copyright 2024 John Cook
Home | Translations | About Us | Privacy | Contact Us