Climate Science Glossary

Term Lookup

Enter a term in the search box to find its definition.

Settings

Use the controls in the far right panel to increase or decrease the number of terms automatically displayed (or to completely turn that feature off).

Term Lookup

Settings


All IPCC definitions taken from Climate Change 2007: The Physical Science Basis. Working Group I Contribution to the Fourth Assessment Report of the Intergovernmental Panel on Climate Change, Annex I, Glossary, pp. 941-954. Cambridge University Press.

Home Arguments Software Resources Comments The Consensus Project Translations About Support

Bluesky Facebook LinkedIn Mastodon MeWe

Twitter YouTube RSS Posts RSS Comments Email Subscribe


Climate's changed before
It's the sun
It's not bad
There is no consensus
It's cooling
Models are unreliable
Temp record is unreliable
Animals and plants can adapt
It hasn't warmed since 1998
Antarctica is gaining ice
View All Arguments...


Username
Password
New? Register here
Forgot your password?

Latest Posts

Archives

A detailed look at climate sensitivity

Posted on 8 September 2010 by dana1981

Some global warming 'skeptics' argue that the Earth's climate sensitivity is so low that a doubling of atmospheric CO2 will result in a surface temperature change on the order of 1°C or less, and that therefore global warming is nothing to worry about. However, values this low are inconsistent with numerous studies using a wide variety of methods, including (i) paleoclimate data, (ii) recent empirical data, and (iii) generally accepted climate models.

Climate sensitivity describes how sensitive the global climate is to a change in the amount of energy reaching the Earth's surface and lower atmosphere (a.k.a. a radiative forcing).  For example, we know that if the amount of carbon dioxide (CO2) in the Earth's atmosphere doubles from the pre-industrial level of 280 parts per million  by volume (ppmv) to 560 ppmv, this will cause an energy imbalance by trapping more outgoing thermal radiation in the atmosphere, enough to directly warm the surface approximately 1.2°C.  However, this doesn't account for feedbacks, for example ice melting and making the planet less reflective, and the warmer atmosphere holding more water vapor (another greenhouse gas). 

Climate sensitivity is the amount the planet will warm when accounting for the various feedbacks affecting the global climate.  The relevant formula is:

dT = ?*dF

Where 'dT' is the change in the Earth's average surface temperature, '?' is the climate sensitivity, usually with units in Kelvin or degrees Celsius per Watts per square meter (°C/[W m-2]), and 'dF' is the radiative forcing, which is discussed in further detail in the Advanced rebuttal to the 'CO2 effect is weak' argument.

Climate sensitivity is not specific to CO2

A common misconception is that the climate sensitivity and temperature change in response to increasing CO2 differs from the sensitivity to other radiative forcings, such as a change in solar irradiance.  This, however, is not the case.  The surface temperature change is proportional to the sensitivity and radiative forcing (in W m-2), regardless of the source of the energy imbalance. 

In other words, if you argue that the Earth has a low climate sensitivity to CO2, you are also arguing for a low climate sensitivity to other influences such as solar irradiance, orbital changes, and volcanic emissions.  Thus when arguing for low climate sensitivity, it becomes difficult to explain past climate changes.  For example, between glacial and interglacial periods, the planet's average temperature changes on the order of 6°C (more like 8-10°C in the Antarctic).  If the climate sensitivity is low, for example due to increasing low-lying cloud cover reflecting more sunlight as a response to global warming, then how can these large past climate changes be explained?

ice core temps

Figure 1: Antarctic temperature changes over the past 450,000 years as measured from ice cores

What is the possible range of climate sensitivity?

The IPCC Fourth Assessment Report summarized climate sensitivity as "likely to be in the range 2 to 4.5°C with a best estimate of about 3°C, and is very unlikely to be less than 1.5°C. Values substantially higher than 4.5°C cannot be excluded, but agreement of models with observations is not as good for those values."

Individual studies have put climate sensitivity from a doubling of CO2 at anywhere between 0.5°C and 10°C; however, as a consequence  of increasingly better data, it appears that the extreme higher and lower values are very unlikely.  In fact, as climate science has developed and advanced over time , estimates have converged around 3°C.  A summary of recent climate sensitivity studies can be found here

A study led by Stefan Rahmstorf concluded "many vastly improved models have been developed by a number of climate research centers around the world. Current state-of-the-art climate models span a range of 2.6–4.1°C, most clustering around 3°C" (Rahmstorf 2008).  Several studies have put the lower bound of climate sensitivity at about 1.5°C,on the other hand, several others have found that a sensitivity higher than 4.5°C can't be ruled out.

A 2008 study led by James Hansen found that climate sensitivity to "fast feedback processes" is 3°C, but when accounting for longer-term feedbacks (such as ice sheet
disintegration, vegetation migration, and greenhouse gas release from soils, tundra or ocean), if atmospheric CO2 remains at the doubled level, the sensitivity increases to 6°C based on paleoclimatic (historical climate) data.

What are the limits on the climate sensitivity value?

Paleoclimate

The main limit on the sensitivity value is that it has to be consistent with paleoclimatic data.  A sensitivity which is too low will be inconsistent with past climate changes - basically if there is some large negative feedback which makes the sensitivity too low, it would have prevented the planet from transitioning from ice ages to interglacial periods, for example.  Similarly a high climate sensitivity would have caused more and larger past climate changes.

One recent study examining the Palaeocene–Eocene Thermal Maximum (about 55 million years ago), during which the planet warmed 5-9°C, found that "At accepted values for the climate sensitivity to a doubling of the atmospheric CO2 concentration, this rise in CO2 can explain only between 1 and 3.5°C of the warming inferred from proxy records" (Zeebe 2009).  This suggests that climate sensitivity may be higher than we currently believe, but it likely isn't lower.

Recent responses to large volcanic eruptions 

Climate scientists have also attempted to estimate climate sensitivity based on the response to recent large volcanic eruptions, such as Mount Pinatubo in 1991.  Wigley et al. (2005) found:

"Comparisons of observed and modeled coolings after the eruptions of Agung, El Chichón, and Pinatubo give implied climate sensitivities that are consistent with the Intergovernmental Panel on Climate Change (IPCC) range of 1.5–4.5°C. The cooling associated with Pinatubo appears to require a sensitivity above the IPCC lower bound of 1.5°C, and none of the observed eruption responses rules out a sensitivity above 4.5°C."

Similarly, Forster et al. (2006) concluded as follows.

"A climate feedback parameter of 2.3 +/- 1.4 W m-2 K-1 is found. This corresponds to a 1.0–4.1 K range for the equilibrium warming due to a doubling of carbon dioxide"

Other Empirical Observations

Gregory et al. (2002) used observed interior-ocean temperature changes, surface temperature changes measured since 1860, and estimates of anthropogenic and natural radiative forcing of the climate system to estimate its climate sensitivity.  They found:

"we obtain a 90% confidence interval, whose lower bound (the 5th percentile) is 1.6 K. The median is 6.1 K, above the canonical range of 1.5–4.5 K; the mode is 2.1 K."

Examining Past Temperature Projections

In 1988, NASA climate scientist Dr James Hansen produced a groundbreaking study in which he produced a global climate model that calculated future warming based on three different CO2 emissions scenarios labeled A, B, and C (Hansen 1988).   Now, after more than 20 years, we are able to review Hansen’s projections.

Hansen's model assumed a rather high climate sensitivity of 4.2°C for a doubling of CO2.  His Scenario B has been the closest to reality, with the actual total radiative forcing being about 10% higher than in this emissions scenario.  The warming trend predicted in this scenario from 1988 to 2010 was about 0.26°C per decade whereas the measured temperature increase over that period was approximately 0.18°C per decade, or about 40% lower than Scenario B.

Therefore, what Hansen's models and the real-world observations tell us is that climate sensitivity is about 40% below 4.2°C, or once again, right around 3°C for a doubling of atmospheric CO2.

Probabilistic Estimate Analysis

Annan and Hargreaves (2009) investigated various probabilistic estimates of climate sensitivity, many of which suggested a "worryingly high probability" (greater than 5%) that the sensitivity is in excess of than 6°C for a doubling of CO2.  Using a Bayesian statistical approach, this study concluded that

"the long fat tail that is characteristic of all recent estimates of climate sensitivity simply disappears, with an upper 95% probability limit...easily shown to lie close to 4°C, and certainly well below 6°C."
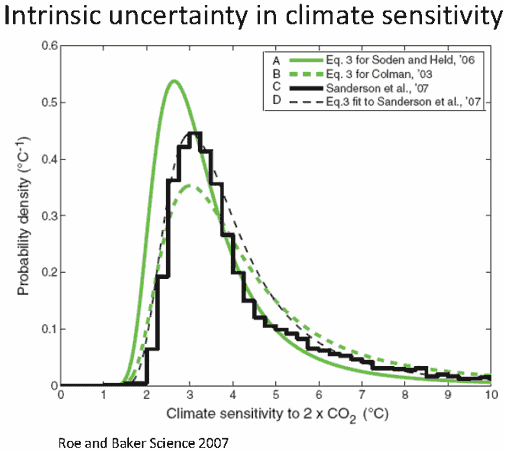
Annan and Hargreaves concluded that the climate sensitivity to a doubling of atmospheric CO2 is probably close to 3°C, it may be higher, but it's probably not much lower.


sensitivity-big.gif
 
Figure 2: Probability distribution of climate sensitivity to a doubling of atmospheric CO2

Summary of these results

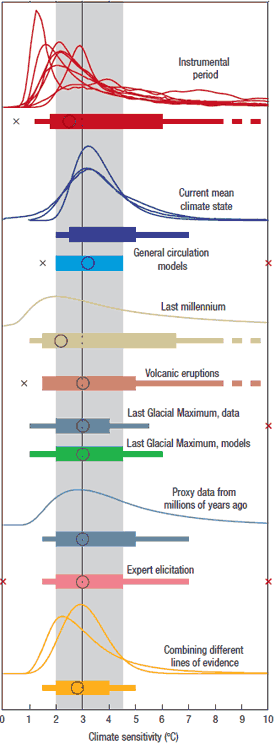
Knutti and Hegerl (2008) presents a comprehensive, concise overview of our scientific understanding of climate sensitivity.  In their paper, they present a figure which neatly encapsulates how various methods of estimating climate sensitivity examining different time periods have yielded consistent results, as the studies described above show.  As you can see, the various methodologies are generally consistent with the range of 2-4.5°C, with few methods leaving the possibility of lower values, but several unable to rule out higher values.

sensitivity summary

Figure 3: Distributions and ranges for climate sensitivity from different lines of evidence. The circle indicates the most likely value. The thin colored bars indicate very likely value (more than 90% probability). The thicker colored bars indicate likely values (more than 66% probability). Dashed lines indicate no robust constraint on an upper bound. The IPCC likely range (2 to 4.5°C) and most likely value (3°C) are indicated by the vertical grey bar and black line, respectively.

What does all this mean?

According to a recent MIT study, we're currently on pace to reach this doubled atmospheric CO2 level by the mid-to-late 21st century.

mit-ppm.jpg
Figure 4: Projected decadal mean concentrations of CO2.  Red solid lines are median, 5%, and 95% for the MIT study, the dashed blue line is the same from the 2003 MIT projection.
 
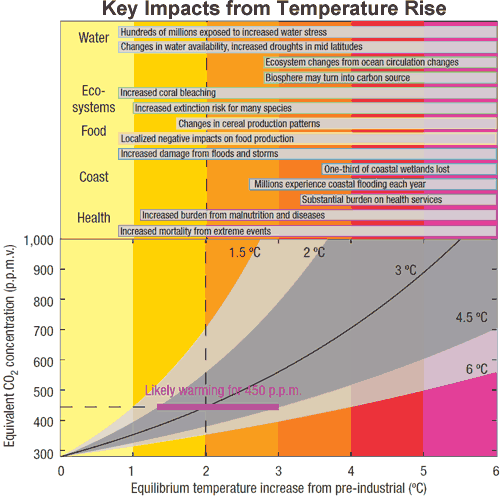
So unless we change course, we're looking at a rapid warming over the 21st century.  Most climate scientists agree that a 2°C warming is the 'danger limit'.   Figure 5 shows temperature rise for a given CO2 level. The dark grey area indicates the climate sensitivity likely range of 2 to 4.5°C.
 
key global warming impacts 
Figure 5: Relation between atmospheric CO2 concentration and key impacts associated with equilibrium global temperature increase. The most likely warming is indicated for climate sensitivity 3°C (black solid). The likely range (dark grey) is for the climate sensitivity range 2 to 4.5°C. Selected key impacts (some delayed) for several sectors and different temperatures are indicated in the top part of the figure.

If we manage to stabilize CO2 levels at 450 ppmv (the atmospheric CO2 concentration as of 2010 is about 390 ppmv), according to the best estimate, we have a probability of less than 50% of meeting the 2°C target. The key impacts associated with 2°C warming can be seen at the top of Figure 5. The tight constraint on the lower limit of climate sensitivity indicates we're looking down the barrel of significant warming in future decades.

As the scientists at RealClimate put it,
"Global warming of 2°C would leave the Earth warmer than it has been in millions of years, a disruption of climate conditions that have been stable for longer than the history of human agriculture. Given the drought that already afflicts Australia, the crumbling of the sea ice in the Arctic, and the increasing storm damage after only 0.8°C of warming so far, calling 2°C a danger limit seems to us pretty cavalier."

This post is the Advanced version (written by dana1981) of the skeptic argument "Climate sensitivity is low". Note: a Basic version is on its way and should be published shortly.

0 0

Printable Version  |  Link to this page

Comments

Prev  1  2  3  

Comments 101 to 116 out of 116:

  1. Eric: "The category of "very likely" (90%) encompasses the range from 1C to well over 5C in most cases, so it doesn't help much." This comment strongly suggests that you don't understand the probabilistic arguments. A 90% credible interval is the error bars. The fact that they range from 1C to 5C tells us that there is a large uncertainty in our knowledge of the correct value. This is exactly the reason that it is unreasonable to assume it lies as the low end, as that is pretending we are more certain than we actually have evidence to support.
    0 0
  2. Eric, Sorry, I don't see any further point to discussing this with you, as you seemed to be totally and completely trapped in the mind set that 1) The models are inadequate 2) Everything is based on the models 3) Therefore any conclusions are inadequate As long as you are trapped in this mindset discussion hopeless, and your perception of and opinion on anything will remain too narrowly constrained to allow for any reasonable progress in the conversation. Sorry, but I just don't see the point in discussing this with someone who turns every single discussion, no matter what the details, back to "the models are inadequate."
    0 0
  3. Eric (skeptic) - " I don't think "1°C is reasonable" but it is plausible." "plausible - Seeming reasonable or probable." You keep using that word. I do not think it means what you think it means. Given under the evidence the 90% probability of a sensitivity between 1°C and 5°C (and yes, that range does indeed represent the error bars on our knowledge), 1°C sensitivity to doubling of CO2 represents only a 5% chance - equally probable as a 5°C sensitivity. A 1°C sensitivity given our current knowledge is not plausible, it is possible but unlikely. You are claiming that a 1/20 chance is "probable", and that's just not supportable. Given the evidence, 1°C is not a good bet.
    0 0
  4. Eric, Most of the data summarized in the table is observations, not models. There is a single line for models. Your claim "the apparent probability density functions are not actually PDFs but model run density functions" is simply incorrect and evidence of complete denial. Welcome to the 3%. The overwhelming majority of the data idicating a 3C sensitivity comes from direct observations, not models. If your claim to uncertainty is that observed data is modeled there is no room for discussion.
    0 0
  5. Dikran, the perturbed physics experiments are interesting. One could do entire studies on just a single parameter, for example http://en.wikipedia.org/wiki/Entrainment_(meteorology) Michael, apart from paleo and volcanoes (similar to paleo), the data is depicted in distributions. When I read the methodology to turn observations into climate sensitivity estimates, for example, Wikipedia's description I do not see any way to arrive at a PDF (or something like it). If someone knows how to arrive at the PDF (or whatever) without a model, please let me know.
    0 0
  6. Eric, Your reply to my point about perturbed physics experiments is pure evasion. Of course one could perform a perturbed physics experiment on just one variable, and indeed climatologists often do, but that is entirely missing the point, as I think you know perfectly well. Peturbed physics experiments can be performed to investigate the range of plausible parameter values, which is an answer to your previous question. Frankly you should be ashamed of yourself. Well all here have better things to do than respond to this sort of sophistry. You have made it clear that you are not interested in answers to your questions, so I for one will stop supplying them.
    0 0
  7. Eric, I note that the line in the graphic that says "combining different lines of evidence" shows the range 1.5-5.0 C. That means 1C is 1% or less. Your argument puts you strongly in the denier campp. Please show me again how you arrived with 1C as the most plausible result. 7C is at least as likely.
    0 0
  8. Eric, you seem to be playing with words. First you say the probabilities presented by K&H are dismissed because they "are not actually PDFs but model run density functions". When presented with this inaccuracy, that much of the data is not model based, you say "the data is depicted in distributions.... I do not see any way to arrive at a PDF... without a model". So the probabilities presented by K&H are dismissed because they are either model based or else because it must be model based, because you personally don't know how they could determine a range of probabilities in any other way. Is this correct? Is this your stance? So with one sweep of the hand you dismiss thirty years of climate sensitivity studies because, in your mind, it must have come from models and you don't trust the models. How can you not recognize that your own thought patterns are based 100% in total, irrational denial?
    0 0
  9. Sphaerica, yes, there is no other way I know of to obtain the curves that look like PDF's in the figure above. In some cases there is no curve (volcanic, LGM data, LGM models) which means there was one model run or no model runs (just an energy balance type of calculation for before and after the climate change and apportionment to CO2 and other forcings and feedbacks). Michael, you are correct in general that my estimate made dfrmo the low end of paleo data is lower than most experts in the field and I repeat from above that there are possible positive feedbacks that I am not considering when making that estimate since those are untested and unrepresented in the paleo data. But I would not combine the "PDF" evidence the way they did because I do not believe they are independent or PDF. The relevant numbers for estimating the range of sensitivity (S) are the CO2 rise from 190 to 280 with a corresponding temperature rise of 6C. The rise is a little under 1/2 of a doubling so that gives an upper bound of 12C for S. Looking raw forcing changes, albedo is 3.5 W/m2, dust is as much as 1 W/m2 and CO2 is 2 W/m2. Weather changes create energy balance changes too (although people here have argued otherwise), but for this argument we will assume that all weather changes that affect S for G to IG also apply to S from present to doubled CO2. From that evidence there is roughly 1C change per 1W/m2 of forcing. That would then imply 4C for S. But unlike glacial to interglacial, there is not a lot ice albedo change left in the current climate. Assuming there is none and no contribution from reduced dust, that cuts S to 2C. But uncertainty in glacial forcing will make that estimate lower. For example if stronger winds during the glacial period caused more net cooling (see the diagram in my post 94) then then S going forward will be lower unless average winds increase. Likewise S will be lower if factors like glacial dust were underestimated.
    0 0
  10. I just found an old reference ice age climate forcings and I am a little low in GHE forcing from G to IG, but probably not enough to matter much.
    0 0
  11. Eric, You are very confused. If you insist on pursuing this course, I strongly suggest that you read a copy of K&H (link in the post above), and also find and read copies of each of the studies included in K&H, so that you will then know which studies did or did not use what sorts of models or observations, what their range of estimate was, what the certainties/error bars were, etc. [You are on the right track by noticing that there is no probability function in some of the estimates, because yes, they did not use models or have a broad sampling of statistical data, and so their estimate was as simple as a low and a high value with a best guess. But again, your propensity to then immediately gravitate to the low values and ignore the rest is indefensible. Denial, plain and simple.]
    0 0
  12. That's a good idea. I found ref 59: Schneider_etal_climate_sensitivity.pdf
    0 0
  13. Eric, So if you discount all the feedbacks the climate sensitivity would only be 1C. You have hit the nail right on the head! Everyone knows this, why didn't you suggest it sooner? Unfortunately, there are copius positive feedbacks and much less negative ones. The final climate sensitivity including feedbacks is estimated to be 3C for the short term and 6C for the long term. Too bad for all those people in 200 years! You must include the feedbacks. As for a lack of ice feedbacks, please provide me a calculation of the feedback due to the current loss of snow cover in the northern hemisphere (see the global snow lab at Rutgers for data) and the albeido response for the loss of Arctic sea ice. The sea ice alone has been estimated as equal to 20 years of CO2 emissions. The snow loss is comparable. Deniers make such absurd arguments. Are you really completely uninformed about the snow and ice loss you so easily dismiss? Please read up on the background information so your claims become more realistic.
    0 0
  14. Michael, my claim is fairly narrow: that the use of paleo evidence should point to a lower sensitivity considering the uncertainties (underestimated dust, ignoring the positive feedback of benign interglacial weather with lower latent heat flux). I do not claim that there are not new positive feedbacks that will raise S that were not part (or not a major part) of the G to IG transition. As for your question which is how does albedo change now compare to albedo change from G to IG in order for S to be similar. The answer is it is not comparable. First of all, earth-averaged albedo can vary week to week to cause 0.1C or more of warming or cooling in GAT, so random fluctuations in cloud albedo overwhelms surface changes like snow and ice loss in the short term. Over the long term the albedo evidence is mixed. One problem is the influence of decadal cycles. Here's an older paper showing a long term decline followed by a short term rise: Changes in Earth’s Reflectance over the Past Two Decades I'm sure there are more recent articles but I don't have one handy. But it does not appear that the melting snow and ice has much of an effect on albedo.
    0 0
  15. Eric, Please provide references to the peer reviewed literature to support your wild claims. Papers older than 2007 should reference the IPCC report. Your hand waving claims concerning feedback and the current catastrophic ice loss in the Arctic only illustrate your denial. On another thread (why did you post the same junk on two threads at the same time?) a poster referenced the water vapor feedback which I notice you have ignored. In 1894 Arrhenius did these calculations by hand. You still have not caught up with him. I suggest you read this seminal work. Obviously he understood something you have missed completely. Since you have such a concern about models: Arrhenius predicted over 100 years ago a climate sensitivity of 4.5C. This prediction remains solidly in the high probability range of climate sensitivity. Your 1C is way outside the range. What does that say about your predictions?
    0 0
  16. Michael, I had to work today and appreciate your patience. Here's an JGR article for which I only have an abstract: Estimating the global radiative impact of the sea ice–albedo feedback in the Arctic which puts the albedo affect of sea ice loss at approx. 0.1W/m2. From the bottom of this page http://www.esrl.noaa.gov/gmd/aggi/ we can see that's the same forcing as about 3 years worth of manmade GHG. That's only ice, they don't have numbers for loss of permanent snow. The total realistic forcing from ice loss from the abstract above is 0.3W/m2. The total forcing from albedo from ice loss during the G to IG transition is 3.5 W/m2 or 10 times as much (see my link in #110 above). Put another way, as Milankovitch forcing (?? W/m2) triggered the 6C G to IG change, it was supplemented by 3W/m2 positive feedback from all CHG (same link) and 3.5W/m2 positive feedback from ice albedo. This time with MM doubling of CO2 we will get 4W/m2 of forcing with just 0.3W/m2 ice loss albedo. However there are other potential positive feedbacks like extra methane release which were a relatively minor part of the G to IG transition. Those will increase S. But S estimated from paleo data alone is quite low because the amplification by albedo (never mind dust) is a lot less now than during G to IG (leftmost red squares in KH08 fig 3b). IOW, there is no serious global amplifying affect from Arctic sea ice loss and a corresponding lower sensitivity to primary forcings unless one considers new sources of positive feedback.
    0 0

Prev  1  2  3  

You need to be logged in to post a comment. Login via the left margin or if you're new, register here.


The Consensus Project Website

THE ESCALATOR

(free to republish)


© Copyright 2024 John Cook
Home | Translations | About Us | Privacy | Contact Us