Climate Science Glossary

Term Lookup

Enter a term in the search box to find its definition.

Settings

Use the controls in the far right panel to increase or decrease the number of terms automatically displayed (or to completely turn that feature off).

Term Lookup

Settings


All IPCC definitions taken from Climate Change 2007: The Physical Science Basis. Working Group I Contribution to the Fourth Assessment Report of the Intergovernmental Panel on Climate Change, Annex I, Glossary, pp. 941-954. Cambridge University Press.

Home Arguments Software Resources Comments The Consensus Project Translations About Support

Bluesky Facebook LinkedIn Mastodon MeWe

Twitter YouTube RSS Posts RSS Comments Email Subscribe


Climate's changed before
It's the sun
It's not bad
There is no consensus
It's cooling
Models are unreliable
Temp record is unreliable
Animals and plants can adapt
It hasn't warmed since 1998
Antarctica is gaining ice
View All Arguments...


Username
Password
New? Register here
Forgot your password?

Latest Posts

Archives

Is Antarctic ice melting or growing?

Posted on 4 October 2008 by John Cook

I recently received an email asking how could I state Antarctica was melting when it's currently showing record sea ice cover. Actually, the email didn't frame the question quite that politely (I was accused of being a liar and an alarmist). Nevertheless, it brings up an interesting point. How could Antarctica be overall losing mass if in 2007, it showed the highest amount of sea ice extent since satellite measurements began? Firstly, we must distinguish between land ice and sea ice. This post looks at the state of Antarctic land ice - the next post will look at sea ice.

Gravity measurements of Antarctic land ice mass

Measuring changes in Antarctic land ice mass has been a difficult process due to the ice sheet's size and complexity. However, over the last few years, the Gravity Recovery and Climate Experiment (GRACE) satellites have been able to comprehensively survey the entire ice sheet. Using measurements of time-variable gravity, Velicogna 2007 determined mass variations of the entire Antarctic ice sheet from 2002 to 2005. They found the overall mass of the ice sheet decreased significantly, at a rate of 152 ± 80 cubic kilometers of ice per year (equivalent to 0.4 ± 0.2 millimeters of global sea-level rise per year). Most of this mass loss came from the West Antarctic Ice Sheet. Figure 1 displays Antarctica's ice mass from 2002 to 2005 - the red crosses is their best estimate with the dotted line the linear trend.
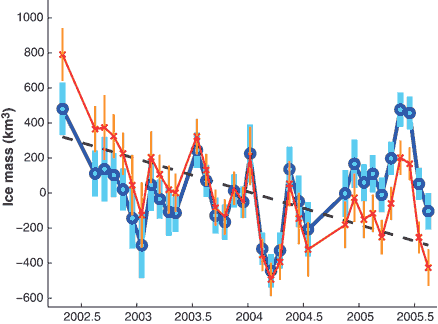

Figure 1: GRACE monthly mass solutions for the Antarctic ice sheet for April 2002 to August 2005. Blue circles show results after removing the hydrology leakage. Red crosses show results after also removing the PGR signal. The latter represent our best estimates of mass variability. Also shown is the linear trend that best fits the red crosses.

Also illuminating is Figure 2 which contrasts the mass changes in West Antarctica (red) compared to East Antarctica (green):
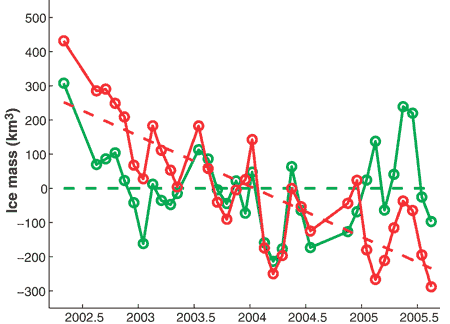

Figure 2: Monthly ice mass changes and their best-fitting linear trends for WAIS (red) and EAIS (green) for April 2002 to August 2005.

Most of the Antarctic mass loss comes from Western Antarctica with a mass loss of 148 ± 21 km3/year. The mass loss from East Antarctica is 0 ± 56 km3/year. Because of its relatively large uncertainty, it's uncertain whether East Antarctica is in mass balance or not.

Why is Western Antarctica losing ice mass while East Antarctica is relatively steady. The hole in the ozone layer above the South Pole causes cooling in the stratosphere. This increases circular winds around the continent preventing warmer air from reaching east Antarctica and the Antarctic plateau. The flip side of this is the Antarctic Peninsula in Western Antarctica has "experienced some of the fastest warming on Earth, nearly 3°C over the last half-century".

The more interesting puzzle is that of Antarctic sea ice which has  increased since satellite measurements began in 1978. Many assume this is because the Southern Ocean around Antarctica must be cooling. This is surprisingly not the case - the Southern Ocean has been warming at a rate greater than other ocean basins. So what's the answer to this paradox? Stay tuned...

0 0

Printable Version  |  Link to this page

Comments

Prev  1  2  

Comments 51 to 73 out of 73:

  1. re #43/47 You're arguing fruitlessly through a semantic confusion over the concept of "equilibrium". Why not just go back and read my post #29 where I explained explcitly the use of the concepts of equilibrium and thermodynamics in consideration of natural phenomenon. If you think there's something wrong with the descriptions I gave there then address those specifically. But please stop tedious argumentation based on semantic misunderstanding. As for "equilibrium sensitivity" that's also a straightforward and easily understood concept. Imagine the sun started to irradiate more strongly. I'm sure we'd agree that the Earth's temperature would rise; we could easily calculate the eventual temperature rise (x oC). Would the Earth become x oC warmer instantaneously? No. x oC would be the temperature rise once the various elements of the climate system came to a new equilibrium with the enhanced forcing. It's useful to consider this in terms of an equilibrium rise since the various elements respond on very different time scales. The troposphere would warm initially quite quickly..the water vapour concetration would rise fairly quickly to give an amplification of the solar warming...the oceans would take a long time to come near to equilibrium with the enhanced forcing. Slow ice sheet retreat would give a further slow feedback amplfication through albedo effects...and so on. That's what "equilibrium sensitivity" refers to. We can contrast this with "transient responses" that relate to the short term responses to forcings under conditions that are far from equilibrium (but tending towards a new equilibrium state). So in our example of enhanced solar forcing, the Earth might be a bit warmer two years after the onset of enhanced solar, and likely warmer still 10 years later, but the temperature rise would be far short of the eventual (equilibrium) temperature rise than might take many decades to come near to equilibrium and many 100's or even 1000's of years before the oceans and ice sheets responded fully to the change in solar forcing None of this precludes the obvious point that any other cyclical or stochastic elements of the climate system that causes short term temperature fluctuations still apply (as I said in post #29).
    0 0
  2. chris Re: "So in our example of enhanced solar forcing, the Earth might be a bit warmer two years after the onset of enhanced solar, and likely warmer still 10 years later, but the temperature rise would be far short of the eventual (equilibrium) temperature rise than might take many decades to come near to equilibrium and many 100's or even 1000's of years before the oceans and ice sheets responded fully to the change in solar forcing" That IS EXACTLY the point I am trying to make. It's always TRYING to reach equilibrium but NEVER CAN because the goal posts keep moving.
    0 0
  3. Patrick Re: "Is the level of the nearest large body of water at all predictable?" Not in an open system. Best example is lake Huron. Snow melt, rainfall and evaporation are taken into account but then we find water is entering also from the lake bottom through "sinkholes". - Remember that discussion we had on Ned Potters blog about why the sea level has not changed as expected?
    0 0
  4. "but then we find water is entering also from the lake bottom through "sinkholes". " And has the lake overflowed, spilling back into Lake Superior (reversing the normal flow)?
    0 0
  5. It isn't surprising that a lake would have some connection to groundwater flows. Many do. (I have heard that natural processes may cause the Great Lakes to largely dry up over the next 20,000 years or so - but that was way back in elementary school. Not that it would be a linear process, but ... I'm guessing that would be on the order of a 1 foot drop per century - although I think the centers of some of those lakes are actually quite a bit deeper than 200 feet, as I recall (is the deepest point in Lake Superior below sea level?)).
    0 0
  6. "That IS EXACTLY the point I am trying to make. It's always TRYING to reach equilibrium but NEVER CAN because the goal posts keep moving. " Yes, but the goal posts tend to stay within a particular part of the field when boundary conditions (external forcing) are constant - in other words, on time scales longer than internal variability, there is a tendency to be near a definable long-term equilibrium. Saying that the climate system ever reaches equilibrium precisely would be wrong, but it can be a good approximation.
    0 0
  7. Patrick Re: "And has the lake overflowed, spilling back into Lake Superior (reversing the normal flow)?" Niagara Falls reverse flow? I don't think so. ps It's salt water. The reports says that they have assumed the the salt is carried up with a fresh water current. But you and I both know what "assume" means.
    0 0
  8. Re: "Yes, but the goal posts tend to stay within a particular part of the field when boundary conditions (external forcing) are constant" But they are not constants, they are chaotic variables.
    0 0
  9. Re: "although I think the centers of some of those lakes are actually quite a bit deeper than 200 feet, as I recall (is the deepest point in Lake Superior below sea level?))." This is a part of a "joining of ancient plate boundaries" so it was ancient shoreline and possibly a subduction zone millions of years ago. Yes, I have no doubt that the bottom is below sea level. There is currently an article featured on LiveScience but I can't open the site to get a link. They decided to change their format and screwed their server up royal. I can't even sign in. If it ever comes back online I will post a link for you. The high side of the falls is the american side so the canadian side had to slide under it with the compression from the atlantic and arctic ridges. Erie and Huron would be right on that subducted part of the canadian shield.
    0 0
  10. ps The mountains in Vermont are growing again.
    0 0
  11. Patrick This is the article on Huron. http://www.livescience.com/animals/090224-great-lakes-extremes.html
    0 0
  12. "But they are not constants, they are chaotic variables." Please see my comments (and the post itself) here: "Butterflies, tornadoes and climate modelling" http://www.realclimate.org/index.php/archives/2008/04/butterflies-tornadoes-and-climate-modelling/langswitch_lang/sw (my comments: 50-52,65,73) ---- "This is a part of a "joining of ancient plate boundaries"" It's more complicated than that, though. There were many early collisions to form the Superior province, and then add on to it (Marshfield continent and Penokean orogeny, etc.). The most prominent system of faults underlying Lake Superior (and extending toward Kansas and eastward as well) formed as the Keweenawan rift (extensional), which did later become compressional features, but never actually became subduction zones. But erosion and sedimentation can cover up older features. Part of the reason for the Great Lakes is glacial erosion, although underlying geology certainly influences how much erosion occurs where. And the density of the basalt from the rifting tends to make the land lower than it otherwise would be. And there is the Wisconsin arch (or dome?) and the Michigan basin... the depression of the Michigan basin has tilted strata upwards going away from it; erosionally resistant strata (Silurian dolomite, is it?) can form escarpments, such as the Niagara escarpment. A string of escarpments wraps around the Michigan basin, through southwestern WI and the door penininsula (I think it's all called the Niagara escarpment - not to be confused with the Niagara fault, a much older feature not connected to the falls), and is what Niagara falls plunges over. Niagara falls is between lakes Erie (the shallowest - it's only into looks) and Ontario, so Lakes Michigan and Huron rising a few meters to be above Lake Superior would not reverse the flow of Niagara falls. "The mountains in Vermont are growing again" I hope the sugar maples are growing much faster.
    0 0
  13. "through southwestern WI and the door penininsula " I meant to say southeastern WI. Southwestern WI has it's own beauty - I'd especially recommend the drive from Madison to Dubuque. And if you're in the Madison area, you've gotta go just north through Sauk City and explore the Baraboo range (made of beautiful erosion-resistant Baraboo quartzite) - Devil's Lake, Parfrey's Glenn. See "Roadside Geology of Wisconsin", Dott and Attig.
    0 0
  14. Re #52 Good Quietman, if you were prepared to read other's posts carefully and not jump to erroneous conclusions you could have avoided a whole load of unnecessary "argumenting". The fact that systems in the natural world may or may not reach equilibrium, however one considers it useful to define this (i.e. "equilibrium") for a particular circumstance, doesn't mean that "equilibrium" and "thermodynamics" are not fundamental concepts without which it would be difficult, if not impossible, to understand natural systems. Have a read of my post #29 from all those weeks ago and see if there really is anything there that you really think it's worth arguing about....
    0 0
  15. #18 Chris, "It's about the real world WA. It's not about model studies in greenhouses and such like. I've cited a load of papers that assess real world effects in posts #7, #13 and #14." If it's not about "model studies" Chris, why do the multitude the papers you studiously proffer in your posts constantly refer to them?
    0 0
  16. re #65, HS, I've referred to 20 papers in posts #7,#13 and #14. 16 of them are based on real world observational evidence (all except Fung, IY; Field, CB; Kurz, WA; Lobell DB); In some cases they assess comparisons of real world observations with models to assess the extent to which current knowledge is reliably represented. Of course addressing future consequences cannot be done other than by extending representations of current and past observational evidence and knowledge into the future, and however one does this one is "modeling". However, in general I've cited papers describing measurements/observations in the real world (16 out of 20) and included some analyses that address future consequences (models)....
    0 0
  17. As we slowly emerge from the last ice age does science predict glaciation to increase or decrease? At what phase of the Milankovitch cycles should we expect glaciation to increase? ie when will the teeter-totter reverse itself? Will it be less tan 25,000 years if so how shall we begin to prepare the next 100,000 generations to deal with it? What do "policy makers" say on this vital public matter?
    0 0
  18. Bruce Frykman - very interesting issues. The next ice age probably won't start for another 30,000 to 50,000 years from now (see IPCC AR4 WGI Chapter 6, also Berger and Loutre, "An Exceptionally Long Interglcial Ahead?", Science vol. 297, Aug 23 2002, pp.1287-1288) - without anthropogenic influences, Berger and Loutre's work find nearly constant Northern Hemisphere ice volume for the next 50,000 years (eyeballing the graph, slight peak 20,000 years from now just a few percent of the change since the last glacial peak, followed by a slight decrease to less ice than now between ~ 25,000 to 45,000 years from now; followed by a much larger increase, about 1/2 the difference since the last glacial maximum, between 50,000 and 60,000/65,000 years from now); with an anthropogenically-driven increase in CO2 to 750 ppm (easily attainable, unfortunately) and then decreasing to "natural" (presumably about preindustrial) values by 1000 years from now, the Greenland ice sheet dissappears, mostly in a few thousand years, essentially zeroing out Northern Hemisphere ice volume, which only starts to recover signifantly in 20,000 or 25,000 years and doesn't return to the natural trajectory until about 50,000 years (and results in the next glacial maximum between 60,000 and 70,000 years from now being about the equivalent of a Greenland less in ice volume). Most interglacials are shorter but there has been at least another long interglacial in the last 500,000 years. The ~20,000 year precession cycle also causes changes in low-latitude monsoons, so one might expect the Sahara to be more moist in ~ 10,000 years from now, as it was several thousand years ago - however, the strength of the precession effect is modulated by the eccentricity of the orbit, which is declining, so the next few cycles in precession will have a reduced effect. The changes in radiative forcing associated with Milankovitch cycles are very slow compared to recent anthropogenic changes (and have a different shape - the important effects are the regional and seasonal redistribution of solar energy, resulting in less or more favorable conditions for either ice sheet formation and growth, or disintegration or decay, which then has a globally-averaged feedback, to which CO2 responds as an additional positive feedback, etc.) However, some climate changes may occur more rapidly in association with the crossing of thresholds. Still, I suspect they would be (given our present and increasing knowledge and assuming continued survival of modern civilization) easier to prepare for and/or adapt to than the more immediate threat of anthropogenic climate change. Whether our descendents decide to mitigate the changes artificially or allow them to occur, well I guess that's up to them (it would be interesting for scientists to observe such long-term natural climate cycles, and with such a long history under the belt of a continuous society, people might get a little bored with Holocene conditions (or more likely, Anthropocene or post-Anthropocene, depending...), and it might be hard to maintain artificial forcing (some types may be prone to sudden collapse, worsenning the threat of sudden climate change - although other schemes could be much more resilient to short term 'mistakes' in management)...) I would argue that it is unwise to rely on unforeseen major game changers to solve global warming adaptation and mitigation problems in the future (at least to do so without correcting for the externality now to encourage such future advancements as well as to reduce the size of the future problem with more immediate advancements (energy-efficient buidings, cheap mass-produced solar cells and solar concentrators, safe C sequestration, perhaps 'Beano' for cows??) ), but how will technology, agriculture, medicine, politics, and culture have changed over 1000+ years? But there are still constraints - the second law of thermodynamics, the safety issues of bringing asteroids into Earth-orbit (?), the unlikelyhood that people will genetically-engineer their descendents to survive on smaller diets (prefering instead to pass down the joy of good food). Future climate-control mechanisms might be integrated into asteroid deflection systems. In preperation for disasters of limited predictability (next Yellowstone supereruption? - or will that become predictable 100+ years in advance?), population size might be reduced (humanely - etc.) from a peak around 2100 down to just a couple billion ?? - so that people have room to migrate (spare farmlands, etc). They wouldn't want to drop the population too low because of the economic advantages of specialization.
    0 0
  19. Patrick: there is no equilibrium, the river level rises and falls continuously in response to the amount of water that enters the river, which is modified by a lot of other factors. If you plotted the river level over a period of time you would get a line that wanders up and down. It is only because it is useful for our mathematical purposes that we lump all those variations into an 'annual mean variation'
    0 0
  20. The noise in ice mass data graphs compared to length of time period is poor. With this data the regression line can point to any direction, depending on selection of start end end dates, and calculated confidence in result will be 0. Besides I could find no significant correlation to NASA's temperature data. If you used better data, please include link. BR Pekka Lehtikoski
    0 0
  21. Mizimi - " It is only because it is useful for our mathematical purposes that we lump all those variations into an 'annual mean variation' " Somewhat aside from my point; anyway, different ecosystems are not scattered about at random, so there must be some real tendencies in the factors that affect ecosystems (like rainfall).
    0 0
  22. Update: "the mass loss increased from 104 Gt/yr in 2002–2006 to 246 Gt/yr in 2006–2009, i.e., an acceleration of −26 ± 14 Gt/yr2 in 2002–2009" http://www.agu.org/pubs/crossref/2009/2009GL040222.shtml PDF: http://thingsbreak.files.wordpress.com/2009/10/increasing-rates-of-ice-mass-loss-from-the-greenland-and-antarctic-ice-sheets-revealed-by-grace.pdf
    0 0
  23. I'm curious why you post such a short time frame to demonstrate Antarctic land ice loss. I could pick a similar timeframe for the Artic (2007-2010) and show a dramatic increase despite the real overall trend down. Is it because there isn't enough data on Antarctic land ice? 2002-2005 doesn't seem like a long enough timeframe to make any predictions on trend. Am I missing something?
    0 0
    Response: At the time, that was the only gravity satellite data available. Since then, more data has come in to show not only is Antarctica losing ice, it's losing ice at an accelerating rate.

Prev  1  2  

You need to be logged in to post a comment. Login via the left margin or if you're new, register here.


The Consensus Project Website

THE ESCALATOR

(free to republish)


© Copyright 2024 John Cook
Home | Translations | About Us | Privacy | Contact Us