Climate Science Glossary

Term Lookup

Enter a term in the search box to find its definition.

Settings

Use the controls in the far right panel to increase or decrease the number of terms automatically displayed (or to completely turn that feature off).

Term Lookup

Settings


All IPCC definitions taken from Climate Change 2007: The Physical Science Basis. Working Group I Contribution to the Fourth Assessment Report of the Intergovernmental Panel on Climate Change, Annex I, Glossary, pp. 941-954. Cambridge University Press.

Home Arguments Software Resources Comments The Consensus Project Translations About Support

Bluesky Facebook LinkedIn Mastodon MeWe

Twitter YouTube RSS Posts RSS Comments Email Subscribe


Climate's changed before
It's the sun
It's not bad
There is no consensus
It's cooling
Models are unreliable
Temp record is unreliable
Animals and plants can adapt
It hasn't warmed since 1998
Antarctica is gaining ice
View All Arguments...


Username
Password
New? Register here
Forgot your password?

Latest Posts

Archives

Arctic sea ice melt - natural or man-made?

Posted on 9 June 2008 by John Cook

Arctic sea ice has declined steadily since the 1970s. However, the 2007 summer saw a dramatic drop in sea ice extent, smashing the previous record minimum set in 2005 by 20%. This has been widely cited as proof of global warming. However, a popular mantra by climatologists is not to read too much into short term fluctuations - climate change is more concerned with long term trends. So how much of Arctic melt is due to natural variability and how much was a result of global warming?

The long term trend in Arctic sea ice

Global warming affects Arctic sea ice in various ways. Warming air temperatures have been observed over the past 3 decades by drifting buoys and radiometer satellites (Rigor 2000, Comiso 2003). Downward longwave radiation has increased, as expected when air temperature, water vapor and cloudiness increases (Francis 2006). More ocean heat is being transported into Arctic waters (Shimada 2006).

As sea ice melts, positive feedbacks enhance the rate of sea ice loss. Positive ice-albedo feedback has become a dominant factor since the mid-to-late 1990s (Perovich 2007). Older perennial ice is thicker and more likely to survive the summer melt season. It reflects more sunlight and transmits less solar radiation to the ocean. Satellite measurements have found over the past 3 decades, the amount of perennial sea ice has been steadily declining (Nghiem 2007). Consequently, the mean thickness of ice over the Arctic Ocean has thinned from 2.6 meters in March 1987 to 2.0 meters in 2007 (Stroeve 2008).


Global warming has a clearly observed, long term effect on Arctic sea ice. In fact, although climate models predict that Arctic sea ice will decline in response to greenhouse gas increases, the current pace of retreat at the end of the melt season is exceeding the models’ forecasts by around a factor of 3 (Stroeve 2007).
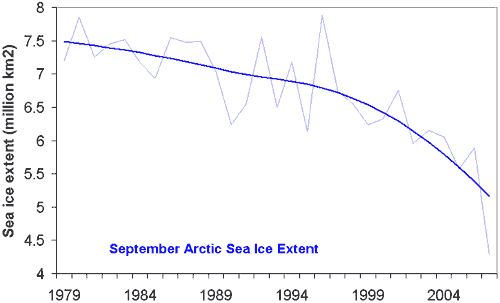


Figure 1: September Arctic Sea Ice Extent (thin, light blue) with long term trend (thick, dark blue). Sea ice extent is defined as the surface area enclosed by the sea ice edge (where sea ice concentration falls below 15%).

What caused the dramatic ice loss in 2007?

The sudden drop in sea ice extent in 2007 exceeded most expectations. The summer sea ice extent was 40% below 1980's levels and 20% below the previous record minimum set in 2005. The major factor in the 2007 melt was anomalous weather conditions.

An anticyclonic pattern formed in early June 2007 over the central Arctic Ocean, persisting for 3 months (Gascard 2008). This was coupled with low pressures over central and western Siberia. Persistent southerly winds between the high and low pressure centers gave rise to warmer air temperatures north of Siberia that promoted melt. The wind also transported ice away from the Siberian coast.

In addition, skies under the anticyclone were predominantly clear. The reduced cloudiness meant more than usual sunlight reached the sea ice, fostering strong sea ice melt (Kay 2008).

Both the wind patterns and reduced cloudliness were anomalies but not unprecedented. Similar patterns occurred in 1987 and 1977. However, past occurances didn't have the same dramatic effect as in 2007. The reason for the severe ice loss in 2007 was because the ice pack had suffered two decades of thinning and area reduction, making the sea ice more vulnerable to current weather conditions (Nghiem 2007).

Conclusion

Recent discussion about ocean cycles have focused on how internal variability can slow down global warming. The 2007 Arctic melt is a sobering example of the impact when internal variability enhances the long term global warming trend.

0 0

Printable Version  |  Link to this page

Comments

Prev  1  2  3  4  5  6  7  8  9  10  11  Next

Comments 301 to 350 out of 529:

  1. "the group velocity is actually the velocity of an interference pattern" Specifically the group velocity moves with the amplitude variation pattern (associated with a 'beat frequency'). "if winds are tending to approach geostrophic balance, then the propagation of Rossby waves may be slowed because the contours of barotropic PV have to move farther than the contours of AV," Because if the AV were conserved, waves in the AV contours could create ageostrophic winds. Postivive geostrophic AV anomalies tend to correspond to relatively lower pressures; the coriolis force tends to act on a positive ageostrophic AV anomaly to cause horizontal divergence, which lowers the pressure and also the AV (if preserving PV), bringing them closer to geostrophic balance with each other. This effect may be reduced if much of the AV gradient is from a relative vorticity gradient, in which case the PV contours may bring some pressure variation along with them that would reduce the ageostrophic portion of the wind. But this may or may not actually be what happens (?)- the relationship of vorticity and pressure is most obvious when there is an actual maximum or minimum, as opposed to a extensive gradient. (However, - in the frame of reference following the basic state wind, curvature of streamlines associated with the wave will add a centrifugal force, which would increase the divergence from growing positive AV anomalies but decrease the convergence in a growing negative AV anomaly.) Would the effect change when the AV is large?; in that case less divergence or convergence would be required to produce a unit change in AV (especially for reducing pressure for a positive AV anomaly)... ----------- PS in case it wasn't clear, the generalization of Rossby waves in any vorticity gradient is that they tend to propagate with higher potential vorticity to their right - north as described above is analogous to the direction of the potential vorticity gradient in general... --- The comment 294 website mentions that a weak vortex may break up and radiate Rossby wave disturbances. A stronger vortex wouldn't do so to the same degree. Why? I suspect it's because a strong vortex might be such that in the total state, some AV or PV contours might form closed loops, or more generally be distorted in some way other than simple nearly sinusoidal forms. In the barotropic case, if there is no mixing and a a quantity is conserved following the motion, closed loop contours of that quantity can never merge with other contours of the same value. In three dimensions and for baroclinic situations, replace contours with surfaces. PS I started to try to draw this out and got the impression that the vorticity anomaly would wobble about itself in the same direction as it's wind field. I think I've read something to that effect. Aside from fluid motion itself, another way to get variations in barotropic PV besides beta (df/dy) is variations in fluid depth. One source of such variation can be the topography of the bottom surface. There will thus tend to be a barotropic PV gradient towards mountain ranges and plateaus in the atmosphere. As pointed out in the comment 294 website, the topography in the northern hemisphere in particular tends to force Rossby waves which are somewhat barotropic (though they also do vertically propagate into the stratosphere and thus allow dynamically-induced high pressures pressing into the west sides of mountainous areas to slow the westerly (eastward) momentum of upper levels. There can be resonance with the wavelength of this forcing with Rossby waves whose phase speeds are such that, for the given wind, they would (without forcing) tend to propagate through the air to almost be stationary with respect to the surface.
    0 0
  2. Eddy fluxes - and the QBO!: One way to look at momentum transfer by waves is form drag. Another way is to look at the eddy flux of the wave. Take any variable, q. the total state q = average q + q', where q' is the perturbation, which must average to zero along the same dimension(s) over which q was averaged to get average q. The product of two eddy quantities, such as u'v', can be averaged, and this average may be nonzero if there is a correlation between u' and v' even thought the average of each is zero. In the case of vertically propagating gravity waves, because of the slantwise perturbation motions (relative to basic state wind), there is a correlation between u' and w' (w is the vertical speed - earlier I used w for angular frequency; that choice was made because w looks like the greek letter 'omega' which is often used for that quantity. w is generally used for the z-component of velocity. Be aware omega also has dual use; it is the vertical motion in pressure coordinates, the rate of change of pressure over time following the motion (omega = Dp/Dt; w = dz/dp * omega; negative omega is upward (positive w))). Thus gravity waves have an average u'w' - averaged over horizontal distance, this is the eddy vertical transport of zonal momentum (per unit mass) at that level. The same can be done with equatorial Kelvin waves, which have similar phase line and group velocity relationships in the zonal direction; but equatorial Kelvin waves can only propagate to the east relative to the air. This can also be done with equatorial Rossby-gravity waves (which only propagate to the west relative to the air), but with a catch. The average u'w' of Rossby-gravity waves does not agree with the form drag - in fact it's the wrong sign. The key to resolving this is that Rossby-gravity waves also have a nonzero average of v'T' - the eddy northward temperature flux. This contributes to an EP flux which can be anylized to figure out what the momentum transfer by these waves actually is. But it's easier to visualize the form drage acting on wavy material surfaces. Vertically propagating equatorial Kelvin waves and equatorial Rossby-gravity waves are able to transfer eastward (westerly) and westward (easterly) momentum upward to the stratosphere, respectively. But what happens to their momentum fluxes/wave stresses? I think, similarly to gravity waves (?): Holton, p.427: "It was pointed out in Section 12.4 that quasi-geostrophic wave modes do not produce any net mean flow acceleration unless the waves are transient or they are mechanically or thermally damped. Similar considerations apply to the equatorial Kelvin and Rossby-gravity modes. Equatorial stratospheric waves are subject to thermal damping by infrared radiation and to both thermal and mechanical damping by small-scale turbulent motions." And then: "Such damping is strongly dependent on the Doppler-shifted frequency of the waves." I believe that refers to the frequency following the air flowing through the waves. "As the Doppler-shifted frequency decreases, the vertical component of group velocity also decreases, and a longer time is available for the wave energy to be damped as it propagates through a given vertical distance." And then: "Thus, the westerly Kelvin waves tend to be damped preferentially in westerly shear zones, where their Doppler-shifted frequencies decrease decrease with height. The momentum flux convergence associated with this damping provides a westerly acceleration of the mean flow and thus causes the westerly shear zone to descend." Rossby-gravity waves, by the same logic, are damped more in easterly shear zones and cause easterly acceleration of the mean flow and thus cause easterly shear zones to descend. If we have weakly westerly flow to start with with some westerly shear, the Kelvin waves will be damped out sooner during upward energy propagation, and their westerly acceleration will be concentrated at lower levels; meanwhile the Rossby-gravity waves' easterly acceleration is not distributed as such. Thus the mean zonal wind becomes more westerly especially at lower levels and somewhat more easterly at upper levels. (PS here, upper and lower are completely relative; this could all be in the stratosphere.) This intensifies the westerlies and the westerly shear beneath them and brings these to lower levels, concentrating and limiting the vertical extent of Kelving wave propagation and the westerly acceleration they induce, while producing an easterly shear zone above the westerlies where Rossby-gravity wave damping is enhanced. This strengthens the easterlies at upper levels. As the westerlies descend, the easterlies increase in strength and descend. Eventually the easterlies may push the westerlies into too thin a layer (?), or crowd them out by pushing them down (below the tropopause) where other forces keep the zonal wind from varying in the same way (?) (see Holton pp. 428-429). As that happens the Kelvin waves are no longer damped so much at the lower levels and are not blocked from reaching upper levels again. Etc. In this way, vertically propagating equatorial Kelvin and equatorial Rossby-gravity waves can drive the QBO - the quasi-biennial oscillation. The QBO is a repetative reveral of the zonal winds in the equatorial stratosphere; it has a period of around 24 to 30 months (Holton p.424). New phases form above 30 km height and propagate downward at around 1 km per month, the propagation occurs without weakenning (attenuation) down to 23 km, but quickly weakens thereafter (Holton p.425). The variation in zonal (east-west) winds is zonally symmetric (doesn't vary much over different longitudes) and is symmetric about the equator, with a maximum amplitude of ~ 20 m/s and "an approximately Gaussian distribution in latitude with a half-width of about 12[deg]," (Holton, pp.424-425). Holton p.424: The QBO is the closest thing found to being a regular periodic atmospheric cycle that is not driven by a periodic forcing. ___________________ The comment 294 website does at at least one point distinguish between eddies and waves. I think the line between them is a matter of perspective and purpose. When looking at the fluxes by waves without resolving individual waves, but rather by looking at the average flux as in v'T' or u'w' or v'q', u'v', etc., these fluxes are referred to as eddy fluxes. When looking explicitly at resolved phenomena at some range of spatial scales, unresolved motions that may produce mixing or fluxes would be called unresolved eddies. The more familiar kind of turbulence is associated with a familiar kind of eddy-viscosity and eddy-mixing (which dominates over molecular viscosity and molecular mixing in most of the atmosphere except in the thinnest layer immediately next to the surface and then I would guess also at very high levels where the density is extremely low; I know that at least for mixing, molecular starts to dominate over eddy at somewhere around - I think 100 km, roughly - this is called the turbopause and marks the top of the homosphere and the bottom of the heterosphere.). This viscosity acts like any normal friction to make the fast slow and the slower faster if next to something fast, etc. On larger scales, different kinds of eddies might be considered to have a negative viscosity associated with them, depending ... (?) Perhaps one way of considering waves and eddies as being different is if waves induce actual waves in the contours of some conserved quantity while eddies have closed loops of such contours. Alternatively, and not necessarily corresponding to the former, one could distinguish between wind fields with wavy strealines and those with closed loop streamlines. Then again, if one uses a frame of reference that follows either the mean wind or some structure (however it propagates relative to the wind), one could distinguish between wavy open trajectories and closed trajectories. PS If a pattern of alternating cyclonic and anticyclonic streamlines is propagating through the air to the east, so that relative to the structures, the air is flowing through these structures to the west, then, if the structures have weak amplitudes, the trajectories are deflected but remain open-ended (being wavy). In the northern hemisphere the trajectories would deflect south around anticyclones and north around cyclones. As the amplitude is increased (or the propagation speed through the air is decreased), however, one would start to get closed trajectories. This would start south of the center of the cyclone and north of the center of the anticyclone.
    0 0
  3. Returning to isolated vortex superimposed on pv or av gradient: One can see (unless the following is wrong*) that there must be some tendency for the relative vorticity 'center' to be displaced from a center of total state PV or AV; with basic state PV or AV increasing to the north, then (in the northern hemisphere) a cyclonic PV/AV anomaly has an associated relative vorticity (RV) anomaly that is displaced to the south relative to the higher PV/AV values in the total PV/AV 'bump', so the wind field will advect the PV/AV anomaly to the west. For an anticyclonic PV/AV anomaly, the RV anomaly is displaced in the opposite direction from the lower values of PV/AV in the total PV/AV 'dent', but the direction of the winds is reversed, so again the anomaly is advected to the west. For a circular vortex, the wind decreases with distance. If the central PV/AV anomaly is balanced by a ring of opposite sign then the wind field can be even more limited. I started to draw this in the case of a vortex of entirely one sign of vorticity; Associated with the westward motion, the growth of anomaly to the west is of the same sign. There is growth of anomaly to the east which is of opposite sign, however (the energy of waves can propagate differently from wave phases by creation or growth of new phase lines). The anomaly growth is strongest along the east-west line where the anomaly winds are more north and south rather than east-west, and is inversely proportional to distance from the center, outside the region of initial anomaly PV/AV. Because of the rotation due to the variation in vorticity in two dimensions, the contours are distorted from a symmetrical wave shape. I have read that vortices may oscillate around their average propagation. The rotation could also cause the new anomaly phases to wrap around a bit, causing an overall tilt to phase lines and opposite tilt to the the extent of disturbances (??). If a vortex is strong or compact enough relative to the basic state gradient, as mentioned before, PV/AV contours may be closed; this tends to start off of center, toward higher basic state PV/AV for positive anomaly and opposite for negative (notice the potential geometric analogy to the trajectory/streamline relationships for propagating cyclones/anticyclones). To the extent that the PV/AV is conserved and not mixed, such closed loops, tending to act as material lines, can be though of as trapping fluid. Thus, unlike the essential aspect of waves, there is some fluid that must propagate with the disturbance. Also, for shorter wavelength Rossby-wave disturbances that might occur within the vortex, they would tend to propagate along such contours and would thus be trapped within the vortex. They might be able to tunnel out to some degree because the wind field can extend farther than the vorticity field; this will be more true for longer wavelengths than shorter wavelengths (the wind at a given distance being less sensitive to fine-scale vorticity variations). My understanding is that, to the degree that a vortex can radiate mechanical waves, it loses amplitude. If some mixing is allowed so that contours can reconnect, then this process could be associated to a vortex propagating towards greater basic state vorticity of the same sign (or reduced basic state vorticity of opposite sign), shedding it's outer layers, until the core eventually reaches basic state vorticity equal to the total vorticity within the original core. (If mixing is not allowed, this couldn't happen with the closed contour 'core' of the vortex - if it still propagates in the same direction, the countours would press up against each other, trapping, stretching and tinning out regions of other vorticity values.) --- Interesting questions: What about a checkerboard pattern of vorticity anomaly - proportional to cos(ly)*cos(kx)? What about such a pattern which is tilted at some angle? --- What about distortion of waves due to differential propagation and wind? The relative vorticity associated with a westerly jet is such that the poleward AV gradient is enhanced across a westerly jet; it is reduced across an easterly jet or relative minimum in westerly winds. (PS in case it wasn't clear before, a westerly wind is eastward (it comes from the west). A northerly wind is from the north. Etc.) Thus, Rossby waves' phase propagation through the air should be faster to the west within a westerly jet. This would oppose the tendency for the winds to carry the Rossby wave phases faster to the east within the jet. Supposing the advection of Rossby waves by the wind is the stronger effect: what would happen? To the north of a westerly jet, a north-south oriented wave phase line would become tilted northwest-southeast, and any that are tilted from northwest to southeast would be distorted such that the wavelength is reduced. Oppositely tilted waves would have their wavelengths increased and also get tilted toward being north-south. Mirror image on the other side of the jet. The zonal wave number is unchanged but the meridional wave number varies. ... Well without going into all the details, the effect, which would be different for different wavelengths, would be to alter the group velocities of the waves. Conceivably one portion of the spectrum might be pulled into a westerly jet (?)(causing it to meander with those wavelengths?) while another portion would be pushed away, and maybe the reverse for an easterly jet or relative minimum in the westerlies (?)
    0 0
  4. Patrick Thank you. The small part of that I managed to understand was interesting. Also thanks for the references. I will see if I can locate a used copy of "Introduction to Geophysical Fluid Dynamics" by Benoit Cushman-Roisin as it sounds like it may illuminate some questions I have.
    0 0
  5. "Introduction to Geophysical Fluid Dynamics" by Benoit Cushman-Roisin, 1 new from $361.71 9 used from $175.00 so I think I will skip this one unless the library has a copy.
    0 0
  6. If you need anything clarified, please ask. (There's a lot I don't know but I'll try.) Books: I'm quite surpised that Cushman-Roisin is so expensive. You may want to look into Holton (An Introduction to Dynamic Meteorology). Two other books (these focus on the midlatitude weather): Mid-Latitude Atmospheric Dynamics A First Course - Jonathan E. Martin and Synoptic-Dynamic Meteorology in Midlatitudes Volume II Observations and Theory of Weather Systems - Howard B. Bluestein The second starts off without introduction to atmospheric physics; I think you could start with Volume I but I don't think you'd need it if you have either Holton, Martin, or maybe Cushman-Roisin. Bluestein, Martin, Holton, and Cushman-Roisin are all focussed on dynamics; of those, Cushman-Roisin gives the most attention to oceanic dynamics as well as atmospheric dynamics. There is also: Atmospheric Science An Introductory Survey - John M. Wallace, Peter V. Hobbs This is a very general book, which even discusses atmospheric electricity and the magnetosphere, as well as radiation, cloud microphysics, and the general circulation. Just the last two chapters (in the edition I have, anyway) go into mathematical detail regarding momentum and dynamics. Global Physical Climatology - Dennis L. Hartmann As with Wallace and Hobbs, a variety of subjects are covered; the distinction is a focus on climatological aspects here. Includes a chapter on oceanic circulation. Also discusses paleoclimatology, natural changes and anthropogenic changes, and climate models. (Which reminds me, Holton has a chapter about numerical modelling) Other books, a little less heavy on the detailed math: Earth's Climate - Past and Future - William F. Ruddiman The title says it all. A lot of good information. Essentials of Meteorology An Invitation to the Atmosphere - C. Donald Ahrens. An introductory level, perhaps too introductory if you've understood a fraction of what I've been saying (then again there are some good climate maps in the back and other interesting things). Snow Ball Earth - Gabrielle Walker For geology books that have some paleoclimatology in them, there's: Evolution of the Earth - Dott and Prothero Ontario Rocks - Nick Eyles
    0 0
  7. There was a book called "Supercontinent" I saw a few months ago in the library; I think that had a little paleoclimate in it (PS I couldn't claim to have actually read through all or most of these books; some I've gone through for specific chapters/sections/topics...). "Cambridge Encyclopedia of Earth Sciences" (which, depending on library, may be checked out despite it's name) is another good one, though a bit 'old' (1980?), but covers a LOT (and it's BIG - I think somewhere around 1000 pages). If you're at the library, I'd suggest also Encyclopedia Britanica - I think they had articles such as "Climate and Weather", "Atmosphere", "Earth"; I forget which article it was in but a great section on the magnetosphere, too. If your library has McGraw-Hill Encyclopedia of Science and Technology, that's a good one too... well now I'm probably just giving you stuff you could easily have found by yourself. With many of the books I mentioned being textbooks, of course your best bet would be a college library. I should mention, I only remember or know of Rossby waves being discussed in the first four that I mentioned (Holton, Cushman-Roisin, Bluestein, Martin) and I think the first three of those have the most coverage of the subject.
    0 0
  8. Earth's Climate - Past and Future - William F. Ruddiman This sounds like what I am looking for. I don't want to study for exams, just do some light reading on subjects of interest. Thanks ps You might find this interesting: ScienceDaily (Nov. 3, 2008): Arctic Sea Ice Is Suddenly Getting Thinner As Well As Receding "The research - reported in Geophysical Research Letters - showed that last winter the average thickness of sea ice over the whole Arctic fell by 26cm (10 per cent) compared with the average thickness of the previous five winters, but sea ice in the western Arctic lost around 49cm of thickness. This region of the Arctic saw the North-West passage become ice free and open to shipping for the first time in 30 years during the summer of 2007." and also from ScienceDaily (Oct. 20, 2008) Less Ice In Arctic Ocean 6000-7000 Years Ago Both interesting.
    0 0
  9. "Arctic Sea Ice Is Suddenly Getting Thinner As Well As Receding" ... important example of the overall concept of thermal inertia / heat capacity and latent heat, or even more generally, any other aspect of climate inertia (sea water composition, vegetative feedbacks, etc.). "Less Ice In Arctic Ocean 6000-7000 Years Ago" The extent of the difference is news to me, but I think at least the Northern Hemisphere was warmer back then compared to more recent times (though maybe not anymore for the last decade or so? - we're getting into that territory). At least some of this longer-term change is caused by orbital (Milankovitch) forcing.
    0 0
  10. I do want to round out the Rossby wave and vorticity subject matter: barotropic PV, isentropic PV, and mass distributions, static stability - the three dimensional fluid. For a geostrophic wind Vg, the coriolis force (or acceleration) is equal and opposite to the pressure gradient force (or acceleration); the coriolis acceleration magnitude is equal to the planetary vorticity f times the wind speed, in the direction to the right of the wind in the northern hemisphere, left in the southern hemisphere (or, since f is negative in the southern hemisphere, it could be described as a negative acceleration to the right of the wind velocity). The geostrophic wind is parallel to isobars on a geopotential or geometric height surface, or to lines of constant geopotential on an isobaric surface (PS note that either way they are the intersections of two sets of surfaces), the speed is proportional to the gradient of geopotential on an isobaric surface (p)or pressure gradient on a geopotential surface (geopotential = z*g, g is gravitational acceleration), and is thus inversely proportional to the spacing of isobars (x,y,z coordinates, spacing on a z surface) or geopotential contours (x,y,p coordinates, spacing on a p surface). It is also inversely proportional to (the absolute magnitude of) planetary vorticity f, since with a smaller f, a greater wind speed is necessary for the coriolis force to balance the pressure gradient force. Geostrophic wind is undefined at the equator (although I think it is possible (?) to define a geostrophic thermal wind - the vertical wind shear due to a horizontal temperature gradient - the key is to take the second spatial derivative of the temperature ...). The geostrophic wind blows cyclonically around low pressure and anticyclonically around high pressure. In x,y,z coordinates, the momentum equations are such that the pressure gradient must be divided by density to get the pressure gradient acceleration. In contrast, in x,y,p coordinates (pressure is p), there is no explicit density-dependence, so that the proportion of geostrophic wind speed to gradient of geopotential is constant for all p values (and there is no solenoidal term). The vector difference between the wind and the geostrophic wind is the ageostrophic wind. The ageostrophic wind can be large compared to the total wind at low latitudes and in smaller-scale features (thunderstorms). Generally, though, the geostrophic wind is close to the total wind for larger-scale motions at middle and high latitudes at sufficient height above the surface - with relatively bigger ageostrophic winds in frontal zones and around intense cyclones (due at least in part to centrifugal acceleration). Because the geostrophic wind is balanced with the pressure gradient, wind that is geostrophic won't accelerate (except for friction/mixing). Following the air as it moves (or even if it happens to stand still for a moment) the pressure gradient can/will change, causing an imbalance - an ageostrophic component, which allows and causes acceleration. Thus even if small, the ageostrophic wind is important. Generally, the ageostrophic wind (on large scales) makes up a 'secondary circulation' (which can involve horizontal divergence and vertical motion) which adjusts both the motion and the mass distribution (horizontal convergence, and vertical motion in pressure coordinates (or any change in pressure following the motion for any coordinate system) causes adiabatic temperature changes, and together this affects the mass distribution), tending to keep the wind and the pressure variation close to geostrophic balance, or else a gradient wind balance, where the centrifugal acceleration and coriolis acceleration due to the wind together balance the the pressure gradient acceleration (the centrifugal acceleration depends on the speed and the curvature of trajectories; trajectories can curve in the opposite direction of streamlines but a trajectory which 'stays with' a relative maximum or minimum in pressure will tend to curve the same way as streamlines (refer to last paragrarph of comment 302). This all assumes hydrostatic balance (gravity balances the vertical pressure gradient force), which is a very good approximation for at least the larger-scale motions. I'm not even sure that the atmosphere would deviate significantly from hydrostatic balance in high-frequency gravity waves (unless they have large amplitudes ?). But such deviation does play a role in the stronger thunderstorms. Hydrostatic imbalances account for vertical acceleration (which are very small for larger-scale motions). When the ageostrophic wind can have any value, there isn't a clear correspondence between vorticity and the mass distribution. But there is a relationship between geostrophic vorticity and the mass distribution (at least with the hydrostatic approximation). That relationship (for the following consider just a geostrophic wind and the geostrophic RV that comes with it): barotropic PV: relative vorticity (RV for this discussion) is cyclonic about low pressure, anticyclonic about high pressure (for pressure at a given z or geopotential). When the surface is flat (constant geopotential), the relative vorticity is correlated with the surface pressure in so far as local minimums or maximums are concerned, so that barotropic PV (proportional to AV/surface pressure) has a postive correlation to AV and anomalies of such PV have such correlations to RV. The relationship may be less clear-cut at some distance from any pressure maximum or minimum - although if one decomposes the pressure field into a basic state and some anomalies, one might again find some more clear relationship with the component of RV associated with the anomalies (provided the curvature **(the laplacian, which as an operator is the dot product of the gradient operatore with itself, equal to the sum of second derivatives in x,y,z, although in this context, just x and y)**, of the anomaly pressure field is positive where the pressure field anomaly is negative. This has to be true on the largest scale for continuity, but smaller wiggles or regions of constant gradients can go against this). When the surface has topography - variations in z, then the surface pressure is not entirely correlated to horizontal pressure variations; however the constancy of topography (on the relevant time scales) allows this topographic effect on barotropic PV to be considered analogous to the effect of planetary vorticity; a high plateau is analogous to higher latitudes. (A constant basic state surface pressure variation even in flat terrain could also be considered analogous to planetary vorticity variation - for example, the pressure variation due to the equilibrium paraboloid shape of the surface of water in a spinning dish.) Baroclinic fluid: isentropic PV (IPV) - The correlation between IPV variation and AV or RV variation is even less clear in general (to me, anyway - which is partly why I've been a little slow to pick up 'IPV thinking'). Barotropic PV is invariant in the vertical. IPV is not (generally). IPV is proportional to AV * [- d(potential temperature)/dp] - the negative of the vertical gradient of potential temperature in x,y,p coordinates (in stable air, d(potential temperature)/dp is itself negative, so using the negative of this allows a positive AV in stable air to have a postive PV). What would make for a clear-cut relationship is for a relative maximum in AV to correspond to a relative maximum in stability. Well, consider a relative maximum in cyclonic RV over vertical distance (which will correspond to a cyclonic AV anomaly since planetary vorticity doesn't have 'anomalies'). This means that below, cyclonic RV increases with height, and above, it decreases. If RV is geostrophic or nearly so, then that has implications for pressure variations. The greatest curvature (laplacian, d2/dx2 + d2/dy2) of the pressure field (along a horizontal plane) (or the greatest curvature of the geopotential field on an isobaric surface) must occur at the level of greatest cyclonic RV, decreasing away going down and up. The hydrostatic balance requires that the curvature of the temperature field (along either a z or a p surface, depending on chosen coordinate system) be positive below and negative above - that the thermal gradient (which points to warmer air) is divergent below and convergent above; if this is centered on relative maxima and minima, there would be (in the horizontal) relatively colder air surrounded by relatively warmer air below the cyclonic RV maximum, and warmer air surrounded by relatively colder air above the RV maximum. This implies that, if horizontally centered on temperature maxima/minima, the RV maximum is centered in the horizontal and in the vertical on a maximum in static stability. There will thus be, except for the planetary vorticity gradient, a relative maximum of IPV centered both in the vertical and horizontal on the RV maximum (provided planetary vorticity is cyclonic - which is always true). And if this is not actually centered on temperature maxima/minima? Well, the curvature (on either a z or p surface) of the stability must still be a maximum at the vertical level of the RV maximum and the RV maximum must be centered in the horizontal on the curvature of the stability (the convergence of the gradient of stability in x,y). The IPV maximum could be skewed to the side of RV if there is some component of the stability distribution that has a non-divergent gradient - the IPV maximum would be in between the highest RV value and the higher stability values. Also, it should be kept in mind that a relative cyclonic RV maximum doesn't necessarly occur with actual cyclonic RV - for example, if there is a strong enough anticyclonic RV above and below, the relative maximum in cyclonic RV could be a relative minimum in anticyclonic RV. It could still be a relative maximum in cyclonic IPV, though. As with barotropic PV, the correlation of IPV variations to RV variations could be made more clear by subtracting a basic state and then considering remaining anomalies (which themselves might be broken into components). PS as with barotropic RV in two dimensions, there is invertability with IPV; given sufficient boundary conditions (and a specification of the wind being geostrophic or in gradient wind balance), the wind field (or the specified component of it) and thus also the pressure field, can be determined, and the later also determines (again, with sufficient boundary conditions) the (potential) temperature field. (PS in the atmosphere, varyations in composition have relatively minor effects - when the specific humidity is quite high, then to be more accurate, a 'virtual temperature' can be found - this is the temperature that dry air would have to have to have the same density. In the ocean, salinity is of great importance, and so rather than considering potential temperature, one may consider potential density - the density the water would have if brought adiabatically (and without mixing or phase changes, though 'adiabatically' generally includes these constraints) to some reference pressure (such as at the surface).) There is also the consideration that IPV is evaluated based on the RV evaluated from the winds on an isentropic surface. Isentropic surfaces can slope considerably more than pressure surfaces, so some of the isentropic RV in (x,y,theta) coordinates (the greek letter theta is used to denote potential temperature) can come from vertical wind shear in either (x,y,p) or (x,y,z) coordinates. Also, purely non-divergent horizontal winds which vary with height, with no vertical motion in (x,y,p or z) coordinates, can, if a component of the wind shear is parallel to the horizontal temperature gradient (notice such a component must be ageostrophic), result in horizontal divergence or convergence and the accompanying vertical stretching in (x,y,theta) coordinates - note that adiabatic motion automatically has zero vertical 'motion' in (x,y,theta) because theta is constant following the motion; the vertical stretching is the increased seperation of isentropic surfaces in the z or p dimension. This happens because, even while the horizontal temperature gradient and thus x,y spacing of isentropes is invariant in this scenario, the isentropic surfaces are being tilted - if warm air advection decreases with height or cold air advection increases with height, then the isentropic surfaces are being taken from the horizontal and tilted toward the vertical. In the process, the projection of such a surface onto a vertical plane perpendicular to the thermal gradient is not changing in area if each such surface extends from top to bottom of whatever domain is considered (and the horizontal spacing of isentropes does not change), and so the horizontal component of isentropic RV does not change (however, if there is horizontal variation in the wind, the same may not be true of the actual vertical wind shear - since in this scenario the horizontal thermal gradient remains constant, the geostrophic wind shear remains constant, thus horizontal advection of the wind can produce an additional ageostrophic wind), but the horizontal projection of each isentropic surface (spanning a given vertical distance) is decreasing toward zero, and so (the vertical component of) isentropic RV increases toward infinity which conserving (the vertical component of) IPV as the vertical spacing (p or z) of isentropes increases to infinity (the stability goes toward zero); the volume between any two isentropic surfaces within a given vertical distance (p or z) is conserved (PS this is all assuming adiabatic and inviscid processes)...*****(may continue on that topic later) (PS note that the isentropes are not sloped in (x,y,p) where there is a relative temperature maximum or minimum in the horizontal). So the relationship between PV and RV can be complicated, but in general, a PV anomaly can be associated (co-located) with an RV anomaly of the same sign or vice versa. An IPV anomaly at a given vertical level will be accompanied by an RV anomaly field that extends both higher and lower than the IPV anomaly (the extent is reduced when static stability overall is higher** and also when the horizontal scale of the IPV anomaly (it's wavelength, for example) is smaller), and again the wind field generally extends farther horizontally than the RV anomaly itself. Thus if an IPV anomaly is confined either horizontally or vertically, it can, via the Rossby-wave propagation mechanism, propagate or initiate disturbances that propagate not only horizontally but vertically.
    0 0
  11. A few details: Rossby radius of deformation (written as if in a spreadsheet formula, sqrt(x) = the square root of x) external: sqrt(g*H) / f where g is the gravitational acceleration, H is the depth of a fluid layer, f is the planetary vorticity and also the coriolis parameter. internal 1.: sqrt(g'*H)/f where g' is g multiplied by the ratio of a density discontinuity to the density (the density of the lower layer). internal 2.: N*H/f N is the buoyancy frequency, H is the vertical extent of the fluid (or of a given phenomena within the fluid**?). The second internal radius of deformation is applicable to a continous stratification, typical of the atmosphere. The Rossby radius of deformation is the horizontal length scale for which the effects of rotation (coriolis effect) and stratification (stability) are similar. The radius of deformation could also be defined as N*H/(f+RV) = N*H/(AV). This has consequences for rotating disturbances such as a hurricane, where the rotation could be thought of as causing some additional coriolis effect with respect to features caught within the rotation. ---- For sloping isentropic surfaces: the geostrophic vertical wind shear projects onto isentropic surfaces as a component of the horizontal wind shear, and thus is part of the isentropic RV. It happens that this component of geostrophic isentropic RV is anticyclonic. If the isentropic surfaces are sloped steeply enough and the horizontal thermal gradient is great enough, it's possible that this anticyclonic contribution could dominate the isobaric RV and the planetary vorticity components of isentropic AV, such that isentropic AV is anticyclonic. In the absence of a horizontal pressure gradient and some nonzero RV, an ageostrophic wind will oscillate with the frequency of an intertial oscillation (= f/(2pi)). **But ageostrophic motions can change the mass and thus pressure distributions. So one can have inertio-gravity waves oscillating at some frequency (following that air) (which can be lower than the inertial oscialltion frequency) which propagate away from an initial disturbance. This relates to geostrophic adjustment - if there is an initial ageostrophic perturbation, there is a process of geostrophic adjustment which radiates mechanical waves. There will generally not be much of a remaining perturbation if the disturbance's horizontal extent was much less than the Rossby radius of deformation; on the other hand, some fraction of the intial perturbation's energy will remain in place as some feature in geostrophic balance for larger scale perturbations. Having a smaller effective radius of deformation in a tropical cyclone due to the cyclone's own rotation can enhance the trapping of pertubation energy. But back to inertial oscillations - what happens if there is some wind field so that a parcel perturbation's oscillating frequency is different. It turns out that the frequency of such an oscillation can be thought of as being in some way proportional to an inertial stability. I think that the frequency is AV/(2pi).** When the AV is anticylonic, there is inertial instability; this is an instability in horizontal motion. Inertial instability is analogous to vertical dry static instability - both are parcel instabilities whose essence can be understood by considering perturbing single air parcels (as opposed to hydrodynamic instabilities that require consideration of some larger-scale macroscopic organization) and both essentially don't occur, at least in larger scale conditions (and away from the surface for static instability) (or away from the lowest latitudes for inertial instability ??). What is more likely to occur or at least be approached, however, is a hybrid of the two instabilities, called symmetric instability. Symmetric instability occurs when the isentropic AV is anticyclonic (or when there is an unstable 'lapse rate' measured along surfaces of constant 'absolute momentum'), so that there is instability to slantwise motions; the stronger restoring force by far is typically that associated with static stability and N, so the overturning that can occur tends to be along isentropic surfaces. Or perhaps more likely, one may find conditional symmetric instability - analogous to conditional instability in the vertical - in which moist convection allows parcel trajectories to be sloped a bit more steeply than the isentropic surfaces. This kind of instability gives rise to some of the banding in precipitation associated with fronts. ---- Back to Rossby waves, the rest will be brief.
    0 0
  12. Clarifications: ..."there is a process of geostrophic adjustment which radiates mechanical waves" - I think this generally involves radiating waves with frequencies greater than f/(2pi) - and would not involve Rossby waves (?), which are not fundamentally ageostrophic but rather 'quasi-geostrophic'. Of course Rossby waves may be produced but they do different things. "When the AV is anticylonic, there is inertial instability; this is an instability in horizontal motion." - with static stability, there is the buoyancy frequency N. When the square of N is negative (there's a mathematical formula with the square of N), N is imaginary; an imaginary frequency corresponds to instability, whereas neutral stability corresponds to N = 0. A real nonzero N occurs when the air is stable, meaning potential temperature increases with height; an adiabatic vertical displacement involves pulling or pushing up or down on an isentropic surface, creating a thermal anomaly whose buoyancy tends to push the isentropic surface bump or dent back. - with inertial stability, a horizontal displacment of air may put it in a location surrounded by air with different velocity. This is true when the velocity varies horizontally, so that there might be vorticity. Because the air parcel has a different velocity, while it is in the same pressure field as the air immediately next to it (for a small parcel), it has a different acceleration due to the coriolis effect, so it tends to move differently than it's surroundings. The effect is to push it back to where it was taken from, and so it can oscillate with a frequency; but when that frequency is imaginary, there is instability - the acceleration due to the coriolis effect acting on the different velocity actually pulls it farther away from it's initial position in that case. ---- Streamfunction: Streamlines, which are everywhere parallel to the non-divergent component of the wind, are actually contours of the streamfunction. Each component of the wind can have it's own streamfunction and they can be linearly added to give a total streamfunction for the total non-divergent wind (streamfunctions can't be defined for divergent winds). The streamfunction for the geostrophic wind is defined, in isobaric coordinates (x,y,p) as the geopotential (or the geopotential minus some average spatially-invariant geopotential) on an isobaric surface divided by f. Actually, though, because f varies with latitude, the geostrophic wind has a divergent component if there is any north-south velocity component, so the streamfunction as just defined is only approximate and I'm not sure if the streamlines would be everywhere parallel to the geostrophic wind in that case; one way around that is to pick some basic state f, f0, which is the value of f at some latitude where y is arbitrarily equal to zero, and use that to define the streamfunction; the actual f is then equal to f0 + y*beta (if beta is constant, which is also an approximation valid for some finite range of latitudes centered on y=0 - this approximation is referred to as a 'beta plane'). The effect of the variation in f is then incorporated into the equations as y*beta, etc. The streamfunction on an isentropic surface is the Montgomery streamfunction, which is equal to cp*T + geopotential (or that minus any constant) - where cp is the heat capacity per unit mass, and T is the temperature. Along an isentropic surface (both in space and time), T only varies as a function of p (pressure) (adiabatic temperature changes). Thus where an isentropic surface is parallel to an isobaric surface (the same condition where there is no vertical geostrophic wind shear), the Montgomery streamfunction is just proportional to the isobaric streamfunction. The cp*T term accounts for the variation of geostrophic wind with height in isobaric coordinates. At any given intersection of an isobaric surface and an isentropic surface (which is an isotherm on the isobaric surface or an isobar on the isentropic surface), the wind is the same; the difference in geostrophic velocity between two isobars on an isentropic surface is due to the sum of 1.the change in geostrophic velocity along an isobaric surface some horizontal distance, and 2.the change in geostrophic velocity that occurs going vertically from that isobaric surface back to the isentropic surface. The later is perpendicular to the slope of the isentropic surface in (x,y,p) coordinates...[**?? Notice that the geostrophic wind, if not for non-zero beta, would be non-divergent on an isentropic surface as well as on an isobaric surface (I think **).] The curvature of the streamfunction, or specifically, the Laplacian of the streamfunction, is proportional to the relative vorticity. The Laplacian is equal to the divergence of the gradient.
    0 0
  13. Another view - back to (x,y,p) coordinates: What happens when there is either horizontal variation in temperature advection, or in diabatic heating? Answered earlier (way way back in "Science and Society", I think): relative warming or cooling changes the vertical geostrophic wind shear, and the resulting ageostrophic wind leads to divergence and vertical circulation where the warmed region rises (and adiabatically cools), the cooled region sinks (and adiabatically warms). Now what happens when there is vorticity advection that varies with height? Suppose there is a gradient in AV in the horizontal, and the wind blows partly along the gradient. Suppose this varies with height, so that relative to the rest of the air in a column, there is some vertical level in which air with lower AV is being replaced with wind with higher AV. Setting aside variations in planetary vorticity for the moment, this would mean increasing RV at that level. If the old RV value was balanced with the mass distribution above and below, the new RV won't be - if it is more cyclonic, the resulting cyclonic ageostrophic wind is accelerated by the coriolis effect to the right, which means outward from the center (horizontally); there is divergence. This removes mass from the column, lowering the pressure at all levels. If the initial change in RV had been imposed equally at all levels, the divergence would, conserving angular momentum, reduce the RV while increasing the geostrophic RV until they match (and then there might be some osciallation about equilibrium if the perturbation were imposed relatively suddenly, radiating inertio-gravity waves ?). But when the initial RV change occurs at one level, the divergence at that level increases the geostrophic RV at all levels, and this causes convergence to occur at all the other levels. The mass-continuity requires then that there is vertical stretching both below the level of initial RV change (let's call that p1) and above it, while there is vertical compression occuring at p1. Thus the maximum upward motion is at the base of the layer at p1 and the maximum downward motion is just at the top of that layer. This has adiabatic temperature changes associated with it. If the air had neutral stability, the adiabatic temperature changes due to vertical motion wouldn't change the horizontal temperature gradients, but with some vertical static stability, the cooling and warming produce relative cold and warm areas just below and above p1, which are most intense closer to p1. This temperature field acts to change the pressure field away from p1, so that farther above and below, there is a greater change in pressure that is opposite to that due to the initial divergence at p1. Thus the effect of the divergence at p1 to induce convergence above and below p1 becomes concentrated closer to p1 in the vertical. This is how higher static stability reduces at least some aspects of the dynamic interaction across vertical distances. Anyway, the RV is reduced at p1 and increased below and above, with the greater changes closer to p1, until balance is approached between the wind and mass field. The result is a relative RV perturbation that is maximum at p1, decreasing below and above, with colder air just below p1 and warmer air just above p1, which suggests an enhanced stability at p1. Notice what this implies for the vertical IPV distribution. Such interaction occurs in growth of baroclinic waves by baroclinic instability. Note that the vertical extent of the wind field corresponds to a vertical extent of temperature advection by that wind, producing a temperature anomaly. --------- Bluestein has a simple explanation that suggests that an IPV wave train in an IPV gradient (a Rossby wave in IPV) which is confined either horizontally (to being along a basic state IPV contour) or vertically, will initiate Rossby waves like itself that propagate away from itself horizontally or vertically, from where it was confined; moreover, when these waves initially develope, they act to destroy the initial wave, so that the result is two groups of waves propagating away in either direction (with the group velocity). - see Bluestein, pp. 214-216. --- Baroclinic and barotropic instability (or at least one kind of it ?) can both be explained as counterpropaging Rossby waves in an IPV context. (see Bluestein pp.207-208, see also Martin). 1. Baroclinic instability: Imagine that higher in the air, IPV increases to the north, but below some level, the IPV increases to the south (in the basic state). In that case, Rossby waves phase speeds are in the opposite direction above and below; to the west above and to the east below. If the basic state temperature increases to the south, the basic state vertical wind shear is to the east (westerly) going up, which reduces the phase speed of each set of Rossby waves relative to the other. What else can happen is that the vertical penetration of the wind field associated with each set of Rossby waves allows the Rossby waves above to induce waves below and vice versa. Because of the reversal of basic state IPV gradient, the result can under some conditions lead to two sets of waves that amplify each other and in that also tend to keep each other from moving relative to each other. The basic state IPV gradient is generally to the north down to the surface (although I wonder if regional east-west components might reverse with height?); however, the temperature gradient implies that isentropic surfaces slope downward toward the equator, which means that for any two isentropic surfaces, there is a point to the south (in the Northern Hemisphere) beyond which there is no more air in between them; they are at the same pressure, and the static stability is positive and infinite. Convergence toward a surface high temperature region 'inflates' the space between a pair of isentropes, and at the point at which the air arrives, it has some vorticity; convergence will increase that vorticity while conserving angular momentum, with vertical stretching (the 'inflation' of the space between isentropes). In this sense (I think), a surface warm temperature anomaly, which is associated with either cyclonic RV decreasing with height or anticyclonic RV increasing with height, is 'induced' by a cyclonic IPV anomaly at the surface, and the basic state increasing temperature to the south (in the Northern Hemisphere) implies a basic state IPV gradient at the surface with increasing cyclonic IPV toward lower latitudes. Notice that, relative to the wind at some height, the wind around a warm region at the surface, with the basic state temperature gradient just mentioned, will tend to pull warm air from low latitudes east of itself while pulling cold air from high latitudes west of itself, and thus the temperature wave propagates to the east (at least as far as phase speed is concerned). One complexity: this is relative to the vorticity at some height above the surface (although perhaps even if the wind rotated anticyclonically above a warm surface anomaly, it wouldn't propagate as fast to the west as it would if the the thermal gradient were reversed?). What if there is a reversal in the horizontal IPV gradient in some horizontal direction? The result can be qualitatively similary; one could have sets of counterpropaging Rossby waves which are able to amplify each other: Barotropic instability. Notice a Rossby wave can't continue to propagate into a region without an IPV gradient (there may be some evanescent wave would could allow tunneling of a portion of the energy through such a region if finite in size). The group velocity might reflect? If there is a critical level where the wind is moving with the phase speed of a Rossby wave embedded somewhere else but whose wind field reaches the critical level, energy can be exchanged between the wave and the basic state at the critical level (you can imagine that there would be ongoing motion at the critical level that is not propagating relative to the air there. I'm not sure exactly how this works, though). Sharp changes in propagation at the tropopause (change in static stability, IPV and IPV gradient) and surface - reflection? refraction? etc. (I'm still learning.) And so on. (I'm just about done with this here.)
    0 0
  14. I think one necessary condition for both barotropic and baroclinic instability is that the waves/eddies have to be moving such that there is at least one level (in the horizontal or in the vertical, respectively) - a critical level - at which the basic state wind is moving with the instability phase speed. --- waves can grow, propagate, be emitted by a disturbance, reflect, refract, absorb, over-reflect (I think that's analogous to stimulated emission of radiation), and also, they can break. I think breaking occurs when material lines reconnect (which requires mixing) *?*. Notice that for adiabatic motion, contours of IPV on an isentropic surface are material lines on that surface. They are also isentropes on an IPV surface, and those are also material lines on an IPV surface. Reconnection of these contours can result in cut-off eddies (like a cut-off low); this can occur from diabatic processes which can produce and destroy IPV. Waves can also interact and produce waves in other parts of the spectrum or produce disturbance that radiate other waves, etc... ---- On wave-mean interaction: Earlier I discussed interaction between barotropic Rossby waves and variations in the basic state wind, such as westerly jets and relative minimums in the westerlies (or, alternatively, easterly jets). It wasn't clear to me what actually happens, but here's another way of looking at it: The anomaly wind field has u' and v'. If the anomaly consists of a wave train of symmetric cyclones and anticyclones, which are superimposed on some basic state, then the average u'v' is zero. But suppose the basic state is a westerly jet. The total state may then be a meandering westerly jet (with troughs and ridges). But, if the advection is stronger than differential Rossby wave propagation (?), the basic state will distort the anomalies; it tends to tilt the waves- the troughs and ridges tilt from SW to NE to the south of the jet and from the NW to the SE to the north. This tilt cause a nonzero average u'v', which is positive to the south and negative to the north, which means that eddy zonal momentum is being transported by eddy meridional momentum and the transport converges toward the jet, so that zonal momentum is being added to the jet. Whether this means the jet accelerates or the jet widens (or if the jet narrows?), I'm not clear. Notice that (if the jet is accelerating - I think it does, actually) this also increases cyclonic RV to the north and anticyclonic RV to the south of the jet; there is a relationship between eddy momentum convergence and eddy vorticity flux; there is also a relationship between EP flux convergence and eddy IPV flux (EP flux is a vector with vertical component determined by eddy temperature flux v'T' and meridional component determined by eddy momentum flux u'v'; increasing v'T' with height increases stability to the north; decreasing u'v' to the north is proportional to a northward flux of eddy cyclonic RV: v'RV'). There are mechanisms by which jets may sharpen themselves. (see links from http://www.atm.damtp.cam.ac.uk/people/mem/ ) Also, mixing of IPV or PV in general can/may lead to a 'PV staircase' because mixing between two contours of PV and mixing between two other contours of PV, in reducing the PV gradient in two regions, must then increase the gradient in between such regions. This has consequences for jets. A paper on this - "Multiple jets as PV staircases: the Phillips effect and the resilience of eddy-transport barriers" - is also linked from the above website. It is analogous (according to that paper) to mixing of potential density or temperature in a vertically stratified fluid - mixing can give rise to regions with even sharper density contrasts (I think it's called the Phillips effect). Perhaps not quite the same thing (because it's not multiple layers) but the mixing of the upper ocean, by cooling the surface and warming the bottom of the mixed layer, produces a thermocline - a sharper temperature gradient - at the base of the layer. The strong stratification in the thermocline makes it harder to mix additional water from below into the upper layer (it is also harder to vertically mix the air across an inversion, such as when the air near the surface cools at night - the vertical wind shear can cause mixing by way of a shear instability (Kelvin Helmholtz instability, I think) (which I think is analogous the barotropic instability in horizontal shear), but the stronger the stratification, the stronger the wind shear has to be before such mixing can commence (see also "Richardson number"); I only started reading that PV-staircase paper but I think it was a point of the PV-staircase concept that the sharpened PV gradients become an impediment to further horizontal mixing). In the lower atmosphere, mixing of the boundary layer (layer nearest the surface, unless one differentiates between that and a much thinner 'surface layer') can be driven both by kinetic energy input from wind shear-related instability, and by thermally-driven convection when heated from below (daytime over land, cold front passing over warm water); the thermally-driven convection also produces kinetic energy and the kinetic energy can be used to mix further upward into stable air above, which can produce a thicker boundary layer capped by a strongly stable layer such as an inversion, which resists further mixing. AND NOW FOR AN APPLICATION OF WAVE-MEAN INTERACTION: "Wave-maintained annular modes of climate variability" "HARTMANN Dennis L." "Abstract The leading modes of month-to-month variability in the Northern and Southern Hemispheres are examined by comparing a 100-yr run of the Geophysical Fluid Dynamics Laboratory GCM with the NCEP-NCAR reanalyses of observations. The model simulation is a control experiment in which the SSTs are fixed to the climatological annual cycle without any interannual variability. The leading modes contain a strong zonally symmetric or annular component that describes an expansion and contraction of the polar vortex as the midlatitude jet shifts equatorward and poleward. This fluctuation is strongest during the winter months. The structure and amplitude of the simulated modes are very similar to those derived from observations, indicating that these modes arise from the internal dynamics of the atmosphere. Dynamical diagnosis of both observations and model simulation indicates that variations in the zonally symmetric flow associated with the annular modes are forced by eddy fluxes in the free troposphere, while the Coriolis acceleration associated with the mean meridional circulation maintains the surface wind anomalies against friction High-frequency transients contribute most to the total eddy forcing in the Southern Hemisphere. In the Northern Hemisphere, stationary waves provide most of the eddy momentum fluxes, although highfrequency transients also make an important contribution. The behavior of the stationary waves can he partly explained with index of refraction arguments. When the tropospheric westerlies are displaced poleward, Rossby waves are refracted equatorward, inducing poleward momentum fluxes and reinforcing the high-latitude westerlies. Planetary Rossby wave refraction can also explain why the stratospheric polar vortex is stronger when the tropospheric westerlies are displaced poleward. When planetary wave activity is refracted equatorward, it is less likely to propagate into the stratosphere and disturb the polar vortex. " http://cat.inist.fr/?aModele=afficheN&cpsidt=962252 This is far from the only paper on the subject. I couldn't begin to get into all of it.
    0 0
  15. I did several internet searches a week or two ago on the subject of annular modes, waves, and troposphere-stratosphere interaction. Here's what I remember at the moment: The stratosphere can have an effect on the troposphere (besides thermal/radiative). Conditions in the stratosphere affect how or if various waves in the troposphere can propagate. But conditions in the troposphere affect those waves - their production, etc. Annular modes may/might occur due to tropospheric mechanisms even without stratospheric feedbacks. But the stratosphere can play a role. A component of climate change 'projects onto' the annular modes - An aspect of the climate change with global warming is similar to a change in the AO or NAM index (NAM = Northern Annular Mode, I think; and I think it's the same as the Arctic Oscillation, AO). Cliamte change may affec the relationship of NAO to NAM. Ozone depletion affects SAM? From my own simple logic, I would guess the direct thermal response of the stratosphere to solar forcing would be (besides a generally warmer stratosphere and above) a warmer summer and low-latitude upper stratosphere relative to the winter polar stratosphere; whereas increasing CO2, etc, should (aside from generalized cooling) tend to cool those parts that are warmer relative to other parts - thus, the lower stratosphere of midlatitude winter would cool relative to the low-latitude and high-latitude parts of the same. The cold winter polar stratosphere would be relatively warmer in comparison. HOWEVER, from IPCC graphs (Ch 9 in AR4 WGI, as I recall), the modelled distribution of the temperature response (aside from the marked difference in the overall trend) is more similar between solar and GHG forcing. Must be the dynamic feedbacks...but how do they work? If the stratosphere can affect the troposphere, then perhaps the mesosphere can affect the stratosphere, and so on (well, of course they do, it's just a question of in what way and the significance of it). Changes in solar forcing have a large effect on the thermosphere in particular. On the other hand, I've gotten the impression that observations so far indicate a multidecadal (?) thermospheric cooling, along with the stratosphere and mesosphere, suggesting GHG forcing has been dominating the trend even up there. So the solar UV and shorter wavelengths and other energies may have a 'special' role to play by way of troposphere-stratosphere-etc. interaction, but I don't see a reason to suspect it explains a sizable chunk of what would otherwise be attributed to GHGs, etc..., at least and especially the later part of the 20th century - but then again, there is a lot I haven't read and don't know. (and what about winds and currents in the ionosphere?) So if you find something... (but remember how much work supports the conclusion that GHG forcing has been dominant).
    0 0
  16. Wrapping up some details: To be precise, IPV is equal to the negative of the isentropic AV divided by dp/d(theta) * 1/g, where g is the acceleration due to gravity, theta = potential temperature. (Bluestein p.190) Let S = dp/d(theta), so S is inversely proportional to static stability. IPV = - AV * g/S. S/g is actually the mass per unit theta per unit area, and so this formulation of IPV is equal to AV per unit mass per unit area within an isentropically-defined layer. To make comparable to barotropic PV, we could let barotropic PV = AV * g/(surface pressure); this is AV per unit mass per unit area of the whole fluid layer; or for a nearly incompressible fluid like water, barotropic PV = AV/(H*density), where H is the depth of fluid.
    0 0
  17. According to Bluestein (p.193), the horizontal scale L of an IPV anomaly and the vertical scale H of the RV anomaly it induces, are related by the formula for the Rossby radius of deformation: L is proportional to NH/f (PS I'd suspect that a more general relationship would replace f, the planetary vorticity, with the basic state AV ?). or H is proportional to L*f/N N is the buoyancy frequency (basic state) and I believe it is proportional to the square root of stability (where stability = 1/S). I explained why static stability limits vertical penetration of induced RV (Bluestein p.193 - specifically H is proportional to the square root of S). How would the length scale work? Well, conceptually, for a given static stability, the horizontal temperature gradient increases with increasing slopes of isentropic surfaces. The thermal gradient must balance the vertical shear that limits the vertical extent of the RV. A given slope over longer horizontal distance implies a greater vertical displacement of an isentropic surface relative to basic state conditions. --- An IPV anomaly distorts the isentropes from their basic states; the greatest distortion being closest (in vertical and horizontal) to the IPV anomaly center. For a cyclonic IPV anomaly, isentropes are 'pulled' upward towards it from below and downward from above. Notice that if this anomaly is moving, say, eastward relative to the air above and below, adiabatic motion above and below, in response to the passing IPV anomaly, follows the isentropes; as the IPV anomaly approaches, what happens is (mostly?) as described in the second long paragraph of comment 313, which started "Now what happens when there is vorticity advection that varies with height?". There is convergence at levels above and below, vertical motion toward the level of the anomaly; the reverse happens as the IPV anomaly passes and moves away. What about if the IPV anomaly is moving differently with respect to the air above and below? If there is westerly (eastward) shear throughout, the air above approaches the IPV anomaly from the west. Thus what happens above the IPV anomaly is reversed east-to-west from what was described above. In that case, vertical motion is downward both above and below the IPV anomaly level to the west and upward both above and below to the east of the anomaly. Looking only in a planar cross section, it would appear that the air only approaches the level of the anomaly and then moves back; however, the air also moves around the anomaly cyclonically; if there is a basic state temperature gradient - warmer to the south - then the isentropes slope upward to the north, so for example, the air below the IPV anomaly to it's east, approaches the IPV anomaly and rises, and moves north; The northward motion may not slope up as much as the isentropes because it pushes the isentropes with it (horizontally-concentrated warm air advection - creating eddy potential energy from basic state potential energy), but it may slope in the same sense to some degree, allowing some air to rise above the IPV anomaly level while to it's east (after having moved into colder surroundings, so that it is rising in a thermally-direct fashion (out of a dent in the isentropic surface created by the horizontal motion): eddy potential energy converts to eddy kinetic energy); it then (with some geostrophic adjustment) accelerates to the east with the upper level air. And so on for the sinking motion west of the IPV anomaly. Throw in tilting anomalies with height, etc...: A growing baroclinic wave (extratropical cyclones). Now if there is a basic state IPV gradient, then the IPV anomaly may propagate against the wind, ... etc... Especially if the wavelength of the anomaly is large... (It would be interesting to consider how variations in N, H, wind shear, IPV gradients, AV, and wavelengths combine to determine whether a baroclinic wave can grow and how fast). Actually, much of the isentropic IPV gradient (besides that 'at the surface' ?) is concentrated near the tropopause and stratosphere; for isentropic surfaces that cross the tropopause, the stratospheric portion can be judged as the region with larger IPV. My impression is that some of baroclinic instability can be understood in terms of undulations in the tropopause corresponding to tropopause level IPV anomalies, and surface temperature variations corresponding to IPV anomalies 'at the surface'. But there is some basic-state IPV gradient (increasing toward the poles generally) within the troposphere).
    0 0
  18. Potential point of confusion: When I described the effect of vertical variations in vorticity advection, I mentioned that an 'injection' of cyclonic vorticity concentrated at some level would lead to divergence at that level (and then leading to convergence at other levels, etc.). Convergence would occur if vorticity is removed from some level (causing divergence at other levels, etc.). Thus, a vorticity maximum that is being transported relative to air at other levels (rather than along with the whole column, in which case everything stays balanceds and there is no convergence or divergence except for changes in planetary vorticity or topography, etc.), while inducing features above and below that would follow it, should also be slowed down relative to the basic state wind that carries it along, by the process of inducing those motions above and below. But how can that happen with an IPV anomaly, since IPV is conserved following the motion in adiabatic processes? Is it necessary to include the Rossby-wave propagation to resolve this? ---- PS from Cushman-Roisin, p.87: The group velocity of barotropic Rossby waves (just due to the beta effect, gradient of AV is to the north): For longer wavelengths, the group velocity is to the west; for shorter wavelengths, to the east; the divide between the two occurs at the maximum frequency for a given meridional wavenumber; at which point the group velocity is due north or south; for waves with phase propagation to the the northwest or southwest, the meridional component of the group velocity is to the south or north, respectively (in the opposite direction of phase propagation). My earlier 'work' (comment 296) on Rossby wave frequency suggested that the frequency can be arbitrarily large; but this is not actually true; there is an upper limit. I'm not 100% sure but it seems as if the Cushman-Roisin derivation, pp.83-87, includes the effects of divergence; this may be what places an upper limit on frequency, then. The limit of westward phase speed at arbitrarily large wavelengths is equal to the product of beta and the square of the external Rossy radius of deformation; the highest frequency allowed is the product of beta and the external Rossby radius of deformation divided by 4*pi. (In these derivations it was assumed there was no RV contribution to the vorticity gradient.) Interestingly, the lowest frequency allowed for inertio-gravity waves is f/(2pi), the frequency of inertial oscillation (when RV = 0); and that limit is achieved at infinite wavelength (Cushman-Roisin, p.83). According to Cushman-Roisin, it was assumed in the derivation of Rossby wave formulas that the expression for frequency would be less than the minimum frequency of inertio-gravity waves. The highest frequency Rossby waves actually are not quite the longest wavelengths in this formulation; they occur with meridional wavenumber = 0, so that the phase lines are oriented north-south, the wave phase propagation is due west, the zonal wavenumber is 1/(external Rossby radius of deformation), so the wavelength is equal to 2pi*(external Rossby radius of deformation). ---- EP flux and eddy IPV flux: Specifically (Holton pp.323,327): The EP flux is a vector in a vertical meridional plane (at least in this application), where the northward component is proportional to -u'v' (the southward eddy zonal momentum flux) and the upward component is proportional to v'T' (the northward eddy temperature flux). Thus v'T' decreasing with height and u'v' increasing northward (implying eddy zonal momentum flux DIVERGENCE which would tend to slow the average westerly winds) would tend to lead to EP flux CONVERGENCE (I say 'tend to' because those quantities have to be multiplied by some coefficients to actually get the EP flux, and some of those can vary). The EP flux convergence corresponds and is proportional to a southward eddy flux of IPV (Holton p.327) which makes sense since increasing RV to the south and decreasing RV to the north implies an average slowing of westerly winds and a divergence of zonal momentum flux, and decreasing v'T' with height implies an average decrease in static stability to the north and the opposite to the south. The actual tendency of the eddy fluxs and EP flux in mid-to-high latitudes (Holton p. 324, pp.319-325) is: 1. generally for poleward temperature flux v'T' between the subtropics and polar latitudes, which increases with height from the surface to some low level in the troposphere, but after that a general decrease with height within the troposphere, a minimum near the tropopause (at least in winter, or more clear in winter** in Fig 10.3), and increasing again somewhat into the stratosphere in winter (**Fig 10.3 - I'm assuming some similarity between southern winter and northern winter, and for the two summers, but of course there will be differences too). 2. generally poleward zonal momentum flux over the subtropics and some equatorward zonal momentum flux over subpolar latitudes, so that there is a zonal momentum convergence between subtropics and subpolar latitudes, and this is generally a maximum near the tropopause (where there is a maximum in jet stream velocity). Thus in the midlatitudes there tends to be eddy momentum flux u'v' convergence increasing with height within the troposphere (and decreasing above that at least to some point), and poleward eddy heat flux that generally decreases upward within the troposphere except near the surface (the lower near surface values are probably due to frictional slowing of the winds, I think). The contributions to EP flux divergence: the momentum fluxes would lead to EP flux divergence especially near the tropopause; generally the effect of thermal fluxes dominates, however, so in most of the troposphere the EP flux is convergent, except for some significant divergence next to the surface (also due to thermal fluxes). It approaches zero divergence around the tropopause level. The effect of that is to slow the average zonal momemtum, except just above the surface where it could accelerate the average zonal momentum. The coriolis effect would act on this perturbation to acceleration the motion poleward in the mid troposphere and equatorward just near the surface. The overturning that this describes is a diabatic circulation (rising air is being heated by latent heating and/or radiation, sinking air is being cooled by radiation) and is in a way an extension of the Hadley cell. But wait! Where did the midlatitude Ferrel cell go? Actually, the EP flux 'includes' the adiabatic portion of the Ferrel cell, which dominates over the 'residual meridional circulation' (p.323) in the Eulerian zonal mean. The adiabatic portion is rising poleward and sinking over the subtropics. In the full Eulerian mean, the vertical distribution of zonal momentum convergence perturbs the average motion, the eddy heat and the coriolis effect acts on that to produce meridional circulation in the same direction as the ferrel cell, and the poleward eddy heat flux causes a similar overturning. (Having trouble with that? So did I!)
    0 0
  19. Actually, if the diabatic residual meridional circulation exists, the coriolis effect acts on that to accelerate zonal winds, opposing the effect of southward eddy IPV flux. The coriolis effect acts on the Ferrel cell motion to oppose the effect of momentum flux convergence and to reduce the vertical wind shear, which will also bring the wind toward geostrophic balance with the reduced thermal gradient due to eddy heat fluxes. ----- Another way to look at the horizontal and vertical scale relationships: As illustrated above (independently of the IPV concept), following the motion of the air at one level, increasing cyclonic vorticity advection with height (or decreasing anticyclonic vorticity advection with height) creates an imbalance that drives either divergence above or convergence below or both; and *1. one (convergence below or divergence above) will drive the other by changing the pressure at all levels in an atmospheric column (assuming hydrostatic balance is at least approximately maintained). This produces by mass continuity (while remaining close to hydrostratic balance) upward vertical motion (in x,y,p coordinates; upward vertical motion is negative Dp/Dt). *2. The upward vertical motion causes adiabatic cooling as isentropes are displaced vertically (diabatic heating such as by latent heating will reduce that). *3. This change in temperature changes the vertical pressure gradient. *3 only happens if the air is stable and is proportional to that stability; with constant potential temperature with height, the temperature at any given pressure level remains the same. *4. The horizontal pressure gradient changes associated with the adiabatic cooling, modulated by stability, intensifies the relative low pressure above and reduces it below, thus reducing the convergence below and increasing it above, as the divergence pattern acts to vertically contain the voriticity pattern, against the tendency for vorticity (and associated curvature of the horizontal pressure field) changes to spread vertically by *1. HOWEVER, in order for *2, via *3, to cause *4, there has to be a curvature in the induced temperature anomaly field - the Laplacian of the temperature must be nonzero - in other words, If the vertical variation in vorticity advection were constant over some horizontal region, and the stability is also constant as is the absolute vorticity at a given vertical level, then the adiabatic cooling is constant and thus has no horizontal temperature gradient associated with it, and no horizontal pressure variation and no geostrophic vertical wind shear. Aside from variations in AV and stability, it is the horizontal variation in the vertical variation of vorticity advection that allows the adiabatic warming or cooling to limit the vertical extent of induced vorticity. Hence, larger vertical extents are supported by larger horizontal scales. The vertical variation in vorticity advection is 'differential vorticity advection'. When does differential vorticity advection (DVA) happen? 1. vertical wind shear across a vertically-constant vorticity gradient, including the planetary vorticity gradient. 2. constant wind across a vertically-varying vorticity gradient. 3. some combination of wind shear and variation of vorticity gradient with height. But notice that if 2 is the case, this only moves an entire atmospheric column. Thus, there is no level to be found at which, following the motion of the air, there would actually appear to be vorticity advection above or below. 2 by itself does not cause any divergence or vertical motion. However, the vertical variation in the relative vorticity gradient would, assuming near geostrophy, be related to temperature variations. Horizontal variations in temperature advection will drive divergence and vertical motions. Specifically, cyclonic RV increasing with height implies a cold temperature anomaly that decreases away horizontally (positive Laplacian of temperature) If the wind does not vary horizontally, the temperature pattern is advected in whole and this by itself does not cause any imbalance. If there is varyation in the wind over horizontal distances, then the temperature advection pattern can produce changes in the horizontal temperature gradient following the motion. Specifically it is the convergence of the change in temperature gradient FOLLOWING the motion that drives upward motion. It turns out that because of the relationship between geostrophic vertical wind shear ('the thermal wind') and the horizontal temperature gradient, the effect of differential relative geostrophic vorticity advection by geostrophic winds, FOLLOWING the geostrophic motion, is the same as the effect of the changing temperature gradient, FOLLOWING the geostrophic motion, so that - (?)the combined effect on vertical motion and convergence and divergence is twice the effect of either by itself (?) - I think; - this relates to something called the Q vector.
    0 0
  20. Regarding that last bit: If motion is strictly horizontal, starts out geostrophic and does not accelerate in response to ageostrophy (a completly artificial condition for illustrative purposes), and there is no variation in planetary vorticity f, and diabatic and frictional effects are set aside, and the wind is non-divergent (actually that must be true given geostrophic with no variation in f), then the result is that the wind can drive itself out of geostrophic balance; it does this in two ways that are apparently equal in magnitude according to the math. 1. Horizontal variations in wind velocity can advect temperature in such a way so as to change the horizontal temperature gradient within a layer of air, following the motion. This changes the vertical geostrophic wind shear. 2. The vary same horizontal variation in wind is such that the initial geostrophic wind shear advects those horizontal variations differently over a vertical distance, so that the resulting vertical wind shear through the layer of air, following the motion, is equal and opposite to the change in the geostrophic wind shear from 1. Hence, the resulting ageostrophic vertical shear is twice that of either 1. or 2. by itself. Horizontal variation in 1. can change the Laplacian of the temperature field. Horizontal variation in 2. can correspond to differential vorticity advection.
    0 0
  21. continued from 320: If we are following the motion, subtract the velocity vector at the point we are following from the total wind field; the remaining component of the wind varies vertically and horizontally relative to a point we are following but is zero at that point. In x,y,p coordinates: For simplicity of illustration, let the frame of reference move with the point, so that the point of focus is 0,0,0. Let isotherms be aligned parallel to the x axis at 0,0,0; thus the temperature gradient is in the y direction, dT/dy. dT/dx = 0. ---- Let the vertical wind shear be equal to the geostrophic wind shear: Geostrophic zonal wind..... u = -(dF/dy)/f Geostrophic meridional wind v = (dF/dx)/f where F is the geopotential (z*g) of an isobaric surface. (The symbol for geopotential used is a capital greek letter, which is F in a symbol font). (z is the geometric height. In this context, g is given as a positive number and is approximated as constant with height; otherwise F = the integral of dz*g) ---- Vertical derivative of F: (a negative sign is used because p increases downward. -dF/dp = -d(z*g)/dp =~ g * dz/dp ...(the bulk of the mass of the atmosphere is in a thin enough layer that the vertical variation of g is a minor issue) = = g * dz/dm * dm/dp ...(where m is the mass per unit horizontal area) = dz/dm = 1/density = 'specific volume' = R*T/p, where R is the ideal gas constant expressed in terms of mass (which will then be different for different gases). and T is the temperature. ---- Vertical (geostrophic) wind shear: du/dp = -1/f * d(dF/dy)/dp = -1/f * d(dF/dp)/dy = -1/f * d(-R*T/p)/dy = 1/f * R/p * dT/dy ...(in isobaric coordinates, horizontal derivatives of p are zero. Any variations in R or an effective R, such as from very high humidity, can be treated by using 'virtual temperature'; In that case, though, adiabatic temperature changes may be a bit different, I think. This is relatively minor issue for Earthly conditions). Let A = R/(p * f) Thus the zonal vertical shear -du/dp = -A * dT/dy. Similarly, the meridional vertical shear -dv/dp = A * dT/dx The negative sign is used for clarity of visualization, because p decreases with increasing z. -du/dp has the same sign as du/dz. ---- Since dT/dx has been set to zero for initial conditions, -dv/dp = 0. ---- Horizontal wind variations: The change in the wind along isotherms, in the x direction: du/dx dv/dx The change in the wind along the temperature gradient, in the y direction: du/dy dv/dy --------------- In a given infinitisimal unit of time t, the changes are: -------- 1. Changes in thermal gradient and geostrophic shear: Notice that, at least initially (and that is the focus here), variations in u don't alter the temperature gradient because u blows along isotherms. The initial effect: dv/dy acts to change the spacing of isotherms; positive dv/dy decreases the thermal gradient dT/dy, etc. dv/dx acts to change the direction of the thermal gradient, by tilting isotherms in the horizontal, introducing a nonzero dT/dx value. These change the geostrophic vertical wind shear. --- 1a. From dv/dx: change in slope of isotherm dy/dx: dy/dx of isotherm = t*dv/dx resulting change in dT/dx: dT'/dx = initial dT/dy * -dy/dx of isotherm = dT/dy * -dv/dx * t change in geostrophic wind shear: -dv'/dp = A * dT'/dx = A * dT/dy * -dv/dx * t = -A * dT/dy * dv/dx * t --- 1b. From dv/dy: change in temperature gradient dT'/dy is inversely proportional to the change in isothermal spacing in the y direction. dT'/dy is equal to the gradient times the length dy' that the wind dv at y = dy pushes into the interval dy, per unit dy: dT'/dy = dT/dy * dy'/dy = dT/dy * -dv*t/dy dT'/dy = -dT/dy * dv/dy * t change in geostrophic wind shear: -du'/dp = -A * dT'/dy = A * dT/dy * dv/dy * t -------- 2. Changes in the vertical wind shear: The initial geostrophic shear advects the horizontal variations in the wind, differently over a vertical distance, producing some additional vertical wind shear. Notice that, initially, changes in the wind over y (du/dy and dv/dy) do not contribute to changing vertical shear because the geostrophic wind shear is parallel to isotherms; geostrophic -dv/dp is equal to zero. Using the initial geostrophic shear: -du/dp = -A * dT/dy --- 2a. From dv/dx: du/dp brings some wind dv' over to (0,0,dp) from dx' = -t*du thus dv' = -t*du * dv/dx and so the change in wind shear dv'/dp is: dv'/dp = du/dp * -dv/dx * t = -A * dT/dy * dv/dx * t -dv'/dp = A * dT/dy * dv/dx * t --- 2b. From du/dx: du/dp brings some wind du' over to (0,0,dp) from dx' = -t*du thus du' = -t*du * du/dx and so the change in wind shear du'/dp is: du'/dp = du/dp * -du/dx * t = A * dT/dy * -du/dx * t -du'/dp = A * dT/dy * du/dx * t ------------ SO: The changes in geostrophic wind shear by temperature advection: 1a. V'geo = -dv'/dp = -A * dT/dy * dv/dx * t 1b. U'geo = -du'/dp = A * dT/dy * dv/dy * t The changes in the wind shear by vertically-sheared momentum advection: 2a. V'adv = -dv'/dp = A * dT/dy * dv/dx * t 2b. U'adv = -du'/dp = A * dT/dy * du/dx * t ------------- Notice that -V'geo = V'adv, and both are due to dv/dx. The imbalance produced by V'geo is an ageostropic -dv'/dp that is the opposite of V'geo. V'adv is also an ageostrophic -dv'/dp. So both contribute equally to a total ageostrophic -dv'/dp, via the same dv/dx. Notice also that U'geo = U'adv. What does this mean? U'geo is from dv/dy, and U'adv is from du/dx. IF dv/dy = -du/dx, then the relationship between U'geo and U'adv is the same as that between V'geo and V'adv. dv/dy = -du/dx if the wind is non-divergent. THUS, Following the motion, the ageostrophic vertical shear produced by geostrophic vertical shear is twice that due to either the horizontal variation in temperature advection or to the vertically sheared momentum advection GIVEN strictly horizontal flow (x,y,p coordinates) and non-divergent winds; it isn't actually necessary for the total wind to be geostrophic, just the vertical wind shear. It is apparent from this conclusion that horizontal variations in the same mechanism are related; Following the motion, the vertical variation in vorticity advection produces ageostrophic vorticity at the same rate that horizontal variations in temperature advection (specifically, the rate of change of the Laplacian of the temperature following the motion) do. Additional effects can operate indepedently: ageostrophic vertical shear and divergence in the wind (including divergence in the geostrophic wind due to beta; PS the geostrophic wind is non-divergent when beta = 0 for (x,y,p) coordinates and maybe isentropic coordinates (I think**), but not (x,y,z) coordinates), and vertical transport of momentum; advection of planetary vorticity, friction, and diabatic heating/cooling (radiative and latent).
    0 0
  22. ...continued... Notice that even if the wind is divergent, the relationship for dv/dx remains intact - that is, the variation along an isotherm of the component of the wind parallel to the temperature gradient - this acts to turn the temperature gradient rather than to change it's magnitude. --- Poleward geostrophic wind is convergent; equatorward geostrophic wind is divergent. If the wind is tending towards geostrophy, this pattern of divergence will change the vorticity, interestingly in the opposite direction that the corresponding planetary vorticity advection changes the relative vorticity (without divergence and friction, etc, AV = f + RV is conserved so changes in f must drive opposite changes in RV). Differential planetary vorticity advection can act as differential RV advection, but is not tied to temperature advection as RV advection is by geostrophic shear as described above (320,321). If planetary vorticity advection occurs through an entire column, then RV is created (or destroyed) over the whole column. The response for equatorward flow is increasing ageostrophic cyclonic RV, which drives divergence, lowering the pressure and the cyclonic AV until the RV and pressure come into balance; specifically the Laplacian of the pressure field has to increase, which corresponds to a relative horizontal maximum in pressure drop somewhere. Vertical compression occurs with the air becoming more stable; the isentropes stay near constant pressure near the 'top' of the column, so the pressure drops at each isentrope below, the most near the surface; this corresponds to adiabatic cooling. Horizontal variation in this cooling decreases the divergence and pressure fall at the surface while increasing it above - this being modified again by stability, if I'm not mistaken. Advection of a column over topography is also interesting; in this case, suppose one is moving a column of air downslope. Without any convergence, the pressure is falling at all levels in the column. Horizontal variation in this downslope motion (due to either the wind or the topography or both) drives convergence toward the larger downslope motions, increasing the pressure and vertically stretching the column. Convergence increases cyclonic AV, thus increasing cyclonic RV if f is not changing. Isentropes and pressure surfaces may rise nearly together near the top of the column but the pressure rises on isentropes near the 'dropping' surface. Hence there is warming near the surface, which, to the degree that it is horizontally varied (modified by stability, again, I think**), reduces the relative pressure rise at the surface, increasing convergence and cyclonic AV and RV near the surface, and having opposite effects above. Variations in downslope flow can initiate cyclogenesis...
    0 0
  23. Actually, with regard to the horizontal scale of vorticity advection (and resulting vertical scale for differential vorticity advection): It's not just that the horizontal scale of temperature variation is affected. 'Before' that step, the pressure changes are also affected, in that the horizontal variation of vorticity advection directly causes horizontal variation in the divergence and thus in the pressure changes, so that there is a changing pressure gradient (or vertical variation of that for differential vorticity advection). A change in the pressure gradient is necessary if the adjustment to near geostrophy has both the geostrophic RV (or vertical variation of that) and actual RV approaching each other. Otherwise, without any horizontal variation in vorticity advection, the divergence could continue until the RV returns to the initial geostrophic RV. Sustained RV changes would be limited to the boundary of such a region. Of course accompanying temperature advection could have some other effect... On the other hand, sinusoidal horizontal variation would allow various changes to remain proportional to each other at each horizontal position.
    0 0
  24. I’m come back to the subject - matter, precise “Arctic ice melt…” “natural or man-made…” I think: “fifty/fifty”… In the meeting AGU (XII 2007) the Scientists in University Cincinnati, Lamont Doherty Earth Observatory and University Maine (T.V. Lowell, M.A. Kelly, B. Hall., C.A. Smith, K. Garhart, S. Travis B.M. Goehring and G.H. Denton) (http://wattsupwiththat.files.wordpress.com/2007/12/uc-agu-greenland-dec-07-v45.pdf) was a demonstrate photography 6-8 cm diameter a fossil tree - from edge ice cover of the dome Istorvet, in Liverpool Land, Scoresby Sund (East Greenland - 70°50’N, 22°13'W) in situ with roots in > 8 cm a organic layer soil…The age by 14C a fossil tree = 1590 (±25) - 1040 (±30) yr BP (~ 400 -1015 AD), with high vegetation for period 840 - 980 AD. The Temperature of Air in cool East Greenland was a sufficient by vegetation of tree and shrubs on ~280 - 600 vertical m above the sea level… Brooks C.E.P., already in 1950 (Climate trough the Ages. Ernest Benn Limited, London. p. 395.) behind: Koch 1945, Petterssen 1914; say: - in period between V-VI - X-XI century, the Arctic Sea was do not have ice cover (…) or was to have firn-snow-semi-ice cover. For example a confirmation it is in: Berge J., Johnsen G., Nilsen F., Gulliksen B., Slagstad D., 2005. Ocean temperature oscillations enable reappearance of blue mussels Mytilus edulis in Svalbard after a 1000 year absence. Marine Ecology Progress Series, 303; 167-175.; and in: Story of Viking Colonies' Icy 'Pompeii' Unfolds From Ancient Greenland Farm - with Science, The New York Times 17.04.2008 - in 1935 the Arctic ice cover was likely as 2007. See “Greenland warming of 1920–1930 and 1995–2005” (GEOPHYSICAL Research Letters, VOL. 33, L11707, doi:10.1029/2006GL026510, 2006 33, L11707, DOI: 10.1029/2006GL026510, 2006) and http://klimat.files.wordpress.com/2007/03/salt_rec.jpg If it is true: what about the polar bears ‘et camarades’, in MVP. - dear IPCC-expert’s ? …and: “natural or man-made…” I remind You, that: “In the past two centuries, the Arctic has warmed about 1.6 degrees. Dirty snow caused 0.5 to 1.5 degrees of warming, or up to 94 percent of the observed change, the scientists determined.” + Solar Activity 14C - data from United States Geological Survey - see: Modern Maximum; and 1% S.A. for the different effects = even +/-2,3oC global temperature - und ours clear… …about professor Beck - historical CO2 - he’s right: Ice core - don’t say true - You must see in this paper: “Phytoplankton Calcification in a High-CO2 World” : M. D. Iglesias-Rodriguez, et al. Science 230, 336-340, 18 Apr 2008. freely downloadable from http://www.sb-roscoff.fr/Phyto/index.php?option=com_docman&task=doc_details&gid=418&Itemid=112,; and “A bi-proxy reconstruction of Fontainebleau (France) growing season temperature from AD 1596 to 2000” (www.clim-past.net/4/91/2008/) Fig. 2b; 3a - δ13C… My friend professor Jaworowski said: Ice core - here is too great chemical relation between H2O and CO2 - ice cores “say” probably only about history a remove CO2… Comparison the papers: “Rapid atmospheric CO2 changes associated with the 8,200-years-B.P.” Wagner et al 2002 (www.pnas.org/content/99/19/12011.full) fig 2. with fig. 3C (C4 %) in “Comparison of multiple proxy records of Holocene environments in Midwestern USA”: Baker et al. 1998, (http://people.ku.edu/~lgonzlez/NewFiles/Publications/Bakeretal98.pdf.) …and see: "A role for atmospheric CO2 in preindustrial climate forcing" by Thomas B. van Hoof et al. http://www.pnas.org/content/early/2008/10/03/0807624105.full.pdf P.S. Sorry by my Slavonic - Polish name and English Language…
    0 0
  25. Beck is no "professor." What are his publications? (Energy and Environment does not count)
    0 0
  26. Clarification: Conservation of (Angular) momentum. It may have seemed a bit abstract, even if well reasoned, to assert conservation of angular momentum in the absence of torque and use this principle to guide understanding of fluid motions, and additionally to include planetary vorticity. Point 1. Illustration of the link between angular momentum and linear momentum. Suppose two balls are rolling past each other as if on different parallel tracks. Picking an inertial (non-acceleration - this also means not rotating) reference frame that follows the center of mass of the system of balls. Thus, it can be seen that both balls are either approaching the origin and each other, or moving away from the origin and also each other. Add a force on each ball such that there is no torque on the system of balls. For just two balls (or any combination of two groups that make up the whole), this requires the 'line of action' of the force acting on both pass through the center of mass. If there is a net force on the system, the center of mass of the whole system accelerates, but provided there is no torque on the system, a system-centered reference frame can be allowed to accelerate such that there is no net apparent force. In that case the sum of all forces is zero - for just two balls, it is as if the balls either repel or attract each other with equal and opposite forces. The angular momentum is the equal to the cross product of the position vector times the mass times the velocity vector for each ball, where the position vector is from the origin (the center of mass of the two balls) - a vector that points from (0,0,0) to the ball. Notice that for two balls on parallel paths, this is equal to the cross product of the shortest vector from one path to the other times the linear momentum of the ball on the second path (it doesn't matter which path and which ball - the two vectors between paths are equal and opposite, as are (in the given reference frame) the two linear momenta. If the balls are rolling towards each other and they are then pulled toward each other, they accelerate, so that they gain some velocity in rolling toward each other in the direction they were going while at the same time they change directions (the component of acceleration perpendicular to velocity) so that (after any given length of time) they now roll faster towards each other on different paths that are closer together. The physics works out such that the distance between paths and momentum along them are inversely proportional, thus keeping the angular momentum constant. On the other hand, if an attractive force between the balls is applied after their closest approach, so that they are moving away from each other, then initially the paths will move farther apart while the motion slows down; the two changes again are inversely proportional. And so on for repulsion. For balls moving along a circle, forces on the balls toward or away from the center of the circle will cause spiralling in or out - but steady circular motion is itself acceleration toward the center; thus pulling toward the center causes increased speed while shrinking the radius; pushing out slows down speed while enlarging the radius, etc. And on a rotating planet? 1. First, you may have wondered - why not just conserve the total angular momentum - as a vector quantity - while moving about? For example, planetary vorticity and thus the planetary angular momentum as vectors are parallel to the Earth's axis (and point North - 'right hand rule'); in the former discussion what was often mentioned was the local vertical component of those things. While in general the vertical component of a torque vector (acting on the angular momentum of horizontal motion) is relatively small for larger-scale motions, torques with other components can be important. If rotating air, including it's rotation aquired from the rotating Earth beneath it, is carried to some other latitude, a gyroscopic effect would tend to keep it oriented as it was, rather then bending with the curve of the Earth. (There are actually vertical accelerations associated with the coriolis effect.) Two vertical forces are very strong - gravity and the counterbalancing vertical pressure gradient force are just about equal, and they dominant well above everything else, except for some smaller-scale forces such as rapid updrafts in strong thunderstorms whose accelerations balance an otherwise imbalance in vertical forces - anyway, these vertical forces easily keep the air lying flat or on isentropic or other surfaces whose slopes are determined mainly by other processes. The local vertical component of the absolute (relative + planetary) angular momentum vector can thus be conserved (absent other torques) even as the direction of vertical changes going around the Earth. 2. The conservation of angular momentum associated with planetary vorticity f can be illustrated as follows: if there is a ring of air and that ring is then brought in toward it's center (convergence) - note that except for a beta effect (df/dy not equal to 0), the geostrophic wind is non-divergent in isobaric (and also isentropic, I believe) coordinates - the convergent motion may be ageostrophic, and if so, the coriolis force on it is not balanced by the pressure gradient force. This means the coriolis force itself exerts a torque about a center on ageostrophic motions that are toward or away from that center, thus changing the relative angular momentum - but conserving the absolute (relative + planetary) angular momentum. (This torque is not typically labelled as a torque in equations because the vorticity equations are written with the sum of f and RV. If it is to be regarded as a torque, it is an important torque; otherwise there are not generally any such important torques acting on large scale quasi-horizontal motions (except friction near the surface)). Specifically, the coriolis acceleration's magnitude = f*u, where u is wind speed. Acceleration over time produces a change in velocity; wind speed u over time produces a displacement. Thus an 'ageostrophic displacement' produces a a change in velocity proportional to the displacement times f. Which brings us to 'absolute momentum'...
    0 0
  27. Arkadiusz Thank you for the links.
    0 0
  28. Philippe Re: Beck is no "professor." Nit picking. The papers linked do support Beck.
    0 0
  29. Philippe Chantreau Beck is no "professor." = he’s not right? Harro Meijer and Ralph Keeling having betters arguments… I propose you - Yet see else only: http://homepage.ntlworld.com/jdrake/Questioning_Climate/userfiles/Ice-core_corrections_report_1.pdf I don’t agree with everything what is in this paper, but it’s interesting and I think very important in the IV report IPCC context.
    0 0
  30. Re #324/328/329 Becks analysis is clearly rubbish. See for example: http://www.skepticalscience.com/solar-activity-sunspots-global-warming.htm (see post #172) And of course the links that Arkadiusz cites in his posts don't support Beck at all (Beck's a schoolteatcher btw). For example: ONE: Arkadiusz suggests we look at Phytoplankton Calcification in a High-CO2 World” : M. D. Iglesias-Rodriguez, et al. Science 320, 336-340,2008 (note that the volume number is 320 not 230) The data is summarized in Figure 4 of that paper which shows average coccolithophore mass as a function of time during the last couple of hundred years; high mass is proposed to correlate with high CO2 concentrations. The data are very noisy with large errror bars, but the smoothed fit matches very well with the atmospheric CO2 data from the Siple ice core, and (since 1959) with the Mauna Loa observatory data. In other words the paper is entirely inconsistent with Becks ludicrous "analysis" of CO2 levels jumping up and down wildly during the 20th century, and entirely consistent with the high resolution atmospheric CO2 record from Mauna Loa and ice cores. TWO: Arkadiusz suggests we look at a truly harebrained "analysis" of ice core CO2 data from the Fuji Dome core in Antarctica on some person's website ("JJ Drake"). Let's first of all take the nonsense presented there at face value. Does it support Beck's attempt at pretending that atmospheric CO2 levels jump up and down all over the place by vast amounts in very short periods? Not really. JJ Drake's "analysis" artefactually smooths out the atmospheric CO2 record of around 400,000 years such that it is largely constrained in a tightish band near 325 ppm (keep this number in your mind for later). So that's also entirely inconsistent with Becks notion of massive jumps up and down in atmospheric CO2 levels. It's worth pointing out the blatant error in "JJ Drake"'s "analysis". JJD has ignored his own mantra (see top of page of his website) that "Correlation is not Causation", and pretended that a correlation is a causation. Here's the problem: JJD has noticed a Figure (Figure 2) in a paper in which the Antarctic Fuji Dome core CO2 record is described: K. Kawamura et al. (2003) "Atmospheric CO2 variations over the last three glacial–interglacial climatic cycles deduced from the Dome Fuji deep ice core, Antarctica using a wet extraction technique" Tellus B 55, Issue 2, Pages 126-137 In the Figure (reproduced in JJDrake's website that Arkadiusz Semczyszak links to in post #329), the trapped CO2 concentrations are plotted as a function of time, and show the very nice glacial/interglacial record observed in all of the cores from Antarctica and Greenland. Also plotted is the difference in age between the ice and the trapped gas (dIG = delta ice/gas) as a function of time through the core. JJDrake notices that there is a correlation. If one plots the dIG as a function of measured [CO2] one gets a reasonable straight line that extrapolates back to 325 ppm at dIG=0 (remember that number from above?). JJDrake then attributes a spurious cause to to this correlation, namely that the CO2 somehow disappears/is destroyed from the trapped ice, and the rate of this disappearance is proportional to the age diference between the ice and the trapped air. Is there any physical/chemical basis for this assumption? JJDrake doesn't give us any. And what's the effect of "compensating" the ice core record by assuming Drake's fictitious non-defined causal relationship between dIG and magical disappearance of CO2? It effectively smooths out the record so that the CO2 concentrations are pretty close to 325 ppm for the past 400,000 years. O.K that's pretty silly. But do we know why there is a correlation between the atmospheric CO2 levels in the core and the dIG value (remember dIG is delta-ice/gas, the difference in age between the gas trapped in the core and the surrounding ice)? Yes, of course. We just need to read Kawamura et al (2003), the very nice paper that "JJDrake" has attempted to trash: It's very well known, since this can be measured directly in newly forming polar ice, that there is a time delay between snow deposition and the sealing off of the air that circulates through the loosely packed new snow that is in the process of becoming ice (called "firn"). Thus the ice is a bit (sometimes a lot) older than the trapped air bubbles within it. If snow is deposited quickly, then in general the air circulating through the firn and equilibrating with the atmosphere is trapped relatively quickly, and there isn't much difference between the age of the air and the age of the surrounding ice (in a core, for example). And vice versa. In Antarctica snow deposition is slow (allowing very long time period cores to be drilled), and so the dIG values are in general large. Remember that the rate of snow deposition is a major factor in determining the dIG value. When is snow deposition in the Antarctic fastish? It's during warm periods when atmospheric moisture levels are higher. So when it's warmer (interglacials) the firn seals off more quickly and the dIG value is smaller. During glacial periods the atmosphere is much colder, the air is dryer, snow deposition is very much slower, the firn seals off much more slowly, and so the air in the firn equilibrates with the atmosphere for much longer periods and is therefore much "younger" than the surrounding ice when it is eventually trapped...dIG is larger. So the correlation does have a causation. If JJDrake had bothered to read the paper rather than just cut and pasted a Figure from it, he wouldn't have made such a dull blunder... and so on. We could have a look at a few more of Arkadiusz Semczyszak's "links" and see whether any of thoe others supports poor master Beck!
    0 0
  31. Beck's take on wild CO2 variations is ludicrous. Not only it's not there in the data but his proposed mechanisms (biomass) to explain it are nowhere to be found in Nature.
    0 0
  32. Beck's take on wild CO2 variations is ludicrous. Not only it's not there in the data but his proposed mechanisms (biomass) to explain it are nowhere to be found in Nature.
    0 0
  33. Chris OK by Drake Chris Sorry about 230 instead 320 - these literals errors - it’s may frequent mistake. “The data are very noisy with large errror bars” - ice core only error bars, but too very large error - Chris, You known discussion by: http://www.jennifermarohasy.com/blog/archives/002176.html , and http://www.realclimate.org/index.php/archives/2007/04/the-lag-between-temp-and-co2/#more-430 “poor master Beck”? What about big maximum δ13C ~1730 in France (Fonteinblau ) and two maximum ~1950 years? What about stomatal index, C4 index?, these is indicate on a CO2 jumping - even above 100 ppmv by ~ forty - fifty years ! “poor” it’s only We (1% global product We must pay whit humbug AGW - Stern rapport) Philippe Chantreau I’m propose You on first: http://www.biokurs.de/treibhaus/180CO2/180CO2-D.pdf - here is reply of comments by H. Meijer, by R. Keeling. “nowhere to be found in Nature” - if We don’t understand it - not explain - it’s not exist? I’m suggested: - grassland - You mast reading - Global Change: Effects on Coniferous Forests and Grasslands (Breymeyer et al 1996) especially tropical pampas - they has very different NPP and very high soil, detritus, humus accumulations… (soil I think, it’s don’t appreciate the source and sink Beck’s CO2 - remind you for example ‘Biosphere 2’ experiments) - coccolith maybe same one coral - read for example early comment at “Phytoplankton Calcification in -CO2 World” ; and particularly: Macedo, MF, Duarte, P., Mendes, P. and Ferreira, G. 2001. Annual variation of environmental variables, phytoplankton species composition and photosynthetic parameters in a coastal lagoon. Journal of Plankton Research 23 : 719-732. Macedo, MF, Duarte, P., Mendes, and P. Ferreira, G. 2001. and Trichodesmium, Montastraea cavernosa, denitrification bacterial - in High CO2 - acid sea atmospheric N2 assimilations - coccolith and coral relationship... You must it known… …too match subject by this post…
    0 0
  34. Re #333 Arkadiusz, ONE: plant leaf stomatal index of past CO2 levels. I'm not sure where you get your "..CO2 jumping - even above 100 ppmv by ~ forty - fifty years."! You've brought two stomatal index papers to our attention. These are: F. Wagner et al. (2002) "Rapid atmospheric CO2 changes associated with the 8,200-years-B.P. cooling event" Proc. Natl. Acad. Sci. USA 92, 12011-12014 and: T. B. van Hoof et al (2008) "A role for atmospheric CO2 in preindustrial climate forcing" Proc. Natl. Acad. Sci. USA 105, 15815-15818 In the first one (Wagner et al, 2002) plant leaf stomatal proxy CO2 levels were reconstructed to vary by around 295 +/- 10 ppm over a period of around 2000 years (8700 BP - 6800 BP). That's certainly not consistent with Beck's massive jumps over short periods. In the second one reconstructed atmospheric CO2 levels varied by around +/- 10-15 ppm over a period of around 500 years. So neither of these is really consistent with Beck. One might make the conclusion that the ice core CO2 data is somewhat "smoothed" out by averaging of atmospheric CO2 over a period of several years before the air in the firn is sealed off (see my post #330 above and discussion of formation of polar ice) . However the stomatal index reconstructions don't show wild and massive up and down jumps of atmospheric CO2. One should also be a little careful in assessing the stomatal index CO2 reconstructions. As you may know, the analysis is based on observing the size/number of the stomatal pores in plant leafs, with the assumption that as CO2 levels rise the plants respond by reducing their stomatal pore density (I think that's right!). However there is still quite a bit of controversy amongst the pactitioners themselves as to how reliable the proxy CO2 levels are. If you look at the two papers cited one can see that the error bars are very large (e.g. in the Wagner et al paper they encompass up to almost the entire range of CO2 variation). One might also question whether the stomatal index varies with temperature; e.g. the cold spell near 8200 BP studied by Wagner et al (2002) is though to be due to the collapse of the remnant of the Laurentide ice sheet as part of the late stage of the deglaciation into the Holocene. The effect on the plant stomatal index might have contributions from a temperature response rather than from a drop in atmospheric CO2. But whatever the relatively small disagreement between the stomatal plant proxies for CO2 and the ice core measures, all of the paleoproxy reconstructions of atmopsheric CO2 show reasonably steady CO2 levels before the preindustrial age. They certainly don't display "Beck-style" massive up and down jumps. And of course we know exactly why Beck's "analysis" shows massive up and down jumps. Much of the data he presents is from data measured in cities. If one looks a some of the original papers that Beck trawls through for his "analysis" one finds that "atmospheric CO2 levels" jump by 40 ppm from the morning to the afternoon, for example. That's what happens in cities! We don't need to pretend to be taken in by Beck's ludicrous misrepresentation. A more detailed critique is described here (see post #172): http://www.skepticalscience.com/solar-activity-sunspots-global-warming.htm TWO: historical paleotemperatures in Fontainebleau. I don't see your point in directing us to this paper. It seems a nice paper: i.e. N. Etien et al. (2008) "A bi-proxy reconstruction of Fontainebleau (France) growing season temperature from A.D. 1596 to 2000" Clim. Past, 4, 91-106 It shows a very typical proxy temperature evolution over the last 140 years that indicates that the region of Fontainebleau in France is warmer now than it's been in the past. As the authors conclude their abstract: "The persistency of the late 20th century warming trend appears unprecedented." What did you consider significant? The delta 13C spikes that you note are not necessarily very significant. Again the authors state that one needs to be careful in interpreting delta 13C data from timber; they say: "...This argument acts against the use of delta-13C measurements for long term temperature reconstructions despite the fact that it can slightly improve reconstructions for the 20th century." Again, this paper seems entirely consistent with our understanding of the climate in Europe during the last 200 years. It doesn't really bear on Becks nonsensical analysis at all. Remember that when we are considering atmospheric CO2 concentrations we are interested in the globally averaged levels, and aren't interested in the sort of local effects that make Beck's analysis completely useless.
    0 0
  35. Re #333 A couple of other points Arkadiusz: You refer me to two links concerning ice core data. The first one is this: http://www.jennifermarohasy.com/blog/archives/002176.html The second one is this: http://www.realclimate.org/index.php/archives/2007/04/the-lag-between-temp-and-co2/#more-430 The RealClimate link seems entirely satisfactory. It's an excellent account of the ice core data on temperature and CO2 measures during ice age cycles. What point are you trying to make? The second link is to a blog by a certain jennifer marohasy. She seems to be a senior person at a think tank in Australia (Institute of Public Affairs), and produces/disseminates misrepresentations of the science on environmental matters. The Institute of Public Affairs is part funded by irrigation companies, logging/timber companies, cigarette companies, mining companies. In other words she's involved in the sort of attempted misrepresentation of important scientific matters in support of corporate interests. So rather similar to the US "think tanks" that told untruths about the links between ciggie smoking and cancer/respiratory and circulatory disease; untruths about the links between aspirin taking and Reyes syndrome in children; untruths about the links between chlorofluorocarbons and depletion of high atmosphere ozone...and so on. Now you may consider that it's appropriate to misrepresent the science on important issues, so as to benefit particular interests. However, I hope you would recognize that if one wants to understand what the science says/means, these sorts of institutions (and their websites) are dismal sources. One might unfortunately put Jaworowski in a similar "camp". He seems to want to create a false impression of the science on ice cores and paleoproxy CO2 measures. I'd be very interested to know what he thinks will be achieved by trying to cheat us in this way....
    0 0
  36. chris - "The effect on the plant stomatal index might have contributions from a temperature response rather than from a drop in atmospheric CO2." I would think it has to have such contributions - a 295 ppm variation over that time period would mean there was negative CO2 (antimatter? :) ) in the atmosphere at some point! (If according to X, A or B is possible, but not C, and according to Y, B or C is possible, but not A, then X+Y = B possible, A and C not possible.) And perhaps a review of what is meant by Well-mixed GHGs: Substances or phases can become well mixed when the time period of mixing is considerably shorter than that of sources and sinks (chemical and/or physical reactions or any other external sources or sinks). Clouds are not well-mixed because cloud droplets and ice crystals are forming, growing, combining, changing into eacher, and precipitating (in some cases evaporating within another air layer) etc, faster then the wind can stir them up (and stirring itself can drive these processes - mixing fog on the one hand, downdrafts from cold dry air impinging on the side of thunderstorm and causing evaporative cooling on the other hand). Water vapor evaporates from wet surfaces and also from haze particles and clouds themselves sometimes and is also removed by condensation. I don't know as much about ozone - my impression is that within the stratosphere it may be regionally mixed but there are still large latitudinal variations at any one time. Ozone of course is produced and consumed by chemical and photochemical reactions (there are, I think, siginificant differences in reaction rates between the troposphere and stratosphere. Perhaps for water vapor, too? - some of the water vapor above the tropopause gets there by oxidation of methane. Anyway...). Aerosols are also not well mixed, although some can linger in the stratosphere once there for a while. CH4 does oxydize over a decade or two, but not fast enough to avoid becoming well-mixed - at least within the troposphere (I'm less clear on upper-atmospheric variations - there are photochemical reactions that can occur a lot more up there, of course - but only H would escape to space significantly, and that's only over geologic time periods, I think (?).). This doesn't mean it's perfectly mixed over the whole air mass. Particularly near the surface, there will be heightenned concentrations near sources and immediately downwind at any given time, and there could be some regional variations. But the larger-horizontal scale variations will be small in proportion to the average. And so on for CO2. There are significant seasonal variations in CO2, but not so much that this is important for climatic effects. Also, GHG variations near surface sources and sinks are less relevant to climate effects because the lower-level air's temperature tends to be close to the surface temperature (except maybe on calm clear nights over land) - and it's only x% of atmospheric mass (~ 6 or 10% if we're discussing atmospheric boundary layer over the whole globe).
    0 0
  37. Patrick, whoops! I wrote my post too quickly: Referring to Wagner et al's leaf stomatal CO2 paleoproxy, I meant that their atmospheric CO2 levels in the 2000 years between 8600BP and 6700 BP were around 295ppm +/- 10 ppm during this period. I didn't mean to say that they varied by 295 +/- 10 ppm (although that's what I did say)! Apologies for the confusion.. Yes, your comments about greenhouse gas mixing are pretty straightforward. And yes hydrogen does only escape to space significantly on geological timescales, although the absolute rate of loss in terms of tons per year or whatever might seem rather alarming (in the same way that the absolute amount of solar mass consumed in a year also seems alarmingly high!). I guess the fact that so much of the earth's hydrogen is "locked up" in water helps to limit its loss..... There is experimental evidence that CO2 is well-mixed vertically throughout the atmosphere ('though I'd have to hunt down the relevant paper(s)). The other means that we know that CO2 is well mixed on annual timescales is that there are is a large number of measuring stations scattered around the remote and isolated regions and these show a rather close correspondence in measured atmospheric CO2 levels. As you suggest, if one measures environmental CO2 near sources (e.g. in cities) then one can find very high levels that don't represent the global average, and can even measure CO2 values that change wildly between the morning and afternoon, or between windy and windless days.
    0 0
  38. Arkadiusz, what I meant was that if a hypothesis relies on data that are not in the real world and physical mechanisms that can not be observed in the real world, then that hypothesis has essentially no existence. It's not like something we don't understand; it's something we don't see directly, or whose indirect effects are not observed either. Even String Theory has more existence than that, since it is consistent with Quantum Theory. Beck says that there has been wild up and down variations of CO2 on short time scales but offers no evidence for it except his measurements in urban areas, which are meaningless, as Chris explained. Cherry picking studies suggesting variations that are very, very far below what's needed for Beck's "hypothesis" does not help. It has dawned on me recently that climate blogging is a very futile exercise in many aspects and I probably have a lot less disposable time than Chris or Patrick for blogging, so I may or may not get to take a look at the papers you link. Got to prioritize, you know. However, I am still very confident that nothing can explain the variations proposed by Beck, because these variations are simply enormous and the time periods too short. Consider the masses of carbon that have to be injected or removed from the all atmosphere (if we are to talk about well mixed CO2, the one that matters to climate) and see if, quantitatively, it can be reconciled. Many scientists study this stuff all the time, it has already been considered. There are no biological mechanisms working such huge changes that fast. In a way, Beck's exercise is supremely ironic. He uses measurements of places where concentrated fossil fuel burning induces very large, very short term, very localized changes and then goes on to propose that the changes we see in CO2 and climate have nothing to do with fossil fuel burning.
    0 0
  39. chris - Thanks for the clarification, I was wondering! -"There is experimental evidence that CO2 is well-mixed vertically throughout the atmosphere ('though I'd have to hunt down the relevant paper(s)). The other means that we know that CO2 is well mixed on annual timescales is that there are is a large number of measuring stations scattered around the remote and isolated regions"... Actually I would like to know more about that - just how close to the surface does one have to get before one finds a diurnal variation of x% or a spatial variation of y ppm/km, etc. (The annual fluxes between the atmosphere and 1.land biota (and soil), 2.the ocean - are about 100 Gigatons and 90 Gigatons, respectively - each to and from, thus no net change, except for an imbalance most likely induced by anthropogenic emissions that removes CO2 from the air (unfortunately not all, nor guaranteed to continue as it has been - biological uptake limited/influenced by climate, attainable tree heights,etc, evolved plant cabilities, ecological interactions (and soil responses), etc, oceanic uptake limited by exchange with the deeper ocean, chemistry, etc - not as simple as just dissolving a gas in water) - and except for geologic emissions, chemical weathering, and organic burial, which are all very small in comparison. Some (most??)of the oceanic fluxes are associated with CO2 release from warmer ocean surfaces and CO2 uptake by colder ocean surfaces. Of course, the seasonal cycle in atmospheric CO2 is, I think, either mostly or entirely due to different seasonal cycles in land biota CO2 uptake and CO2 release. Adding or taking up 1 gigaton of CO2 is about 0.47 ppm change in atmospheric concentration; since the annual variation is quite a bit smaller than 50 ppm we know much of those natural fluxes are going both ways at the same time, at least if averaged over days. If the 100 gigaton addition or removal by land biota occured completely without the other, were concentrated over 10% of the surface (~1/3 land area - that might actually be about true?), and concentrated to 1/3 of the year, then a change per day of 0.4 ppm would occur if the air were stagnant horizontally; 4 ppm per day if only mixed vertically in the bottom 100 mb of air and stagnant horizontally... ) I had found a website showing the CO2 records of the last few-several decades from - I think - 8 stations(including Mauna Loa, and a few from the Southern Hemisphere). I copied and pasted some of graphs into Microsoft Paint files and overlaid them and indeed they match up very well in annual averages. It's also interesting to sea the seasonal cycles, which not surprisingly are largest in northern high latitudes. I'll post that website here if I find it again (it may have been from CDIAC). -"I guess the fact that so much of the earth's hydrogen is "locked up" in water helps to limit its loss" True; I've read that, due to lack of atmospheric oxygen, in the Archean eon, atmospheric CH4 could have built up to levels far beyond what we know; and not condensing befor reaching the tropopause, would have greatly enhanced total H content above that point, thus greatly enhancing H escape to space and - being as (after some evolution of life) most CH4 would have biogenic, and produced from photosynthetic C fixation which split H2O - methanogens and cyanobacteria together thus allowing a net reaction H2O _ 2H + O, O accumulating as H escapes to space. Of course O gets sequestered by ferrous iron in rocks (serpentinization, etc.) and the ocean (BIFs) before finally building up in the atmosphere - and then there is some evidence that over the middle of the Proterozoic, only the upper ocean was oxydized; the oxic atmospheric conditions, etc, affecting the sulfur cycle (I don't know or recall the details of that) so that the deeper ocean water turned sulfidic for several hundred million years before finally turning oxic.... (in case your interested:) 1. "Biogenic Methane, Hydrogen Escape, and the Irreversible Oxidation of Early Earth David C. Catling,12* Kevin J. Zahnle,1 Christopher P. McKay1" http://www.sciencemag.org/cgi/content/abstract/293/5531/839 2. "Proterozoic Ocean Chemistry and Evolution: A Bioinorganic Bridge? A. D. Anbar,1* A. H. Knoll2" http://www.sciencemag.org/cgi/content/abstract/297/5584/1137?ck=nck It's been awhile but I had read the whole of each of those; I've just found some interesting related material: "Molybdenum Isotope Evidence for Widespread Anoxia in Mid-Proterozoic Oceans G. L. Arnold,1* A. D. Anbar,1,2 J. Barling,1 T. W. Lyons3 " http://www.sciencemag.org/cgi/content/abstract/304/5667/87 "Did the Proterozoic 'Canfield Ocean' cause a laughing gas greenhouse? R. BUICK Department of Earth & Space Sciences and Astrobiology Program, University of Washington, Seattle WA 98195-1310, USA" http://www3.interscience.wiley.com/journal/118516679/abstract "Constraints on the Archaean Environment" "Carbon dioxide cycling through the mantle and implications for the climate of ancient Earth Kevin Zahnle1 & Norman H. Sleep2" http://sp.lyellcollection.org/cgi/content/abstract/199/1/231 --- Philippe Chantreau -"I probably have a lot less disposable time than Chris or Patrick for blogging, so I may or may not get to take a look at the papers you link." I haven't looked at any of those papers yet, either - so I've been grateful someone else did!
    0 0
  40. Correction: I was refering to 100 Gt (gigaton) of C (is t the correct symbol for ton? - PS I believe these are metric tons - even if they weren't, the numbers wouldn't be much different) of C, which mostly exists as CO2 in the atmosphere, of course. molar mass ratio CO2/C = ~ 44/12 = ~ 3.67 so 100 gigatons C would make 367 gigatons CO2. PS molar mass ratio (average air molecules)/C = ~ 2.42 PS back to angular momentum for me tomorrow or the next day.
    0 0
  41. Clarification: H escape does not occur directly from all levels above the tropopause - generally it is limited to around 500 km and higher; but H atoms from (photo)dissociated molecules below will diffuse upward due to the removal at higher levels. (without removal, generally, single atoms/ions or smaller (in terms of number of atoms) molecules will diffuse downward while larger molecules/polyatomic ions will diffuse upward because chemical equilibrium by itself favors smaller molecules and single atoms/ions at lower pressures, but diffusion will occur along a non-hydrostatic gradient (above the turbopause, each chemical 'species' acts like an atmosphere unto itself in so far as pressure decline with height being related to density and gravity, density related to pressure by ideal gas law specific to each substance if the gas law is in terms of mass)...
    0 0
  42. clarification: turbopause ~ 100 km or around there; not to be confuse with tropopause which is 'much closer to home'.
    0 0
  43. "the geostrophic wind is non-divergent in isobaric (and also isentropic, I believe) coordinates - the convergent motion may be ageostrophic, and if so, the coriolis force on it is not balanced by the pressure gradient force. This means the coriolis force itself exerts a torque about a center on ageostrophic motions " ... Just to be clear, though - that was just to illustrate one major process; Solving the momentum equations for vorticity yields the more general result that absolute vorticity (RV + f) remains inversely proportional to a horizontal area or the horizontal projection of an isobaric (or isentropic) area enclosed by material lines, which shrinks or grows by horizontal convergence or divergence, respectively, when (the horizontal component of) absolute angular momentum is conserved, which is true, except for: 1. friction or mixing, 2. nonzero solenoidal term (not applicable to isobaric or isentropic coordinates), 3. nonzero tilting/twisting (horizontal variations in vertical momentum transport, which is generally small for larger scale motions and is zero for adiabatic motion in isentropic coordinates), and with the approximation that 4. the coriolis effect acting on vertical motion and causing vertical acceleration is neglible (which is true even for rapid motions in thunderstorms, because with rapid vertical motion, the air (following the air) has to start and stop within a time frame much shorter than the Earth's rotation period, given atmospheric dimensions). 5. the 'curvature terms' are neglible (which is true) - the curvature terms account for the curvature of the Earth; for x,y,z coordinates defined everywhere locally, with x being east, y being north, z being up - moving around involves accelerations of that coordinate system itself; for example, two great circle routes that are not identical inevitably intersect, so in order for two air parcels to remain on parallel trajectories for long distances, there must be some horizontal acceleration on at least one of them... etc. - but that is a small effect. Sometimes factors which absolutely must be included for understanding longer term processes, such as radiative heating and friction, can actually be ignored without losing a basic understanding of some processes that happen over short-enough periods of time.
    0 0
  44. I've decided not to go into 'absolute momentum' unless specifically asked. The other point I was going to make was that vorticity is proportional to an angular momentum per unit mass per unit area (for circular motion at radius r, counterclockwise tangential speed v (at all points on the circle, or averaged), the angular momentum per unit mass is v*r, the circulation is v*(2*pi*r), and the area-average enclosed vorticity is the circulation divided by enclosed area, v*(2*pi*r)/(pi*r^2) = 2*v/r. Notice that v/r is the angular frequency, and the vorticity is twice the angular frequency. f is equal to twice the planetary angular frequency times the sine of the latitude, and including f, the absolute angular momentum per unit mass is v*r + 1/2*f*r^2; multiplying by 2*pi and dividing by area to get absolute vorticity, the result is 2*v/r + f, where 2*v/r is the relative vorticity. Angular momentum can also be defined for any parcel of air relative to some other parcel or point - it is then less precisely related to the vorticity in the space between. On a small scale, an intrinsic absolute angular momentum may be conserved whenever potential vorticity is conserved (when absolute vorticity is inversely proportional to an area defined by material lines), but angular momentum defined relative to any point is not necessarily conserved following the air under the same conditions. However, there is still a conservation of angular momentum that applies, where air that loses or gains this angular momentum must be exchanging angular momentum with some other air or the Earth itself. Angular momentum can be defined relative to the Earth's axis, in which case it is (per unit mass) equal to: R*cos(latitude) * [ u + OMEGA*R*cos(latitude) ] where R is the radius of the Earth (so R*cos(latitude) is the radius of a latitude circle), OMEGA is the angular frequency of Earth's rotation, u is the zonal wind (relative to the Earth) and OMEGA*R*cos(latitude) is the speed of the surface of the Earth itself in the zonal direction. Generally, on average, Westerly (eastward) angular momentum is lost from the Earth below the atmosphere by friction (and any form drag) acting on tropical trade winds, which then transport that angular momentum upward and poleward in the Hadley cell. Eddy fluxes of angular momentum transport it farther poleward and bring it downward. The Earth gets it back from friction and form drag acting on westerly winds at mid-to-high latitudes. Because the torque of the winds acting on the Earth at any one latitude belt is proportional to the wind stress times the area times the radius of the latitude circle, one or more of the following is necessary for long-term balance - stronger surface mid/high latitude westerlies than low-latitude easterlies, a greater area of mid/high latitude westerlies than low-latitude easterlies, or a greater effective drag acting on mid/high latitude westelies than low-latitude easterlies. I'm not sure if the properties of Rossby waves would tend to create the third condition if all else was equal, but the distribution of mountain ranges would have an effect. This has consequencies for how a steady-state Hadley cell would be sustained in the absence of eddies. Rather than a surface low at the equator and high at the poles with surface easterlies everywhere in between, there would be weaker polar highs or perhaps slight polar lows with midlatitude highs; the high-latitude winds would westerly with a westerly ageostrophic component (supplied from downward transport of momentum, enough to overcome friction even if around a polar low pressure) so that the coriolis force would accelerate the winds equatorward. If there were not a zero net torque, the atmosphere would continually sping up or slow down so as to change the torque until balance were achieved.
    0 0
  45. After wrapping up Rossby wave basics, I'll get back to AO/NAM (I've found one source which suggested that changes in planetary wave propagation caused by AGW could account for some of the multi-decadal trend in AO/NAM (NAM(1); however I found one paper which argues that while shorter variations of AO/NAM are linked to planetary wave flux changes, the longer-term trend doesn't seem to be so linked. (NAM(2)) Interestingly I think they focussed on a time of year when ozone depletion wouldn't be a direct factor (radiative heating/cooling), but also I'm not sure if solar changes could also be ruled out at least as far as being a direct influence via radiative heating/cooling of the polar stratosphere at the time the AO changes occur. I'm not clear on whether AGW would directly radiatively cool the lower winter polar stratosphere more than the lower winter mid-latitude stratosphere, although that seems to be the trend... Then again there's also gravity waves - did the paper include gravity waves? - no, I don't think it did... anyway, that's coming up...
    0 0
  46. Now I'm getting ahead of myself, but I wonder if maybe the longer-term trend in AO/NAM might be somehow related to changes in meridional momentum transport - if the residual mean meridional circulation (forced by EP fluxes) isn't changing, this doens't necessarily mean the gradient in zonal momentum that it crosses is not changing. Also - it seems odd to use this to describe a climate CHANGE - it is more obviously applicable to short term weather - but, as there is enhanced warming of the Arctic ocean and high latitudes particularly in winter relative to lower latitudes, this would tend to produce a 'thermal low' in the absence of everything else - and that would tend to pull air poleward at the surface (relative to whereever it goes otherwise) and push air equatorward at mid and high levels (relative to whereever it goes otherwise) and the coriolis effect would increase westerly winds at the surface - but while reducing them aloft; okay, that didn't work, but there could be more to it than that - maybe - I don't know...
    0 0
  47. Thanks, Patrick, Chris, Philippe Chantreau I can’t agree with You, The stomatal pores, their density in fossil plant leafs, it’s a fundamental legal instrument (not only in ice core context), that We not have a real unbalanced surplus of anthropogenic CO2, that CO2 don’t have long live of atmosphere, likely as present, variability of GHG was always; in finish: confirm it that first growing temperature, later CO2 concentration of air…, summary: not only man-mode melting glaciers… The density of stomata varies with such factors as: the temperature, humidity, and light intensity around the plant and also the concentration of carbon dioxide. The mature leaves on the plant detect the conditions around them and send a signal that adjusts the number of stomata that will form on the developing leaves. Not all plants We can take on experiments. Only some species have of the line relationship CO2 – stoma. They are tested in greenhouse - very wide range conditions – calibrated. First research works about it, makes in 1974… The results reported by Gregory Retallack (in Nature , 411 :287, 17 May 2001), his study of the fossil leaves of the ginkgo, was cited in the IPCC elaborations… “The reliability of this method testing on a total of 285 previously published SD and 145 SI responses to variable CO(2) concentrations from a pool of 176 C(3) plant species.” – Wagner said for students… A resolution this method is limited and "smoothed" because “…although the mechanism may involve genetic adaptation and therefore is often not clearly expressed under short CO(2) exposure times.” – “…don't show wild and massive up and down jumps…” (Wagner et al, 2002) “…to vary by around 295 +/- 10 ppm over a period of around 2000 years” – It is inadmissible “shortening”. Observed the variability in Fig. 2. is between ~ 275 – 330 ppmv CO2, and with standard deviation ~245 – 340 ppmv (the greatest down - certainly + s. deviations; in a few years ! ~7750 BP = 280 – 340 ppmv CO2, in a ~30-40 years 250 – 320 ppmv around 8700 BP; at the greatest grove – ~ 245 – 320 ppmv CO2 in < 150 years - ~ 8450 – 8600 BP). The range of variability in analyzed period for ice core is ~10 ppmv…, even around 55 ppmv (95 ppmv to vary range with s. deviation) contra 10 ppmv, is it: “relatively small disagreement”? Very interesting is comparison it with Fig. 3C in Baker at al. 1998. Correlation, even r-squadron, between a Europe fossil stoma and % C4 in America should be > 80 percent… If its true the range of variability CO2 in Holocene will be between ~200 – 340 ppmv CO2 with specially very quickly and big change between 4800 – 3400 BP. It is fine confirmation by the δ13C composition of stalagmites calcite (Fig. 3A) and… … for example, from news - about this variability; but “sedimentary total organic” is in „Holocene weak summer East Asian monsoon intervals in subtropical Taiwan and their global synchronicity” (http://www.clim-past-discuss.net/4/929/2008/cpd-4-929-2008.pdf - see specially Fig. 3). The four centennial periods: ~8–8.3, 5.1–5.7, 4.5–~2.1, and 2–1.6 kyr BP – “of relatively reduced summer East Asian monsoon” having a very interesting mark of reference whit all index in Baker et al., and Wagner at al.… Finished, I think percentage C4, maybe will by “fairest” proxy for reconstruction CO2 level (small influence of warm, rain, other falls, etc.) E. Steig i J. Severinghaus 27.04.2007 y. on RealClimate say: However very important is it, then concentration CO2 in last 650,000 years wasn’t never above 290 ppmv…, “I'd be very interested to know what they thinks will be achieved trying to cheat us in this way”… T. B. van Hoof et al (2008) – “CO2 levels varied by around +/- 10-15 ppmv” (often > 30 ppmv - more in s. d.; by a few years !) to base at early studies: “Coupling between atmospheric CO 2 and temperature during the onset of the Little Ice Age (van Hoof 2004)”. There is one: the shapes confirmations by D 47 core (however it’s only ± 6 ppmv); both: comparisons in other researching studies at fossil stoma (into L. Kouwenberg dissertation). Interesting is Fig. 2.6 (chapter 2) – growing of temperature with reconstruction Man and Jones 2003 (likely Moberg, Esper, etc.) ~ 1180; 1250; 1320 AD preceded a increase CO2 level… - “a temperature response rather” ? Kouwenberg in here research conclusion, said: “Four native North American conifer species (Tsuga heterophylla, Picea glauca, P. mariana, and Larix laricina) show a decrease in stomatal frequency to a range of historical CO 2 mixing ratios (290 to 370 ppmv). [!]” Well, well…
    0 0
  48. …about “historical paleotemperatures in Fontainebleau” - The delta 13C indexes according to IPCC experts opinion, they are very reliable. Gamon, Fraser (1985) in “History of carbon Dioxide in the Atmosphere” writing about this method: separating periods - annual (for example ice core 20-300 y), accurate to 5 percent (2% in future). Many of papers are cited in the IPCC experts publications: Freyer, Balacy - 1983; Marino et al. 1992, Lauerberger 1992, Ferency 1998; Arus et al 1993, 7; Ferio et al., 2001; Keeling, C. D. m. fl., 2005: (Monthly atmospheric 13C/12C isotopic ratios for 10 SIO stations). More Data is in tree, but They are also at shallow water (Pedro Bank), deep water (Jamaica 150 m). However no about this dates don’t have annual separating periods, as in Fontainebleau… δ13C in research “crude” dates by Fontainebleau its very interesting: increase 1950 to 1960 has shape as increase 1985 - 2000; and the “slump” after around 1960 identically as Beck analyses. Becks picks specially: 1860, 1920; they are in Fonteinbleau too! Here also (as in Beck) increase of temperature (δ18O) preceded a δ13C increase… In the Beck analyses are a few errors - too higher CO2 level in 1820, no have s. d.…, However better that it’s, then nothing… Recollecting Gamon, Fraser (1985) writing about chemical methods: accurate to 3 percent…, besides the Results of research in 1920 - 1935 y, are very concentration - they have very small deviations - it’s confirm only 3% errors; as majority Becks date included in a photosynthesis researches - confirmed by photosynthesis product. Meijer and Keeling said, at Beck analyses: no background: “A quick tour through my car-traffic-saturated home town, Paris, can give us a good first impression: • Jardin Luxembourg (major but still tiny green spot in the center of Paris) 425ppm • Place de la Bastille: 430ppm • Place de l’Etoile (the crazy huge roundabout around the Arc de Triomphe): • 508ppm • And the winner was Place de la Nation: 542ppm (160ppm over background!).” (measurements by David Widory and Marc Javoy) but They give arguments for Beck. The differences dated only from present enhanced traffic of car !!! Difference between Mauna Loa - Jardin Luxembourg about CO2 concentration = 40 ppmv. Before 1950 y I think a background was not higher then 20 ppmv. Even however 40 ppmv background, gives for around 1940 y, 360 - 370 ppmv CO2… Besides, old universities were from car traffic, in the distance. "The persistency of the late 20th century warming trend appears unprecedented." writing i.e. N. Etien et al. I see on Fig 3b. - only “trend appears unprecedented” only in 1970 - 2000 period (likely: http://gsc.nrcan.gc.ca/geomag/nmp/long_mvt_nmp2_e.php), but temperature records are in 1911; 47; 49. 2003 is only fourth. Average in around 1950 is smallest in comparison 2000, only about 0,2oC… And here it is not possible to blame only “metal type screens “… The temperature biases in Fontainebleau are likely as in USA (by NASA)… “against the use of delta-13C measurements for long term temperature reconstructions” - I’m against too… None too big warming = more activity soil microorganisms - more CO2, 12C (correlations T - delta 13C, is high); only the big warming is can starts up the oceanic - TH circulations (= no correlations T - delta 13C). Unprecedented here is it, that delta 13C in 1950-60 period, violently fall off, as CO2 at Becks analyses, as mass moments the largest planets… - this last is accidentals ? Maybe, I don’t known… I’m only applied scientist – adviser for agro-meteorology…
    0 0
  49. I just realized I made a mistake in describing vorticity in comments 284, 287: pure orbital/curvature vorticity is NOT equivalent to solid body rotation. Solid body rotation requires a shear vorticity that is equal to the orbital/curvature vorticity, so that the total vorticity is equal to twice the value of either component. But it is true that fluid motion locally equivalent to solid body rotation occurs when dv/dx = - du/dy and regionally equivalent over some region in which both are constant in space. Suppose an x,y system is chosen not with respect to north and south but with respect to wind direction at a point O, so that the wind is in the x direction; v = 0 at O. If the wind is along concentric circlular streamlines (or locally fit a portion of such a pattern) centered at distance R in the y direction from O, so along the y axis, the wind is in the +/- x direction. If the wind speed does not vary along streamlines, then in this case, the shear vorticity is -du/dy. For solid body rotation, it can be shown that along y, u is linearly proportional to the distance R from the center of rotation (the center of curvature of the streamlines), so that -du/dy = u/R. For solid body rotation, the wind speed is the same along a streamline, and thus the spatial rate of change of wind direction along a streamline is proportional to dv/dx at the point O where the axes were defined. In this case dv/dx is the orbital/curvature vorticity. If A is the angle around a circle about the center of streamline curvature, then dx = R*dA; the change in the wind dv over a differential angle dA for constant wind speed equal to u is dv = u*dA; hence, dv/dx = u*dA/(R*dA) = u/R. The total relative vorticity = dv/dx - du/dy, which for solid body rotation is u/R + u/R = 2u/R. The coordinates defined above are called natural coordinates, and in general distance in the direction of the wind velocity is s and distance to the left (when the wind blows from back to forward) is n (See Holton and/or Martin). In general, when V (note the change in variable) is the wind speed, and R is the radius of curvature of a streamline, positive if the streamline curves to the left and negative if to the right, then the orbital/curvature vorticity = V/R and the shear vorticity = -dV/dn, and for equivalent solid body rotation, -dV/dn = v/R. planetary vorticity f could also be said to have an orbital/curvature and shear components, but they should at any one location always be equal since the Earth (and many other such bodies) spins essentially as a solid body (for atmospheric and oceanic dynamics purposes). Thus it makes some sense that a 'gradient wind balance', which is a balance in which the acceleration of the wind perpendicular to itself (proportional to orbital/curvature vorticity) and the coriolis acceleration and pressure gradient acceleration all sum to zero, can be defined and mathematically expressed using a total effective local f value (f_loc, see Bluestein p. 190) equal to f + 2*V/R (as opposed to f + V/R). But it is important to note that R in this case must be the radius of curvature of a trajectory - which may be different and often opposite the curvature of a streamline, although trajectories match streamlines in steady-state flow (in which streamlines do not vary in time over some region).
    0 0
  50. "Thus it makes some sense that a 'gradient wind balance',"..."total effective local f value (f_loc, see Bluestein p. 190) equal to f + 2*V/R"... Actually it is some aspect of the gradient wind balance, and of course, to make complete sense of that requires some other math...
    0 0

Prev  1  2  3  4  5  6  7  8  9  10  11  Next

You need to be logged in to post a comment. Login via the left margin or if you're new, register here.


The Consensus Project Website

THE ESCALATOR

(free to republish)


© Copyright 2024 John Cook
Home | Translations | About Us | Privacy | Contact Us