Stratospheric Cooling and Tropospheric Warming
Posted on 1 December 2010 by Bob Guercio
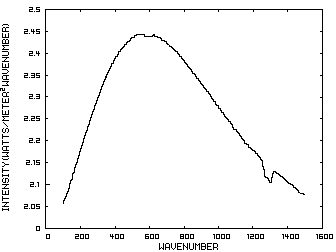
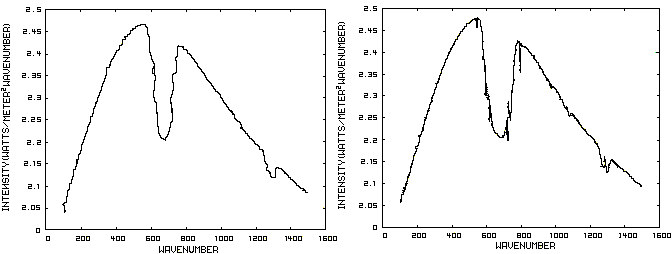
This post has been revised at Stratospheric Cooling and Tropospheric Warming - RevisedIncreased levels of carbon dioxide (CO2) in the atmosphere have resulted in the warming of the troposphere and cooling of the stratosphere. This paper will explain the mechanism involved by considering a model of a fictitious planet with an atmosphere consisting of carbon dioxide and an inert gas such as nitrogen at pressures equivalent to those on earth. This atmosphere will have a troposphere and a stratosphere with the tropopause at 10 km. The initial concentration of carbon dioxide will be 100 parts per million (ppm) and will be increased instantaneously to 1000 ppm and the solar insolation will be 385.906 watts/meter2. Figure 1 is the IR spectrum from a planet with no atmosphere and Figures 2 and 3 represent the same planet with levels of CO2 at 100 ppm and 1000 ppm respectively. These graphs were generated from a model simulator at the website of Dr. David Archer, a professor in the Department of the Geophysical Sciences at the University of Chicago and edited to contain only the curves of interest to this discussion. The parameters were chosen in order to generate diagrams that enable the reader to more easily understand the mechanism discussed herein.
Prior to discussing the fictitious model, consider a planet with no atmosphere. In this situation light from the sun that is absorbed by the surface is reemitted from the surface. Figure 1 is the IR spectrum of this radiation which is known as Blackbody radiation.

Figure 1. IR Spectrum - No Atmosphere
Consider now Figure 2 which shows the Infrared (IR) radiation spectrum looking down at the planet from an altitude of 10 km with a CO2 concentration of 100 ppm and Figure 3 which shows the IR spectrum with a CO2 concentration of 1000 ppm. Both figures represent the steady state and approximately follow the intensity curve for the blackbody of Figure 1 except for the missing band of energy centered at 667 cm-1. This band is called the absorption band and is so named because it represents the IR energy that is absorbed by CO2. IR radiation of all other wavenumbers do not react with CO2 and thus the IR intensity at these wavenumbers is the same as that of the ground. These wavenumbers represent the atmospheric window and is so named because the IR energy radiates through the atmosphere unaffected by the CO2. The absorption band and the atmospheric window is the key to stratospheric cooling.

Figure 2. CO2 IR Spectrum - 100ppm Figure 3. CO2 IR Spectrum - 1000 ppm
The absorption band in Figure 3 is wider than that of Figure 2 because more energy has been absorbed from the IR radiation by the troposphere at a CO2 concentration of 1000 ppm than at a concentration of 100 ppm. The energy that remains in the absorption band after the IR radiation has traveled through the troposphere is the only energy that is available to interact with the CO2 of the stratosphere. At a CO2 level of 100 ppm there is more energy available for this purpose than at a level of 1000 ppm, thus the stratosphere is cooler for the higher level of CO2 in the troposphere. Additionally, the troposphere has warmed because it has absorbed the energy that is no longer available to the stratosphere.
One additional point should be noted. Notice that the IR radiation in the atmospheric window is slightly higher in Figure 3 than Figure 2. This is because the temperature of the troposphere has increased and in the steady state condition, the total amount of IR entering the stratosphere in both cases must be the same. That total amount of energy is the area under both of these curves. Thus, in Figure 2, there is more energy in the absorption band and less in the atmospheric window while in Figure 3, there is less energy in the absorption band and more in the atmospheric window.


 Arguments


 0
0  0
0 *********************************************************************************
Pure Symmetric Stretching Mode
The pure symmetric stretching mode v1 of CO2. While this is a mode that may gain and lose energy collisionally it is not infrared (IR) active as there is no transient electric dipole.
 *********************************************************************************
Bending Mode V2
The bending mode v2 of CO2, responsible for the 15.00 μm (wavenumber 667 cm-1) band -- the mode dominating the enhanced greenhouse effect and that primarily used by AIRS. This is infrared (IR) active due to a transient dipole: bending results in charge being asymmetrically distributed with net positive near the carbon atom and negative near the two oxygen atoms.
 And
And
 *********************************************************************************
And Asymmetic Stretching Mode V3
The asymmetric stretching mode v3 of CO2 is responsible for the 4.26 μm (wavenumber of 2349 cm-1) band. The asymmetic stretch result in a net positive charge near the carbon atom and a net negative charge with the isolated oxygen atom, creating an electric dipole and making it infrared (IR) active. Given the range of atmospheric temperatures and concentrations of CO2 the bending mode v2 plays a greater role in climate change.
 *********************************************************************************
Now the hard part: understanding it...(if I've mis-attributed any of these, let me know)
The Yooper
 (BTW, the zero-year baseline is 1950)
Source here.
Note that there exists much more than mere charts establishing a link between rising CO2 levels and rising temperatures.
-----------------------------------------------------------------------------------------
[ - Edit - :
In the graph I supplied, temperature changes occur a few hundred years before CO2 changes. CO2 does contribute to the temperature increase but as a feedback rather than a forcing. CO2 can act as a forcing (and has, post-1970 or so), but it's effects as documented in the paleo-record have been
 But, contra damorbel, the absorber of shortwave radiation does not have to be O3 (or O2), as shown by the examples of Titan and the gass giants:


Comments