Climate Science Glossary

Term Lookup

Enter a term in the search box to find its definition.

Settings

Use the controls in the far right panel to increase or decrease the number of terms automatically displayed (or to completely turn that feature off).

Term Lookup

Settings


All IPCC definitions taken from Climate Change 2007: The Physical Science Basis. Working Group I Contribution to the Fourth Assessment Report of the Intergovernmental Panel on Climate Change, Annex I, Glossary, pp. 941-954. Cambridge University Press.

Home Arguments Software Resources Comments The Consensus Project Translations About Support

Bluesky Facebook LinkedIn Mastodon MeWe

Twitter YouTube RSS Posts RSS Comments Email Subscribe


Climate's changed before
It's the sun
It's not bad
There is no consensus
It's cooling
Models are unreliable
Temp record is unreliable
Animals and plants can adapt
It hasn't warmed since 1998
Antarctica is gaining ice
View All Arguments...


Username
Password
New? Register here
Forgot your password?

Latest Posts

Archives

The human fingerprint in the seasons

Posted on 3 December 2010 by John Cook

In 1896, Svante Arrhenius mentioned that greenhouse warming should cause winters to warm faster than summers (Arrhenius 1896), citing an earlier prediction by John Tyndall (Tyndall 1865). During summer, a region receives more sunlight and warms. During winter, the region receives less sunlight and cools by radiating heat to space. Greenhouse gases stop some of this heat from escaping to space so an increased greenhouse effect slows down the winter cooling. Consequently, if greenhouse gases are causing global warming, we expect to see winters warming faster than summer.

A pair of studies (Braganza et al 2003, Braganza et al 2004) recognise that within the temperature record are a number of climate indices that can tell us more about what's causing temperature change than mere global temperature. The difference in trend between summer and winter, between land and ocean warming, between the equator and the poles - these all hold vital clues into what has caused climate change since the instrumental record began in the 1800s.

They found that winters have been warming faster than summers. What's interesting is how the seasons have changed over time. In the early 20th century, they find the warming is a combination of man-made and natural forcing (eg - from the sun) as well as some internal variability (eg - ocean cycles). In the latter 20th century, man-made forcing accounts for nearly all the observed temperature changes (Braganza et al 2004).

To check this out for myself, I tried plotting the winter vs summer trend using the CRUTemp Northern Hemisphere land temperature record. Robert Way kindly helped out by working out the winter and summer temperature anomalies and plotting them  (here's the Excel file for the curious climate tragic).
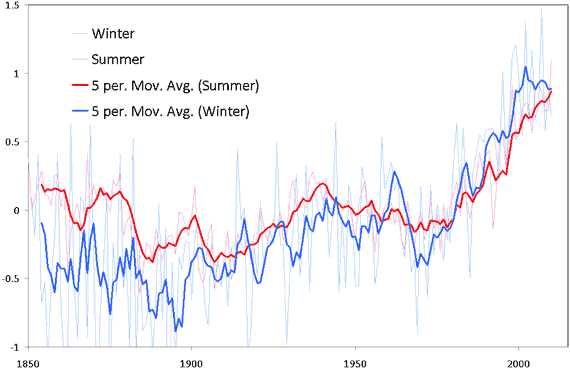
 

Figure 1: Yearly temperature anomaly for Northern Hemisphere winter (light blue) and summer (light red) plus five year moving average for winter (thick blue) and summer (thick red). Data comes from CRUTemp, base period is 1961 to 1990.

Not only does the faster warming winter provide evidence for greenhouse warming (on top of many other lines of evidence for man-made global warming), it also provides evidence that the sun isn't the cause of recent global warming. If global warming was driven by the sun, we should see summer warming faster than winter. This is just one of the "solar fingerprints" that we would expect to see from solar warming, that we don't see. Interestingly, many of the solar fingerprints are quite different to the patterns expected from greenhouse warming

For example, greenhouse warming predicts nights should warm faster than days while solar warming is the other way around. Observations are consistent with greenhouse warming. Similarly, if global warming was driven by the sun, we should see the stratosphere warming as well as the troposphere. Greenhouse warming, on the other hand, warms the troposphere but cools the stratosphere. Again, observations match greenhouse warming.

Solar warming should result in the tropics warming faster than the poles. What we observe instead is the poles warming around 3 times faster than the equator. All these pieces of evidence paint a consistent picture - greenhouse gases, not the sun, are driving global warming.

UPDATE 10 Dec 2010: In the original posting of this blog post, I mistakenly posted a graph of global temperature, not northern hemisphere temperature (which is a bit annoying - back when I was preparing this post, Robert and I looked at both NH and global trends then I mistakenly used the wrong Excel file when exporting the final graph). I've updated the post with the NH temps.

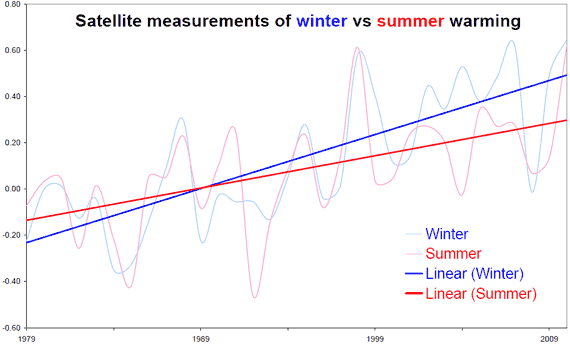
UPDATE 11 Dec 2010: Many thanks to muoncounter who went to the trouble to compare Northern Hemisphere winter vs summer temperatures in the satellite record - a handy way to independently confirm the surface measurements (here's the Excel file):
 

0 0

Printable Version  |  Link to this page

Comments

Prev  1  2  3  4  

Comments 151 to 177 out of 177:

  1. I think this should be corrected: "What we observe instead is the poles warming around 3 times faster than the equator." That's only valid for the North Pole, but not for the South Pole. What we expect from greenhouse warming is Arctic amplification, rather than polar.
    0 0
  2. I hate to bring this back to John's article but he's describing what a 'human fingerprint' would look like and comparing it to what a 'solar fingerprint' would look like. It's that comparison I'm trying to understand. I'm not saying "it's the sun" as Albatross says in #60, as I said before that's two steps forward. From what I can tell John's description of a solar fingerprint is essentially the direct effect from changes in TSI it ignores. 1) The GHG component, water vapour, of solar warming (non-contraversial but poorly constrained) 2) The top-down effect of UV (non-contraversial but poorly measured) 3) The role of CGR (contraversial) at the same time he seems to be ignoring the non-GHG component of a human fingerprint (albedo etc.). As i said before I think John is presenting this as an all or nothing scenario where 'human fingerprint' equals 'GHG fingerprint' and 'solar fingerprint' does not equal 'GHG fingerprint'. I put forward an alternative that solar has a 40-60% GHG component and the human fingerprint has a 66-100% component. I think his descriptions are too simplistic, in essence wrong. The question is whether the graph is as diagnostic as John seems to suggest when you factor in the feedbacks (and other stuff I mention). I'm asking the question and hoping for a reasonable explanation. I'm not putting forward any alternative theories for the warming.
    0 0
  3. Here's an alternative to the alternative theory: Shown below is a graph of UAH NH data through 11/2010, with 3 month averages for winter (DJF) and summer (JJA). The linear trend for winter (blue) is 0.23 deg/decade vs. 0.14 deg/decade for summer (red). Not to belabor the obvious, but "if greenhouse gases are causing global warming, we expect to see winters warming faster than summer". Yep, 64% faster.
    0 0
  4. @107 Daniel Bailey Yes, look at the graphs. Towards the end of November from 2008 on the temps are below normal till March or so the next year. This is about the time the jet stream moves south cutting off the flow of warm air from the south. Warm air comes up from the South to warm even the UP. Current NWS climate summary CF6: [TEMPERATURE DATA] AVERAGE MONTHLY: 17.4 DPTR FM NORMAL: -3.8 HIGHEST: 29 ON 1 LOWEST: -3 ON 9 And the record high was a surface temperature in August, not in December. The article states, "highest average surface temperature ever, a balmy 68.3°F." Such anomalies can be just a few feet deep as anyone who swims in inland lakes can attest to. I don't know if there is anything like Argo in Lake Superior, but the full depth is what needs to be looked at, not just the top few feet.
    0 0
  5. Re: TOP
    "Yes, look at the graphs."
    OK, what should I be seeing?
    "Towards the end of November from 2008 on the temps are below normal till March or so the next year."
    Um, you mean the parts not in the middle of the range or warmer than the range? OK, just the colder, cherry-flavored parts, check. (To make this exercise easier, I've stitched the winter months of 2008-2009 into one graph, below) So, a laser-focus on the parts of the winter temps that you want to see (the tasty, cherry-filled parts) shows a portion of the winter was below the long-term variation. Check. Ignoring, of course, the unpalatable part of the winter in the normal range of variation and the very unsavory part warmer than the long-term variation. (Similarly, here's the winter of 2009-2010, below) Needless to say, most of this winter was simply too bitterly warm to eat. Good thing that jet stream was there to keep us cold, right?
    "Such anomalies can be just a few feet deep as anyone who swims in inland lakes can attest to."
    TOP, few "swim" in Lake Superior. Even the locals. Even at the height of summer it's simply too cold (those balmy top 6" rarely top 50 degrees or so). The fact that one can do a full-body immersion (I'm 6'-3") for hours at a time now is simply without comparison (twenty years ago I would not have dreamed of attempting this ever in my lifetime). That's why we locals usually swim in the inland lakes or where the streams meet Lake Superior (we know where the tide rips are; the "fudgies"/tourists don't, sadly and we lose a few every year).
    "I don't know if there is anything like Argo in Lake Superior, but the full depth is what needs to be looked at, not just the top few feet."
    Yikes! You mean all 1,332 feet deep? Valuable stuff will get frozen off... Seriously, TOP, that's why we use baselines and anomalies. To measure the deltas. Which show this area is warming. Including Lake Superior. If you want to find correlations that actually exist, look at the droughts of the past few years relative to the long-term records or run the local temperature record for the past few winters and correlate it with the Arctic Oscillation. You'll find local weather here is colder during the negative phase. OK, fun's wearing off now. Lemme know if you find a statistical correlation on that AO thingy. The Yooper
    0 0
  6. #151 muoncounter, From the article you linked me to. "The emergence of strong ice–temperature positive feedbacks increases the likelihood of future rapid Arctic warming and sea ice decline." In the next few years we will be able to determine if this theory is the correct one for the Arctic amplification. I will pay close attention to see if the sea ice extent goes below 2007 in the coming years. Hopefully it is not too late to make changes after a 5 year investigation period. Others are predicting a cooling phase that will lower temps until 2030. Do you know the webpage for current Arctic temp anomalies? When I look at this page most the Arctic (Canada, Alaska, Europe, and Russia look fairly cold). When I do a few spot temp checks like Yakutsk Russia or Yellowknife Canada they all seem below normal. Here is a link I look to daily to try and get a grasp of Global Temps in a quick view (unfortunately not anomalies though). Quick look at Global Temps.
    0 0
    Moderator Response: [Daniel Bailey] This is a great resource for Arctic temperature info and trends. This is another great resource as well.
  7. 155 Muon "if greenhouse gases are causing global warming, we expect to see winters warming faster than summer". Muon when has the earth warmed and part of that trend did not include the effect of a GHG? To make it easier I'll give you any time in the past several hundred million years.
    0 0
  8. HumanityRules wrote:
    Muon when has the earth warmed and part of that trend did not include the effect of a GHG? To make it easier I'll give you any time in the past several hundred million years.
    So you are contesting with "since when have greenhouse gases haven't caused a greenhouse effect", aren't you? What is the purpose of your question and what has it to do with the seasonal trend? Are you implying that "all warming processes are made equal"? Certainly Physics doesn't change, but you know what are we really talking about.
    0 0
  9. Moderator, Thank you for the links to the Arctic. I visit Sea Ice on a regualar basis. I couldn't find current Arctic anomalies in the search engine. Just gave me past data. I put both in my favorites and can check them out to keep up-to-date.
    0 0
    Moderator Response: [Daniel Bailey] Did a little more digging. Try this site: http://data.giss.nasa.gov/gistemp/maps/. Be sure to set the projection type to polar to then get the polar anomalies you seek.
  10. #159: "when has the earth warmed and part of that trend did not include the effect of a GHG?" #160: "Are you implying that "all warming processes are made equal"?" As Alec Cowan notes, RSVP's question seems like either a silly one or a trick, a bit like 'do you walk to school or carry your books?' Isn't there always an 'effect of a GHG'? Its the GHE that "keeps the surface temperature of the Earth approximately 30 degrees C warmer than it would be if there were no greenhouse gases in the atmosphere." But I'm assuming you are the same RSVP who posited this not that long ago: the result for "waste heat" could be 0.1 C. So the only way it could be GHG is if all the waste heat magically goes away, which is what the "non contrarians" are going to have to say. From the vigorous defense of the 'its waste heat' position that either you or your twin RSVP mounted, I concluded you (or the twin) would answer your current question as 'the effect of GHGs is not at all significant' -- because you both think its all waste heat. So maybe you or the twin should be the one(s) answering your own question. And be sure to explain the observed asymmetry between winter warming and summer warming rates, both for the early-20th century warming and the current warming. 'To make it easier' for you(se): I assumed you would answer that its because of all the 'waste heat' we use to heat our homes in the winter. So I checked the monthly data from the USEIA, which show that (at least in the US), there's not really much difference in total energy consumption between JJA and DJF (we may be energy-hogs over here, but at least we're consistent).
    0 0
  11. @Norman (#161) You may find interesting this resource: http://arctic.atmos.uiuc.edu/cryosphere/ and about ice anomalies in the Arctic: http://nsidc.org/data/seaice_index/images/daily_images/N_stddev_timeseries.png (Check also the parent directory seaice_index/) http://psc.apl.washington.edu/ArcticSeaiceVolume/IceVolume.php
    0 0
  12. @muon: you were responding to HR, not RSVP, but I agree there's a chance the two are the same person. They use pretty much the same arguments, formulated with similar writing patterns. That said, it's not constructive to theorize about the secret identity of trolls. The best is to ignore the obvious ones, and carefully rebut the more subtle ones, as you are doing.
    0 0
  13. My mistake. That's what I get for reading SkS at 6am local, prior to coffee kicking in. HR, ignore the RSVP part of my reply if you like. RSVP, no harm intended; feel free to chime in with waste heat if you like.
    0 0
  14. 162 muoncounter OK I'll ignore the RSVP stuff but..... "question seems like either a silly one or a trick" Muon I thought the silliness was contained in your statement "if greenhouse gases are causing global warming" So I replied with a somewhat silly question in #159 (which you skillfully avoided). But the point isn't just that GHGs exist in the atmosphere but that any primary source of warming (Human CO2, solar whatever) will always contain a GHG component because of the condensable GHG in the system. Why us "if' when we all know GHGs are always playing a role? This is my issue here I don't get the importance of this work. I don't get what this work is revealing to us. All I see is that we can say we live in a warming world and I think there are more straightforward ways of doing that. Attributing these observation to a primary cause, which seems to be the intention here, seems problematic. 164 archiesteel Wow, I'm always being accused of seeing conspiritorial behaviour here, nice of you to join me. Maybe mail to John might be able to confirm me and RSVP are in fact two separate minds. I'm guessing RSVP's spelling isn't quite as bad as mine.
    0 0
  15. I don't know if this has already been covered but I wondered whether we can even say diagnostically this is a GHG fingerprint (forget human fingerprint). What about clouds? It seems changes in cloud cover would have a very similar fingerprint both in the summer/winter and day/night trends. Briefly, low clouds play two roles 1) Reflecting solar radiation out to space at the cloud top. (Cooling effect) 2) Reflecting longwave radiation back down to the surface at the cloud bottom. (warming effect) The magnitude of these two effects will alter the rate of warming. Summer/Winter - Solar irradiance in summer is higher than in winter. The cooling effect will be greater in summer than winter while the downward radiation effect remains the same for both seasons. So in a warming world with more cloud the effect is winters warm at a faster rate than summers. Day/Night - In a similar way solar irradiance is greater during the day than the night. More clouds would reflect more longwave radiation down both day and night but would only have an increased cooling effect during the day. Overall effect is a greater warming trend at night in a warming world with more cloud. Both these observations could be described as cloud fingerprints. I realise clouds are a feedback not a forcing. But I'm not sure these sorts of observations can distinguish between the two. My point isn't "this is clouds" or "this is solar" but why is this specificly a GHG fingerprint or a human fingerprint, I still don't get that. Do these studies distinguish between a forcing effect and a feedback effect? What is specifically GHG or human about these sorts of observations? (I'm talking about summer/winter trends and day/night trends). How do these observations go beyond just being consistent with GHG warming? And what warming trend in the past several hundred million years didn't involve a GHG component anyway? The more I try thinking about these observations the less I see any importance to them (beyond we live in a warming world).
    0 0
  16. #166: "any primary source of warming (Human CO2, solar whatever) will always contain a GHG component because of the condensable GHG in the system." We must agree that both the condensable and the non-condensable GHGs are involved or else there's little to discuss. "Why us "if' when we all know GHGs are always playing a role?" Because 'us' is currently ~30 Gtons of CO2 each year. "All I see is that we can say we live in a warming world" Thank you! "Attributing these observation to a primary cause, which seems to be the intention here, seems problematic." I agree that is a very valid and significant question. Dana did a nice piece on this, which has yet to get any comments. As this is no longer a 'seasonal fingerprint' question, I'll put the rest of this long-winded reply there (hopefully making Dana feel better). As to your #167: 'what about clouds?', I'm going to leave that alone for now. There are some other active threads on the cloud question.
    0 0
  17. HR, Your question is, if GHG feedbacks are a portion of any solar warming, how do we determine whether the fingerprint in question is a fingerprint of CO2 warming and not of the feedback portion of a hypothetical solar warming. Did I understand that correctly? The answer is that this is what the simulations predict. With solar warming, summers should get warmer faster than winters, and vice versa with CO2 driven warming, all feedbacks included. The same goes for all the other fingerprints mentioned. The precise nature of the fingerprint is derived from the models, and observations have been consistent with those predictions. Does that answer your question? If you dislike invoking models, here are a couple things to consider that illustrate why your "40-60% GHG component" calculation is too simplistic for predicting the nature of the fingerprints: Water vapor has a very short residence time in the atmosphere (about 9 days). This means that any feedback generated during the summer is not going to have a long term impact into the winter. Instead, the feedback will follow proportionally along with the initial warming. Since the solar impact during the winter is greatly reduced, the GHG feedback that goes along with it will also be reduced. The opposite would be true for CO2. For the day/night signature, remember that the entirety of the solar influence is exerted during the day, while the GHG feedback effect is spread out somewhat over the full 24 hour cycle. It would take a very strong discrepancy in GHG effect from night to day in order to cancel out the solar fingerprint.
    0 0
  18. e wrote: Water vapor has a very short residence time in the atmosphere (about 9 days). This means that any feedback generated during the summer is not going to have a long term impact into the winter. Instead, the feedback will follow proportionally along with the initial warming. Since the solar impact during the winter is greatly reduced, the GHG feedback that goes along with it will also be reduced. The opposite would be true for CO2. Thank you, thank you, thank you. This is the very point that Michael Sweet made back in post 24 and that I tried to re-iterate at 68 and 93. I am very pleased to have it expressed so eloquently.
    0 0
  19. "They found that winters have been warming faster than summers." Looking at the diagram in Figure 1 (top post), it certainly seems that way. At least as long as we limit ourselves to the period 1970-2000. But after 2000 the blue curve actually goes downwards! My prediction is that we will see a new trend with progressively colder winters, bringing the yearly average down. Watch that blue curve in the years to come! Just take a look at the winter 2010-2011 so far: record lows in the British Isles in November. The earliest winter for decades in many European countries. And it is not only western and northern Europe: in November, in Russia, Tver had -24 C, and all the way 6000 kilometers towards the east, Oymyakon had -50 C. I also read about severe problems with snow in Canada some of weeks ago. Right now British major airport are closed because of snow, and many motorists have to stay overnight in their cars on snowy roads. It is almost as bad in France. In Toscana traffic is severely hindered on the roads. Flights have been cancelled in France, Netherlands, Italy, and Germany because of snow. In Sweden the winter so far is the coldest for 100-150 years (depending on what city you are looking at). In Stockholm we have had snow cover for a month now (while the snow usually does not stay on the ground until after Christmas).
    0 0
  20. Re: Argus (171) OK, I'll play. Let's take a look at the global temperature trend for the last 110 years or so: Despite variability (noise in the dataset) overall temps are up. And up. And up. Despite predilections for cherry-picked short periods of declines, the overall trend is up. OK, let's look at it a little differently. How about decadally? Here we go: Hmm, 80s warmer than the 70s, 90s warmer than the 80s, the "aughts" warmer than the 90s, check. Getting warmer. Got it. But when we speak about globally, surely it actually isn't warming everywhere? Aren't some places experiencing cold? Here's the 2000 - 2009 Temperature anomaly: What about some of the temperature datasets, some of them have to show it's cooling! Baseline-to-baseline, not really. Still up. What about up north? Surely it's cold up there! Sorry, Argus. Outside of recent, short-term weather events, looking at actual data says you're wrong. Well, maybe except where you live. But then that's not very global is it? But do go ahead and watch that blue curve. The Yooper
    0 0
  21. Argus @171 In addition to Daniel's comment, you might also google "Warm Arctic Cold Continent pattern" and look at some of the modeling. The high pressure over the arctic that we Europeans have had for the last 3 winter seems to be related to late freezing of the Arctic ice.
    0 0
    Moderator Response: [Daniel Bailey] Article on that subject here.
  22. @Argus: "I also read about severe problems with snow in Canada some of weeks ago." Actually, our winter is quite typical, even a bit on the mild side. Europe does seem to be getting colder, but remember we're talking about Global, not European temperatures.
    0 0
  23. I have tried to use Modtran to illustrate the fact that winters should warm more than summers. But I cannot get it right. Here is how I do it: - first I calculate the intensity of outgoing long wave radiation I_out for an atmosphere without CO2 for "Localilty" choosen as "Mid lattitude summer". - Then I increase the CO2 concentration to 1000 ppm and adjust the offset for T_ground until I_out matches the value without CO2, since that means the steady state is reached once again. For "Mid lattitude summer" I get the offset for Tground to 9.25 K. Doing the same for "Mid Lattitude Winter" I get the offset to be 8.02 K. That means more warming in summer than in winter. Can anyone explain what I am doing wrong and how to correctly illustrate the effect that increasing GHG's leads to winters warming more than summers using Modtran? Is the problem that Modtran is too simple to this?
    0 0
  24. 173, SRJ, I think there are a number of things you are doing wrong... for example, I think you should start by balancing your scenarios with the outgoing, top of atmosphere radiation equal to an appropriate, incoming (solar) annual/daily average. But right there you run into a big problem, because the daily average for the planet (239 W/m2) varies dramatically by latitude and season. More importantly, there are many, many hugely important factors that are not modeled in pure radiative transfer (such as convection, clouds, water vapor, and albedo changes due to changes in snow and ice). The largest is the convective transport of heat and moisture not only upward, but also poleward. A noticeable increase in temperature/heat at the equator will translate into additional (and further) transport of heat/moisture north and south, in addition to radiative warming at those locations. The point is... increased winter warming is not a direct result of purely radiative effects of increased greenhouse gases. It is instead a result of the multiple confounding factors in climate, and one that is predicted by (a) complex climate models that simulate those factors and (b) paleo-studies that find such differences in past climate change events.
    0 0
  25. # 174 Sphaerica Thank you for the response. But if it is as you say that increased winter warming is not a direct result of radiative effects, then I think the opening section of this article is too simplifying. But I guess that is how it is to avoid it being to technical. I think I will have to read Arrhenius' article to get a better understanding of this.
    0 0
  26. SRJ, Actually, I'll backpedal a little, in that the basic argument that winter will see more nighttime warming, and that is due to at least in part to radiative effects, is true. But... 1) All warming, regardless of cause, will invoke a strong, positive water vapor effect which will demonstrate this effect. 2) Any effects are complicated by everything else going on (as I already stated). 3) The implementation of Modtran you are using is ill-suited to this in particular because it is not simulating night-time, or an entire day or month or season. It is not a "climate model." It is a simple calculation that says, at some moment in time, given certain conditions, what will the radiative profile look like. [In fact, I'm now wondering what "time of day" that particular program is using -- I assume noon -- because that obviously is a factor as well. I'm surprised it's not another parameter to be selected.] The main point you should take away from this is that Modtran is absolutely the wrong tool for the job in this case (as far as I can tell).
    0 0
  27. SRJ: Just a brief comment to supplemet Sphaerica's comments. You said "[is] Modtran is too simple to this? , and the answer is "yes". Modtran does radiation calculations. The atmospheric temperature profile responds to the entire energy transfer, of which radiation is only a part - an important part, but only a part. To complete the energy transfer, you need to look at - vertical transfer of thermal energy - vertical transfer of "latent heat" (condensation/evaporation, related to vapour transport) - horizontal transfer of the same (because you're only looking at one point in the atmosphere, not the global total) The key statement of Sphaerica's is "the convective transport of heat and moisture not only upward, but also poleward." Motran is not a climate model, is is a radiative transfer model. Only one part of a climate model.
    0 0

Prev  1  2  3  4  

You need to be logged in to post a comment. Login via the left margin or if you're new, register here.


The Consensus Project Website

THE ESCALATOR

(free to republish)


© Copyright 2024 John Cook
Home | Translations | About Us | Privacy | Contact Us