Climate Science Glossary

Term Lookup

Enter a term in the search box to find its definition.

Settings

Use the controls in the far right panel to increase or decrease the number of terms automatically displayed (or to completely turn that feature off).

Term Lookup

Settings


All IPCC definitions taken from Climate Change 2007: The Physical Science Basis. Working Group I Contribution to the Fourth Assessment Report of the Intergovernmental Panel on Climate Change, Annex I, Glossary, pp. 941-954. Cambridge University Press.

Home Arguments Software Resources Comments The Consensus Project Translations About Support

Bluesky Facebook LinkedIn Mastodon MeWe

Twitter YouTube RSS Posts RSS Comments Email Subscribe


Climate's changed before
It's the sun
It's not bad
There is no consensus
It's cooling
Models are unreliable
Temp record is unreliable
Animals and plants can adapt
It hasn't warmed since 1998
Antarctica is gaining ice
View All Arguments...


Username
Password
New? Register here
Forgot your password?

Latest Posts

Archives

Understanding the CO2 lag in past climate change

Posted on 5 January 2011 by Anne-Marie Blackburn

Earth’s climate has varied widely over its history, from ice ages characterised by large ice sheets covering many land areas, to warm periods with no ice at the poles. Several factors have affected past climate change, including solar variability, volcanic activity and changes in the composition of the atmosphere. Data from Antarctic ice cores reveals an interesting story for the past 400,000 years. During this period, CO2 and temperatures are closely correlated, which means they rise and fall together. However, changes in CO2 follow changes in temperatures by about 600 to 1000 years, as illustrated in figure 1 below. This has led some to conclude that CO2 simply cannot be responsible for current global warming.
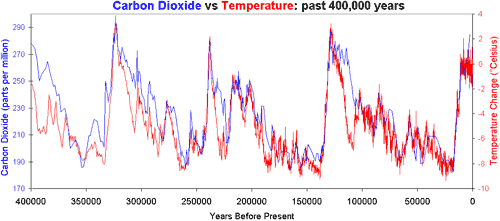
Figure 1: Vostok ice core records for carbon dioxide concentration and temperature change.

This statement does not tell the whole story. The initial changes in temperature during this period are explained by changes in the Earth’s orbit around the sun, which affects the amount of seasonal sunlight reaching the Earth’s surface. In the case of warming, the lag between temperature and CO2 is explained as follows: as ocean temperatures rise, oceans release CO2 into the atmosphere. In turn, this release amplifies the warming trend, leading to yet more CO2 being released. In other words, increasing CO2 levels become both the cause and effect of further warming. This positive feedback is necessary to trigger the shifts between glacials and interglacials as the effect of orbital changes is too weak to cause such variation. Additional positive feedbacks which play an important role in this process include other greenhouse gases, and changes in ice sheet cover and vegetation patterns.

The only conclusion that can be reached from the observed lag between CO2 and temperatures in the past 400,000 years is that CO2 did not initiate the shifts towards interglacials. To understand current climate change, scientists have looked at many factors, such as volcanic activity and solar variability, and concluded that CO2 and other greenhouse gases are the most likely factor driving current climate change. This conclusion is not based on the analysis of past climate change, though this provides key insights into the way climate responds to different forcings and adds weight to the several lines of evidence that strongly support the role of greenhouse gases in recent warming.

This post is the Basic version (written by Anne-Marie Blackburn) of the skeptic argument "CO2 lags temperature". This argument actually peeped its way into the top ten during December but then "We're heading into an ice age" shouldered its way back to the #10 spot (so there's a real dog fight between those two to climb over each other in the rankings).

0 0

Printable Version  |  Link to this page

Comments

Prev  1  2  3  4  5  Next

Comments 101 to 150 out of 246:

  1. If at least the contrarians offered us some pie after all that cherry-pickin'...
    0 0
  2. Moderators, it looks as if there's an unclosed italics tag somewhere...you might want to correct that. :-)
    0 0
  3. muoncounter, I do not intend "a ringing condemnation of ice core data." That's just another straw man. I'm expressing reasoned doubt, based on my understanding of the opinion of experts in the field. There's a bit of a 'God Of The Gaps' routine going on here - first I was told to pony up with some evidence to back my position, now that I've done that, its not enough to cite one expert (who in turn cites dozens of others), I need to cite more. Meanwhile, Sphaerica has signally failed to meet my request point to a paper published by someone with suitable credentials, stating that the various problems I mentioned (Difficulty distinguishing local from global variation, and 'noise' from the inaccuracies inherent in the record. Instead, I got an unmediated mass of hits on Google.
    0 0
    Moderator Response: [muoncounter] The one reference you posted didn't support your position all that convincingly. You've been questioning the validity of a widely used dataset; I would expect you to be eager to do a more thorough job backing up that contention. However, this thread is not about the details of ice coring; if you feel you have a credible case to make as to why those data are suspect, find a more appropriate thread (perhaps 'ice data made cooler').
  4. Albatross, Can you point out where my "potpourri of complaints" has been shown to be unreasonable? I've seen nothing scientific to that effect. I am sure, as a scientist (A real one, or in the manner of the Oregon Petition?), you wouldn't be so foolish as to accept a google blast to 'prove' a point. You'd actually expect reference to a specific paper relating directly to the paper under discussion. That's what I asked for, but instead I got a "Never mind the depth, feel the width" type response - and a lot of attacks on my integrity. I do not demand "perfection" from the ice cores as you claim (what will I do with all this straw?). Quite the opposite. But, if observing that the ice cores are imperfect is "not even remotely new or original" (Did I claim it was?) then surely it should be possible to come up with a better response than, effectivle, "Shut up! Know your place, peasant! Look at all these hits on Google Scholar!" I do not understand your claim that I am "clearly in denial about the fact that current CO2 levels are the highest in about 800,000 years, and possibly the highest they have been in 15 million years." I have suggested nothing that would substantiate that claim. Why do you advance it? I think I understand quite clearly why "in the past CO2 lagged temperature and why. Because, in the past, temperature changes were driven by orbital variations, which in turn increases GHG concentrations, those concentrations creating a feedback loop where temperature and GHG continue to increase until a further orbital shift throws the process into reverse. I also understand why the current situation is reversed, with CO2 leading temeprature - because humans have been burning fossil fuels and cutting down trees, which may lead to a similar feedback system to the one described above. See? I get it, and I totally agree with all that. But I haven't seen anything but bluster in response to my suggestion (intended to silence a 'sceptic,' not increase your blood pressure) that the claim CO2 continued to rise or stayed high for thousands of years after temperature started dropping was couldn't be borne out by looking at a single ice core, and more than global temperature could be derived from a single thermometer.
    0 0
    Moderator Response: [Daniel Bailey] For the record, Albatross is the genuine article: a working scientist that we are fortunate to have time to share with us here. As for the rest of your comments (this and previous) you have yet to adequately respond to the points Sphaerica raises in his comment here.
  5. 103, lurgee, What sort of paper do you want? A study specifically aimed at proving that the ice core data is wonderful? You know that doesn't exist, because there's no reason for anyone to create such a paper. If someone had produced a paper claiming that the ice cores were unusable, then someone else might be inspired to produce a paper proving the opposite, but the former has never happened. Steig 2008 is not a peer-reviewed, published paper. It's a brief set of notes for use at a workshop. More importantly, it does not and never even implies that the data is unusable or inaccurate or untrustworthy. It simply details the known issues with the data, and highlights the fact that, though expensive, more cores are needed. On the other hand, the point I made is very clear. Thousands of scientists have used and continue to make use of the ice core data in their work. Would they do so if they considered it untrustworthy? Clearly they don't. So what you do is to simply choose to dismiss the arguments that you can't refute. The thing is, you began all this by playing coy:
    I'm a rank amateur, but I'd question the accuracy of the ice core on that point.
    Just an amateur, but raising a seed of doubt. Called on that, you upped the ante.
    I am not disrespecting them or their work - I am reflecting what seems to be their considered opinion.
    You're "reflecting what seems to be" (your interpretation, and clearly a flawed misrepresentation) "their considered opinion." So you got called out on that. Next comes this:
    So feel free to provide evidence that the experts regard the ice core record as 'clean' and relaibale, rather than a confused, torturous mess which, unfortunately, happens to the best we've got, and ever will get.
    So now you do seem to be an expert, or at least to have the strength of opinion of one. It's also no longer mere doubt, but instead "the experts regard" it as a "confused, torturous mess". When you're given evidence, you give this:
    I can't believe you offer up a google blast as evidence. That's hardly scientific, is it?
    Actually, I think the fact that 3,730 papers/articles have been written by scientists using the ice core data is pretty darn good proof that the scientific community finds it valuable. Refusal to accept this is just so much foot stamping and tantrum throwing. All along the way, you've scatter tidbits of information, debate tactics analysis ("ad hominem!" "straw man!"), and calls for proof, and yet when you are faced with evidence of the value of the ice cores... you dismiss it out of hand as not good enough. You can stop now, Lurgee. You've accomplished your task. You've littered the thread with just enough reasoned insanity to help to confuse people who are already confused and are eager to deny AGW using any marginal handhold, no matter how unsteady. You've given that to them. They can look at your comments, and say to themselves "that sounds reasonable to me, the scientists themselves know that the ice core data is flawed, so I don't even have to pay attention to this post. I can stick with the CO2 lags temperature argument" [which hinges on the ice core data] "because the ice core data used in this discussion is invalid." Sheesh. Absolutely beyond belief.
    0 0
  6. Lurgee @104, "See? I get it, and I totally agree with all that." Where you are referring to my questions posed to you at @104. Good, we are in agreement. In fact, after re-reading this thread, it seems that somehow we have been mostly speaking past each other. If my posts have seemed aggressive or intolerant, my sincere apologies--please understand that, intentionally or not, some of your posts came across (to me and evidently others too) as those of a concern troll, and after years of playing whack-a-mole with contrarians and refuting the same old nonsense over and over again, one tends to get pretty intolerant. I concede that I too have (unintentionally) argued a few strawmen arguments along the way. So, for now, I'm willing to consider that my initial assessment of you was a false positive, although I suspect Sphaerica may disagree ;) The last thing I want is to be responsible for sending someone to the 'dark side'! Anyways, we'll see how my updated assessment pans out after more posts from you. Before signing off I would like to regroup, and speak to this statement you made @104, because this is what it all seems to boil down to: "But I haven't seen anything but bluster in response to my suggestion (intended to silence a 'sceptic,' not increase your blood pressure) that the claim CO2 continued to rise or stayed high for thousands of years after temperature started dropping was couldn't be borne out by looking at a single ice core" In your very first comment that you made here you state that: "I'm a rank amateur, but I'd question the accuracy of the ice core on that point" In the post immediately before your post, Daniel Bailey had already addressed the issue of why CO2 remained high after temperatures started cooling. Now maybe you cross posted with Daniel, but your question has already been answered; the apparent discrepancy has nothing to do with the veracity of data derived form the ice cores, and much to do with lags in the system. As for your statement: "Also, looking at a single ice core is a bit like looking at a single thermometer - you can't really be sure how much is local variation, how much is global, and how much is just confusion and noise." If I understand the literature correctly, I mostly agree with you when you are talking about temperature. However, the reason why CO2 content derived from the ice cores is representative of CO2 over a much larger area is because CO2 is a well-mixed gas in the atmosphere, as evidenced by the excellent agreement between on-going measurements of CO2 made at various locations around the world.
    0 0
    Moderator Response: [Daniel Bailey] The comment Albatross refers to is here.
  7. Hi Daniel, Many thanks for providing the link above and for confirming that I am a scientist. However, just to clarify, although I have a strong background in various aspects of meteorology and have obviously studied climate over the years, I am not a climate scientist in the traditional definition and am currently not actively publishing in that particular field-- although some of my recent research may have applications in climate science. I know, clear as mud, but I'm really tired.
    0 0
  8. I agree there has been a bit of avoidable fuming on all sides. With regards DB's earlier post, thank you for drawing my attention to it. I'd missed that in the strum und drang I unwittingly unleashed. If I may ask a further question, stemming from what DB posted (genuine, I assure you), if it takes thousands of years for CO2 to be sequestered, does this mean the current CO2 levels will persist for a similar period? I had been under the impression CO2 hung about for a couple of hundred years - which might explain my looking askance at the ice cores. Without wanting to jeopardise the fragile harmony, with regards the Eric Steig piece, I didn't intend to present his comments as a peer reviewed piece (though putting the year of publication was probably a BIT thoughtless). But - unless Steig's speech was intended as a comedy turn at the workshop - I'd say it was an accurate reflection of his professional opinions. And, of course, it referenced several other sources.
    0 0
  9. Lurgee @108, "if it takes thousands of years for CO2 to be sequestered, does this mean the current CO2 levels will persist for a similar period? I had been under the impression CO2 hung about for a couple of hundred years - which might explain my looking askance at the ice cores." The short answer to your question is yes, probably. A more detailed discussion is provided here, and that thread is probably the most suitable location to discuss this particular matter further.
    0 0
    Moderator Response: [Daniel Bailey] You type fast. I am jealous.
  10. Re: lurgee (108)
    "If I may ask a further question, stemming from what DB posted (genuine, I assure you), if it takes thousands of years for CO2 to be sequestered, does this mean the current CO2 levels will persist for a similar period? I had been under the impression CO2 hung about for a couple of hundred years - which might explain my looking askance at the ice cores."
    An excellent question. Skeptical science has examined this previously in posts here and here. RealClimate has examined this many times, most recently here and here. An RC post examining the lag between CO2 and temps is here. Wiki provides a usable synopsis:
    "Carbon dioxide has a variable atmospheric lifetime, and cannot be specified precisely.[60] Recent work indicates that recovery from a large input of atmospheric CO2 from burning fossil fuels will result in an effective lifetime of tens of thousands of years.[61][62]"
    The references are found here and here. That's assuming we manage to curb our addiction to CO2 soon. As it stands now, we have (likely) effectively put off the onset of at least the next round of glaciation. The Yooper
    0 0
  11. @gallopingcamel In spite of your introductory fanfare "One would expect to find temperature trends magnified at high latitudes, so I have concentrated on high latitudes in the northern hemisphere." giving to it all the adornment of a legitimate intend to understand, cherry picking is still cherry picking in the end. Readers can see in this site every day attempts like that to supposedly substantiate or call attention on trends or lack of them through pruning a dataset of selecting an area. Just to cite one the most recent attempts, this one. Why don't you take a look to the other comment and try to deduct a trend from both? Later, I will suggest a third one, a forth, and on and on.
    0 0
  12. It's always nice to learn things are much worse than previously thought. Just before bedtime and all.
    0 0
  13. gallopingcamel I don't think anyone has ever said that CO2 was the only factor affecting temperatures. You could also have mentioned the mid-20th-century cooling to make your point, for example. The thing with global warming is that it can lead to changes in wind and precipitation patterns, which is why some phenomena that can be perceived as counter-intuitive have been observed - such as changes in precipitation patterns leading to some glaciers growing despite warmer temperatures. In terms of possible outcomes, a warming world could lead to the disruption of the North Atlantic conveyor belt, which would lead to cooling in some regions of Europe. This is why scientists look at long-term trends in global average temperatures, rather than what is happening at a regional level, when assessing the effects of CO2 on Earth's temperatures - as Daniel has already pointed out. Regional responses to a CO2 increase will vary according to a number of variables which affect the climate of any given region, but this in no way suggests that CO2 is not the main factor driving temperature changes at a global level.
    0 0
  14. Lurgee - It's always nice to learn things are much worse than previously thought. Just before bedtime and all. Not frightening the horses is generally a good idea, except when said horses (humanity) is galloping (like a camel) directly toward a cliff.
    0 0
  15. I have referred to apiratelooksat50, and this comment of his on this thread, on another thread about zombies. (Just being polite, in case he thinks I'm doing it behind his back !)
    0 0
  16. Daniel Bailey, As you point out in your response to my last comment (#100) my data only applies to Greenland. While this is a relatively small region, there is a good correlation between the GISP/GRIP results and Vostok in Antarctica. Also, the GISP2 data clearly shows historic events (Minoan Warm Period etc.) that occurred in lower northern latitudes. I am working on the high latitudes in Russia and Canada. Give me a little time as I do have a day job.
    0 0
  17. Re: gallopingcamel (116) In order to drive acceptance, your Greenland CO2/temperature research will also have to explain the mass loss we can measure, as shown here: Then you will have to show why this global relationship is no longer valid: In addition to that, your proposed understanding will also have to explain the recent melt described here. In addition, you may want to take a stab at filtering out various cycles, like ENSO, solar and volcanic, as described here and here. I fear you tilt at windmills. But go for it. Often the only way to truly learn a subject is to roll the sleeves up and get under its hood. The Yooper
    0 0
  18. 108, lurgee, 109, Albatross, 110, Daniel Bailey I believe the main reason that CO2 levels stay high for thousands of years is that the two scenarios are very different. In today's case, the temperature-stable CO2 level is still 285 ppm, even though we've cranked it up to 390 ppm. 285 ppm is the level that the planet wants to hold CO2 to right now, based on the current mean global temp. We have artificially pumped that up to 390 ppm, not by changing the planet's temperature (the "natural" way) but rather by injecting the CO2 into the atmosphere. But if we abruptly stopped, it would start to fall immediately because the temperature of the planet hasn't caught up. It might take a few hundred years to get down, partly because in the interim the planet would warm, raising that "natural level" above 285 ppm, but it would still fall a lot faster. In the interglacial period case, where levels start at 285 ppm and fall to 190 ppm over thousands of years, it is a very slow cooling/feedback response where the temperature-stable level is slowly reduced. That is, the temperature of the planet is slowly reduced, which reduces the equilibrium CO2 level, which further reduces the temperature. The change in orbital forcing allows winter snow/ice in the northern hemisphere to expand (or, rather, fail to melt all the way back in summer, increasing the extent bit by bit each year). The resulting change in albedo reflects more sunlight, cooling the planet very slightly. As the oceans cool, they absorb more CO2, which cools the planet further, while atmospheric H2O content also drops, cooling things even more. This whole process is very, very slow, taking thousands of years. So in our case, you have a system that has been thrown out of balance/equilibrium, and so will fall back into balance/equilibrium relatively quickly. In the interglacial-to-glacial case (or the opposite, the exiting of a glacial period), you have a very slow acting forcing/feedback response which is changing the equilibrium level itself, bit by bit, and the planet slowly adjusts. They are two completely different cases, and diametrically opposed mechanisms (changing temperatures by abruptly changing CO2 levels, versus changing CO2 levels and temperatures by slowly changing temperatures). And it's all related to the whole CO2-lags-temperature argument. It's in understanding the system as a whole that it makes sense, and moving beyond the overly simplistic CO2-is-a-magic-wand-that-does-this-one-exact-thing approach.
    0 0
  19. @gallopingcamel #116 There's a buzzword "correlation" and there's a statistical concept. For instance, you have to calculate a correlation for two variables and you get a number that has usually attached adjectives -like 'good'- in intervals set by uniform criteria. In your sentence "While this is a relatively small region, there is a good correlation between the GISP/GRIP results and Vostok in Antarctica" declares an adjectival correlation for two names, something that doesn't exist. Could you state your variables and the value of such correlation? Either you did the calculations yourself or you get the values elsewhere, so you should have no problem in answering that. Other choices are you got it as a verbal chain elsewhere and are repeating it without really knowing -the bad use of concepts may be a hint- or you might be making that up. I don't think the last choices are possible, but in the lack of a precise answer, what one should think?
    0 0
  20. 118 Sphaerica, "In today's case, the temperature-stable CO2 level is still 285 ppm, even though we've cranked it up to 390 ppm. 285 ppm is the level that the planet wants to hold CO2 to right now, based on the current mean global temp. We have artificially pumped that up to 390 ppm, not by changing the planet's temperature (the "natural" way) but rather by injecting the CO2 into the atmosphere." Respectfully, how did we artificially "crank up" the CO2 level to 390 ppm from a 285 ppm normal? And, how do you arrive at the 285 ppm figure?
    0 0
  21. "Respectfully, how did we artificially "crank up" the CO2 level to 390 ppm from a 285 ppm normal?" You don't believe that burning carbon-based fuels results in CO2 being poured into the atmosphere? Or do you think some sort of magic wand is sweeping all of that CO2 out of the atmosphere?
    0 0
  22. Dhogaza@121 People like you are why it is difficult to have any civil discourse. Of course we burn fossil fuels that put CO2 into the atmosphere. Did I even imply otherwise? I'm intellectually interested in how sphaerica derived those numbers.
    0 0
  23. apiratelooksat50 - How did we pump it up? By burning lots of carbon based fuels, currently increasing atmospheric carbon by 2ppm/year, as shown by isotope analysis and basic math. The 2ppm represent 15B tons of emissions - we pump out 30B tons, so roughly half of what we put out is currently being sequestered (see Ocean acidification for where some of it is going). How do you arrive at the 285ppm figure? That's the pre-industrial value for CO2, roughly the peak value seen in the last 400K years (Figure 1). We're currently at 35% higher CO2 levels than seen in hundreds of thousands of years, while other forcings (orbital inclinations, solar levels) have not changed. It's getting warming, we did it, no great surprises here.
    0 0
  24. apiratelooksat50 - In regards to the 285ppm value Sphaerica mentioned, that's the CO2 value reached in the normal (and uninfluenced by industrial emissions) climate cycle, the slow glacial cycle of the last half million years. By all indications we should be on a slow decline in temperatures, with slowly decreasing CO2 values, heading into an ice age about 10,000 years from now. Of course, that's unlikely to happen now...
    0 0
  25. KR@123 But, we are not 100% responsible for the 2ppm rise per year. So, the calculations need to be adjusted. According to US DOE approximately 15% of annual emissions are anthropogenic. Regardless of how we monkey around with the numbers of what is staying in the atmosphere and not being sequestered in carbon sinks, we are not responsible for the full amount of the increase. Peace!
    0 0
  26. apiratelooksat50 - We put out 29-30B tons of CO2 per year. That would (if not absorbed elsewhere) cause a 4ppm/year increase. We're seeing 2ppm/year rates. And isotopic analysis indicates that it's coming from us. Now, if we weren't putting sufficient CO2 for 4ppm into the atmosphere, would CO2 concentration be increasing by 2ppm? No. It would instead be decreasing as the abnormally high (390 instead of 285) CO2 got absorbed by the oceans and biosphere. As I said before, basic math - we are 100% responsible for the 2ppm/year increase. We're putting up an excess that cannot be fully reabsorbed in the normal carbon cycle or carbon sinks, and we are responsible for that excess. In fact we are responsible for both the atmospheric increase and the changes in ocean acidification - we pump out twice as much as stays up in increased atmospheric CO2.
    0 0
  27. apiratelooksat50 - There's additional information on our responsibility for CO2 levels in Comparing CO2 emissions to CO2 levels.
    0 0
  28. I strongly suspected that apiratelooksat50's question was a set up, made under the guise of curiosity and innocence of course. And subsequent dialogue has shown that to be the case. KR, you have the patience of a saint. Maybe it is time to take this (distracting) discussion to the appropriate thread? Maybe this one, or this one?
    0 0
  29. Albatross - A reasonable idea. apiratelooksat50 - please post further items on CO2 attribution on the How do human CO2 emissions compare to natural CO2 emissions page; I will not reply further on this thread, as it's rather off-topic to the lead/lag discussion.
    0 0
    Moderator Response: Concur.
  30. KR, Thanks and I am reviewing the links you sent. My question started in response to sphaerica @118 (i.e. connecting the CO2 levels and the orbital forcing). I first saw the orbital forcings years ago on anti-AGW sites and was surprised to see it here. Very interesting are the different viewpoints on something we all agree is happening. And, Albatross, the question was innocent and in the interest of learning. KR's explanations and links are making me think.
    0 0
  31. Pirate @ 125 & 130 - And, Albatross, the question was innocent and in the interest of learning. I find it hard to accept that you teach environmental science. You should at least have basic understanding of the geological and biological carbon cycles.
    0 0
  32. Anne-Marie Blackburn (@113), It is a valid argument to point out that a particular region such as Greenland can be affected by ocean current oscillations, for example. Such factors could indeed explain the declining temperatures in Greenland over the sixty years following 1934. As mentioned in a response to Daniel Bailey earlier, I plan to continue looking at weather stations in high latitudes (e.g. Canada and Russia) in the belief that warming or cooling is magnified in the polar regions.
    0 0
    Moderator Response: [muoncounter] See Twice as much Canada, especially the recent warming rates approaching 0.5deg C/decade.
  33. oh! #125 apiratelooksat50 seemed about to back up his monkying about with this 15% as I asked him to do some posts back... ... imagine my disappointment ;(
    0 0
  34. Alec Cowan (@119), The correlations I was talking about are really striking. You seem to doubt me so take a look at this: http://www.gisp2.sr.unh.edu/DATA/Bender.html I hope you will agree that a correlation between high latitudes in both hemispheres goes a long way to counter the argument that what goes on in Greenland can be dismissed as a local phenomenon.
    0 0
  35. @gallopingcamel #133 Your assertion of dishonesty ("Your chart showing the CO2 concentration with the suppressed zero is dishonest to say the least.") is the evidence of your lack of instruction in science and ill faith. At least make yourself sure that there's a complete lack of values on an axis next time you try to label as dishonest someone that uses fair graphics but doesn't play along with your prose. You simply are showing here that you understand little science (even little high-school math) and you only have your abilities as polemicist, as you "forgot" to check that the axis had clear values (to say in a civil way that you didn't care or know, and seeing the opportunity of aiming the jugular you took your chance).
    0 0
  36. Daniel Bailey, Thanks for that link in your response to my #132. That plot for high latitudes in Canada looks remarkably similar to my Greenland plot with a long decline starting in 1934. The problem with Ned's plot is that it uses GHCN data which includes a declining number of stations after 1975. There are several years with only two stations (Alert and Resolute). I am working with Enviro Canada data which has at least 15 stations to WMO standards in most of the relevant years. Will it make a difference to include more stations? Ned says "NO" but I need to check that claim for myself.
    0 0
    Moderator Response: [Daniel Bailey] In all honesty, that was muoncounter's doing.
  37. @gallopingcamel #134 It's obvious you don't understand what's in the Y-axis [PLEASE everybody else: don't explain it to him!], therefore the implications of that correlation: We will follow this but now I will let you explain the variables and implications. Take a while to think it carefully and be sure of not being saying something in the lines "the atmosphere of the planet is one therefore Greenland rules (or any other place that share the same atmosphere)".
    0 0
  38. Alec Cowan (@135), Apparently the moderator agrees with you as #133 is now a comment by "les". Nevertheless, it is very naughty to suppress zeros on graphs so that weak trends are made to look really scary. For a different view of carbon dioxide in the atmosphere I recommend that you check out the following: http://rps3.com/Pages/Burt_Rutan_on_Climate_Change.htm Please be warned that the above link uses many words that may offend you.
    0 0
  39. #138: "For a different view of carbon dioxide in the atmosphere" To keep it fair and balanced, here's a point-by-point analysis of Rutan's paper. I don't know who the author of that blog is, but I like his style ("promoting democracy one pint at a time").
    0 0
  40. gallopingcamel - What a curious presentation. Bad unlabeled graphs ending in 1950 on a page labeled "2001", CO2 is not a pollutant, CO2 is miniscule, CO2 is saturated, CO2 is not the only driver of climate, CO2 was higher in the past, preferring stomata measurements to ice cores, CO2 lags temperature.... I could go on, but that's just a selection of evident skeptical fallacies in the first 30 pages of a 100 page PowerPoint. I'm saddened that such a good engineer is putting out junk like this. Of course, I wouldn't go to an engineer for dentistry, or a climate scientist for airframe design. I think that presentation was either a prime example of the Dunning-Kruger effect or an ideology driven ax-grind. You do yourself no favors by presenting this as an alternative to actual science.
    0 0
  41. @gallopingcamel It looks like your are programmed to do it again and again. Again you hang an unacceptable comment, get it deleted and comment what you supposedly said there -the part you see fit, the way you see favours you-. This time you chose to continue to misrepresent the figure presented by Daniel Bailey and Daniel himself with a slightly tuned down version of the same attack, but, what happened with the argument? You just have nothing to say. That's the technique: things going wrong, verbal tantrum thrown, comment deleted, you citing the comment deleted, and the argument? Oh! where is it, yeah ... we were talking of what is beyond the stars. Even more, you are making it look like you were debating that with me!!! I hope moderators will understand that it is you who are choosing the comments to be deleted and the time, so they'll find OK to keep them and everybody will follow your real arguments -or lack thereof-. With me you have an issue about highly adjetivated correlations and conclusions you extract from variables you fail to define. I pass the last link you provided. About the previous one, again, what is in the Y-axis?
    0 0
  42. gallopingcamel, Please be warned that the above link uses many words that may offend you. Offensive? Not really. Irrelevant would be more like it. I grant that there's an intent to upset people, but honestly, that kind of rhetoric stopped being offensive after the first 500,000 instances, and is now mostly just a boring inevitability. Most of us have long since learned to tune this chatter out, and proceed directly to the substance (if any). Frankly, your avoidance of clearly stated, pertinent objections to your "method" (#135 being a recent example) is a lot more irksome than anything in Rutan's approach. For a different view of carbon dioxide in the atmosphere I recommend that you check out the following: Different? Seriously? Do you really imagine that Rutan's arguments are new to anyone who's been paying the slightest attention? Some of the "skeptics" here remind me of a film I once saw of a man with Korsakov's syndrome, who treated each daily visit from his wife as an unexpected miracle. Nevertheless, it is very naughty to suppress zeros on graphs so that weak trends are made to look really scary. Now that actually is offensive. I hope you can back up this accusation. If you can't, I hope you find it within yourself to apologize. If you don't, I hope you go away. If you won't, I hope you're banned.
    0 0
  43. GC, you have been around here long enough to surely figure for yourself that the "paper" you point to is full of errors and misrepresentations. And yet you somehow believe despite this that it has some substance? What exactly do think is a good process for evaluating something like this when you come across it? And please dont say that a good evaluation technique is based on whether it supports what you would like to be true.
    0 0
  44. GC writes: The problem with Ned's plot is that it uses GHCN data which includes a declining number of stations after 1975. There are several years with only two stations (Alert and Resolute). Actually, what that plot shows is that it makes no difference to the calculated trend for Arctic land temperatures if you use only GHCN stations, or if you also add in additional stations from Environment Canada. The red line in that plot is NH Arctic land temps, with the additional stations from Environment Canada. It's more or less indistinguishable from the black line (GHCN only). The decline in station numbers is pretty much irrelevant. It has no effect on the global or zonal mean trend.
    0 0
  45. Ned (@114), Thanks for your explanation but here is my commemt from #136: "Will it make a difference to include more stations? Ned says "NO" but I need to check that claim for myself." I seldom disagree with what you on say on this blog but a great president once said "Trust but verify". Your data shows a prolonged decline in temperatures in arctic Canada starting around 1934. My Greenland plots show the same thing. I plan to make a similar plot for arctic Russia. I would be happy to send my analysis to you for review prior to posting it on the web.
    0 0
  46. KR (@140), Many of the people who you refer to as "skeptics" are reacting to the nonsense that is being put out by our government and researchers funded by the government. A classic example would be the EPA's attempt to label CO2 as a "Pollutant".
    0 0
    Moderator Response: [muoncounter] CO2's pollutant status is off-topic for this thread. The term pollutant and its application to atmospheric CO2 is thoroughly defined, discussed, reviewed and analyzed here and here.
  47. Having just received a "yellow card" from the moderator, I will ignore some comments (e.g. muoncounter and Alec Cowan) to avoid getting a "red card". However in the spirit of trying to find some common ground I agree with the following statement by Ms. Blackburn: "The only conclusion that can be reached from the observed lag between CO2 and temperatures in the past 400,000 years is that CO2 did not initiate the shifts towards interglacials." However, her next statement is less satisfactory: "To understand current climate change, scientists have looked at many factors, such as volcanic activity and solar variability, and concluded that CO2 and other greenhouse gases are the most likely factor driving current climate change." Some scientists have indeed concluded that CO2 is driving modern climate change but there are plenty of us who disagree.
    0 0
    Moderator Response: [muoncounter] You are free to ignore whatever you want, except the Comments Policy. If you raise an issue that is off-topic, you'll get a yellow card. If you keep at it, you have no one to blame but yourself when you get 'sent off'.
  48. Moderator, I call foul with this nonsensical unsubstantiated statement by GC @147 (I could easily elaborate, but won't for reasons given below): "Some scientists have indeed concluded that CO2 is driving modern climate change but there are plenty of us who disagree." This is a classic bait statement designed to fabricate debate (as was @146), and as such adds nothing whatsoever to the discussion or the science. IMHO, it is now time to ignore the obvious trolling which is going on here and wasting everyone's time. The person in question is free to engage in such musings on his own blog.
    0 0
  49. gallopingcamel - This site is called "Skeptical Science" for a reason. Statements such as "Some scientists have indeed concluded that CO2 is driving modern climate change but there are plenty of us who disagree" are empty and vacuous arguments unless you present some evidence. Without data, measurements, and in this case papers capable of convincing others in the field (which is a reasonable definition of how to present good science), it's just rhetoric.
    0 0
  50. Albatross, IMHO, it is now time to ignore the obvious trolling which is going on here and wasting everyone's time. The person in question is free to engage in such musings on his own blog. Couldn't agree more. This has been an exercise in futility, and the main thing motivating GC seems to be ideological hostility (cf. #146). That may explain why he bothered linking to Rutan's largely non-substantive paper; maybe it's not the science that's the attraction, but the invective. Perhaps that's why GC went out of his way to call our attention to the "offense" the paper might cause, rather than to its actual arguments. "Trolling" seems like exactly the right word for this pattern of insulting, evasive behavior.
    0 0
    Moderator Response: [Daniel Bailey] What was said, was said. Let us move on to discuss the science of the post and be more vigilant to the behaviors already displayed and discussed.

Prev  1  2  3  4  5  Next

You need to be logged in to post a comment. Login via the left margin or if you're new, register here.


The Consensus Project Website

THE ESCALATOR

(free to republish)


© Copyright 2024 John Cook
Home | Translations | About Us | Privacy | Contact Us