Climate Science Glossary

Term Lookup

Enter a term in the search box to find its definition.

Settings

Use the controls in the far right panel to increase or decrease the number of terms automatically displayed (or to completely turn that feature off).

Term Lookup

Settings


All IPCC definitions taken from Climate Change 2007: The Physical Science Basis. Working Group I Contribution to the Fourth Assessment Report of the Intergovernmental Panel on Climate Change, Annex I, Glossary, pp. 941-954. Cambridge University Press.

Home Arguments Software Resources Comments The Consensus Project Translations About Support

Bluesky Facebook LinkedIn Mastodon MeWe

Twitter YouTube RSS Posts RSS Comments Email Subscribe


Climate's changed before
It's the sun
It's not bad
There is no consensus
It's cooling
Models are unreliable
Temp record is unreliable
Animals and plants can adapt
It hasn't warmed since 1998
Antarctica is gaining ice
View All Arguments...


Username
Password
New? Register here
Forgot your password?

Latest Posts

Archives

Global Warming and Cold Winters

Posted on 15 January 2011 by D.Salmons

Guest post by D.Salmons

If you were to look out most windows as of this writing, there is a good chance that you would be presented with an image of winter. All around me, winter has sprung, dumping measurable inches of frozen precipitation and snarling the usual habits of work and school as we struggle to cope with its effects on modern life. And more than a few of you might be asking yourself, "What happened to global warming?"

Well, the effects of global warming are all around us. That harsh winter that we are experiencing, it is not proof that global warming is not happening, but rather serves as proof that it is indeed happening, and even a bit faster than we might like to think. It also shows why the phrase "Climate Change" is a better term to describe the effects of man on his environment.

Vladimir Petoukhov, a climate scientist at the Potsdam Institute for Climate Impact Research, has recently completed a study on the effect of climate change on winter. According to Petoukhov,

These anomalies could triple the probability of cold winter extremes in Europe and northern Asia. Recent severe winters like last year's or the one of 2005-06 do not conflict with the global warming picture, but rather supplement it.
But how does a colder winter support the idea of a warming earth? It's really simple when you look at the evidence.

Radiative Force Creates Warming
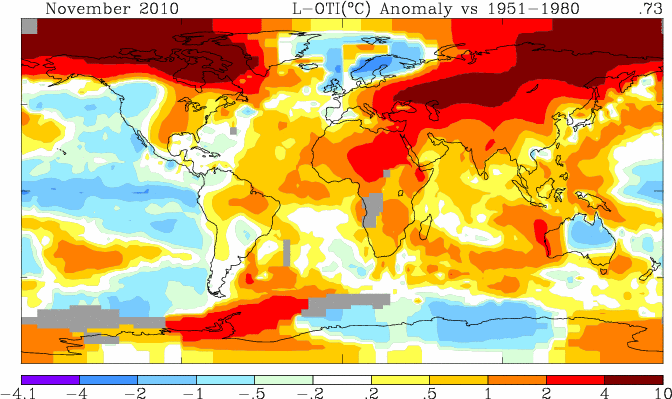


If we look at the Nasa Map above, it shows that the Arctic has been heating up, and studies show that is happening at two to three times the global average. This rising temperature in the Arctic has served to reduce the region's floating ice layer by more than 20%. And as you would expect, when the reflective ice and snow layer is stripped away, it leaves a dark blue sea.

Now, what does the effect of the dark blue sea being exposed have on the Arctic area? Well, the ice and snow layer reflects the majority of the sun's rays harmlessly back into space. But the dark blue of the exposed sea absorbs the rays, aiding the heating process.
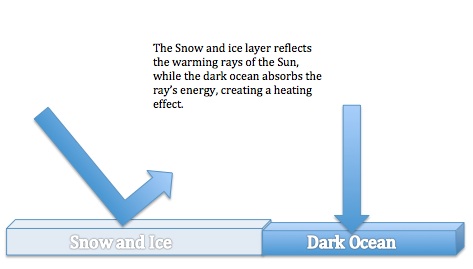
 

In short, as the ice shelf shrinks, the Arctic region becomes a better collector of the Sun's energy, speeding up the warming effect and creating an even wider solar collector from the exposed sea. It should be easy to see how the process accelerates itself.

Global Pressure creates Arctic Corridor

As the ocean gets warmer from the radiative force of the Sun's rays, it is in marked contrast with the polar air above it. The heat from the warmed ocean flows upward into the polar air, creating a high pressure system.

 

This high pressure forces the polar air to move, and soon we have a clockwise swirl that pushes frigid air downwards into Europe and across the globe.
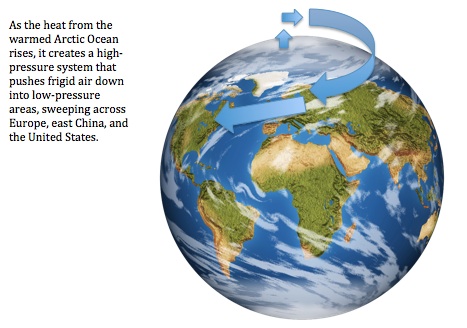
 

This newly formed "Arctic Corridor" pushes the frigid air from Europe into Eastern China and the Americas, dropping temperatures and making winter conditions more extreme than usual.

Records Support The Model
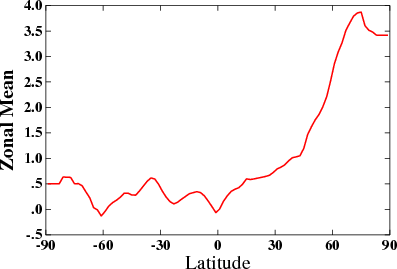
 

Record keeping by NASA and other institutes support the model of the artic corridor. If we look at the NASA's temperature graph by latitude, the temperature shift becomes much more pronounced as you approach the 90-degree mark. The effect, sometimes referred to in the Arctic Dipole Anomaly, explains the shift in weather patterns from established normals.

If the recent past is any indication, we can expect to see more wildly varied weather patterns and temperature shifts. In fact, we can look at the current weather season to see this shift in place. As we huddle in our abodes to avoid the effects of winter, consider that Greenland had temperatures above zero in December. Climate Change may be a very mild description indeed of what is happening to Planet Earth.

Author's bio: D. Salmons is a freelance writer and social media consultant for several companies, ranging from individuals to Fortune 500. She is a bit of a geek and enjoys writing about consumer electronics at Test Freak, a website that collects product information and reviews for the best GPS and other tech gadgets.

0 0

Printable Version  |  Link to this page

Comments

Prev  1  2  3  4  

Comments 151 to 179 out of 179:

  1. And if you don't get a no ice condition, let me guess, conditions weren't perturbed "enough"?
    0 0
  2. #148: "if we choose the decade starting with 2001 running through end 2010, we would expect five highs and five lows." Why? If you are comparing decadal 'highs' and 'lows' to a 60 year record, there is no guarantee of any highs and lows in a 10 year period. Could it be that the posing of these ill-formed hypotheticals interferes with understanding what is actually going on?
    0 0
  3. We have a sixty year period. We would expect the highs and lows to be distributed evenly through that period in the absence of any trends. So now look at monthly data for January. There will be 31 highs and 31 lows reflecting specific days through the 60 year period. We would expect 5.16' of those daily highs and 5.16' of those daily lows to occur in each decade. Multiply that by 6 decades and you get a high and a low for each day in the month (is this confusing?) Unexpectedly though we get far fewer highs and lows, for January, February and March.....providing no support for the view that a shift has occured. If anything the variabilty is reduced.
    0 0
  4. mozart - Please look at (and comment further upon) the thread Record high temperatures versus record lows: I've already referred you there, and it clearly demonstrates your misperceptions.
    0 0
    Moderator Response: I've deleted mozart's last couple of comments and a reply to one of them, because mozart has failed to follow the directives to put comments on the appropriate thread, "Record high temperatures versus record lows."
  5. "These record highs and lows are from a city which has just been impacted by Arctic cold" Can only hope that is was simply "affected" by the cold-- "impacted", ouch. The point that you seem to keep missing Mozart is that the loss of ice can lead to strongly negative models of the NAO/AO which leads to the so-called 'warm Arctic, cold continents' phenomenon-- i.e., unusually strong cold Arctic outbreaks. I do not think anyone is seriously suggesting that these excursions will last the entire boreal winter, nor are they suggesting it will lead to a trend in boreal winters. Europe was cold in late November and most of December, but has been mild ever since, the meteorological winter 2010-2011 (DFF) for Europe could end up being near normal. IMHO, this pattern suggests much larger wings in temperature and precipitation over the northern continents during the Boreal winter. Time will tell.... Mozart at 156 starts to show his/her true colours. You will probably think otherwise, but people have actually been very patient with you Mozart, and have repeatedly tried to guide you as to how this site works. It works for other 'skeptics' who frequent the site, so no reason that it cannot work for you.
    0 0
  6. #154: "providing no support for the view that a shift has occured." Your daily records analysis makes no sense whatsoever. Climate change is about trends established over many years and large areas. The GHCN temperature trend in the 5x5 degree lat/long grid in the Chicago area (40-45N lat, 85-90W long)? Up 0.22 degrees C per decade since 1970. The shift has occurred, whether you can see it out your window or not.
    0 0
  7. [ -Snip- ]
    0 0
    Moderator Response: [Daniel Bailey] If you insist to continually be off-topic, the moderators will have no choice but to intervene. You persist in your focus on record highs and lows in spite of everyone here trying to help you. Discussion of highs and lows should take place on the dedicated thread for it. No one wants to stifle dialogue. But it needs to be channeled into the appropriate venue for it. Thanks for your understanding!
  8. Muoncounter: I admire your finding out that Chicago has warmed at 0.22C for the past 4 decades. Where did you get that data from? Is it hard to pull out of the database?
    0 0
  9. Mozart @160, With respect, you are talking though your hat mate. You have clearly not read the literature, nor or you paying attention to what is been claimed by the scientists-- both observational and modelling data have demonstrated that changes in the Arctic ice cover have marked impacts on the the atmospheric circulation, both regionally and afar though teleconnections. The "warm Arctic, cold continents" is one of them, but do not interpret it to mean that all the northern continents will experience colder conditions for the entire winter. Anyways, a couple of those references are provided in the NSIDC reports that I linked to earlier, there are many more examples out there. And you are making the mistake of using data for one point in space to try and refute a hypothesis and conceptual model. Has it occurred to you that where the long-wave trough plunges southwards will vary from event-to-event? That is, each and every single negative phase of the AO is not the same, sometimes the trough will be displaced to the east, sometimes to the west. The maps that I showed above were the loading patterns derived for many events. The same holds true for ENSO, which is very well studied, each event is different-- so looking at data from one point and claiming it refutes ENSO (and its known teleconnections ) because it does not show the expected response because you cannot find a pattern in a particular metric (that you decided on) is pointless. By doing so you are missing the big picture. If you have an issue with the work of the scientists, then by all means do some research, write it up and submit it to a scientific journal for publication. to date all we have seen here are musings and some "fiddling" around with data for one location-- so I find it odd that you are lecturing others here about the scientific method and hypothesis testing. If i were you I would be asking more questions of the knowledgeable people here at SkS-- sincere questions please. Please read my post at 156-- going by your recent post, you seem to have ignored it (as well as posts made by others).
    0 0
  10. Actually, mozart, an hypothesis is either supported or not supported by the results of experimentation and observation. There is no "prove" or "disprove" in science. Instances of experiment or observation either raise or lower the probability/certainty for a particular hypothesis and any associated theories. Jackboots, indeed! The heart of this site is the presentation of alternative theories and hypotheses to AGW. I don't recall the brownshirts offering the same type of forum to non-Aryans.
    0 0
    Moderator Response: [Daniel Bailey] mozart just invoked Godwin's Law.
  11. DSL@161 According to Karl Popper, a hypothesis can't be proven, but can only be corroborated (supported) by experiment and observation; however a hypothesis can be disproven, which is at the heart of falsificationism. If I have a hypothesis that a coin has two heads, and I flip it an observe a tail, then my hypothesis has been unambiguously disproven.
    0 0
  12. #159: "Chicago has warmed at 0.22C for the past 4 decades." Same procedure I used here. The link to the data viewer (a website from the 'other side') is there; select the map, choose either specific GHCN stations or take the 5x5 grid. Then take the trend line on the resulting graph and select a time window. What struck me as important enough to put together the Europe post was that the recent (50 year) trends are 2-3x the 100 year trends.
    0 0
  13. @ muoncounter (163) Sounds like you've found (mock gasp!) yet another Hockey Stick! (cue Rimshot) Horrors... The Yooper
    0 0
  14. #164: "yet another Hockey Stick!" What can I say? I'm an old Rangers fan; I guess you're a Red Wings man? Seen any octopus lately? But it's amazing how these things are so consistent. Almost like there's something to this AGW thing, despite what those nitwits in Congress think. I would rag on you for giving us Fred Upton (for those who don't recognize the name, he's a Congressman from Michigan, Yooper's home state), but he's nothing compared to the knuckleheads who come from where I live.
    0 0
  15. Michiganders are a little spoiled by da Wings. The expectation is to appear in the Stanley Cup Finals every year. They rarely disappoint us. Unlike our politicos. Given we are da motor capital of da world, any mention of reducing auto usage (to reduce carbon footprints) or driving smaller SUV's is met with the same reaction as saying "we should be building windmills instead of drilling oil wells" to a Texan. "String 'em up!" The Yooper
    0 0
  16. Riddle me this: Years Wings are in the finals: 2009, 2008, 2002, 1998, 1997, 1995, 1966 ... most of these are el Nino years! As far as Texas is concerned, like the man used to say, 'if you don't have a oilwell windmill, get one!'
    0 0
  17. Excuse my brainless moment, Dikran. Blame it on newborn twins (first children) at 45. I think I left my brain at the hospital. Falsifiability is the basis for one of my favorite pithitudes: "science forces the imagination to work harder."
    0 0
  18. Give us all a break you "Global Warming" religion cranks! Trying to convince us that record cold weather is really global warming is a sick joke. Go and do something useful, help someone who is suffering from the extreme cold.
    0 0
  19. Gee, try reading what the scientists are trying to tell you. Do you notice the record high temperatures as well? (ie where you live is not the world).
    0 0
  20. Copie, Here is today's anomaly map. Where is this "record cold weather" you speak of. I see a sizable area of +20C, which has been record hot in Svalbard. The cold is only the coldest in the last 30 or so years. It is not cold by historic standards, they have just gotten used to it always being warm. Name your location that is as cold as Svalbard has been warm.
    0 0
  21. Copie is undoubtedly a troll and has absolutely zero interest in engaging the science.
    0 0
  22. Copie: Most people rely on meteorologists to forecast the weather for the next few days and weeks. Most people rely on scientists to forecast the global climate for the coming decades and beyond. About your CO2 meme, it's been debunked many times over by SkS.
    0 0
  23. Copie, weather changes all the time, climate doesn't. Climate is the long term statistical behaviour of the weather, and hence does not change constantly. Indeed you don't have to be a scientist to study climate, but you do need to keep detailed records, anecdotal evidence is known to be very unreliable. As for the more [CO2] the better, I think your lungs would disagree.
    0 0
  24. You will struggle to convince the families of the 600 odd people in Easter Europe who have died over the past few weeks from extreme cold that this is just another sign of global warming! Try explaining to them that you are scientists who reccomend that they stop using their gas heaters or wood burning fires.
    0 0
  25. Yes, Copie, it's true that it is difficult to convince some who walk out their doors and find the weather very cold. Some wouldn't even be convinced by people who live far north of them, such as people in Svalbard. While eastern Europe was in the grip of intense cold, those people were walking out their doors to find rain and temperatures 5-7C above normal for weeks. We can compare local stories all day long, but this is a poor substitute for gathering data from thermometers and satellites. You point out one of the big hurdles in the way of getting something done about the problem. Most people don't have the time, energy, training, means, and/or motivation to look at the science. Instead, they rely on their experience and maybe the local weatherman. I talk with young, well-educated people from all over the globe on a daily basis about the climate situation, and few of them understand the basics of the theory, let alone all of the mechanisms of change that will operate on a rapidly warming planet.
    0 0
  26. Copie, You are apparently unaware that carbon emissions from many eastern European countries have already declined significantly. But never fear, summer will soon be here and that should prove to you that global warming is real.
    0 0
  27. Copie - and what about those that died in heatwaves? What bit about "Global" is so hard to understand? Would the term Anthropogenic Climate Change help you understand what is going on? If you are here to beat a drum without being interested in understanding what is happening in the world, then there is no point in further discussion. Otherwise, you could try seeing what the science actually says.
    0 0
  28. Copie @ 172, a couple of comments:
    One does not have to be a scientist to be able to observe weather or climate.
    So, without doing any science - like keeping accurate records of weather over a long time and a large fraction of the globe - how exactly does one observe global climate?
    As anyone who makes their living from nature can tell you, weather and climate constantly changes, sometimes for the better and sometimes not.
    As anyone who has studied the phenomena closely can tell you, changes in climate happen for a reason. It is not some arbitrary weather god rolling the dice to come up with the Next Climate Trend: it is observable, measurable influences called forcings that invoke such changes.
    And as for all this stupid stuff about co2 being our ruination! As any student can tell you, co2 is one of lifes essentials, as important as oxygen. Generally, the more the better.
    A quick Google search turned up this information:
    "On the average, there is about 10-20 mg. of arsenic in the human body"
    The human body has evolved to accommodate this level of asenic. Would you also say of it "Generally,the more the better"? Trace gasses in the atmosphere can be as powerful as trace elements in the human body, with severe adverse effects resulting from upsetting the 'natural' balance. What are you attacking here: the science, or the threat to your comfortable lifestyle? I'm guessing it is not the science, because you are happy to accept the word of "any student" and scientists start out being students (in fact, they never stop studying until they retire, I guess).
    0 0
  29. You are clutching at straws here comparing CO2 with arsenic. For instance,CO2 is odorless, colorless, and tasteless. Plants absorb CO2 and emit oxygen as a waste product. Humans and animals breathe oxygen and emit CO2 as a waste product. Carbon dioxide is a nutrient, not a pollutant, and all life-- plants and animals alike-- benefit from more of it. All life on earth is carbon-based and CO2 is an essential ingredient. When plant-growers want to stimulate plant growth, they introduce more carbon dioxide. CO2 is less than 4/100ths of 1% of all gases in the atmosphere. Telling people to reduce CO2 is like sayiing we should reduce oxygen!
    0 0
    Moderator Response: [Dikran Marsupial] This is off-topic, please take it to a more appropriate thread, such as CO2 is a trace gas. Any further posts on this subject on this thread will be deleted.

Prev  1  2  3  4  

You need to be logged in to post a comment. Login via the left margin or if you're new, register here.


The Consensus Project Website

THE ESCALATOR

(free to republish)


© Copyright 2024 John Cook
Home | Translations | About Us | Privacy | Contact Us