Climate Science Glossary

Term Lookup

Enter a term in the search box to find its definition.

Settings

Use the controls in the far right panel to increase or decrease the number of terms automatically displayed (or to completely turn that feature off).

Term Lookup

Settings


All IPCC definitions taken from Climate Change 2007: The Physical Science Basis. Working Group I Contribution to the Fourth Assessment Report of the Intergovernmental Panel on Climate Change, Annex I, Glossary, pp. 941-954. Cambridge University Press.

Home Arguments Software Resources Comments The Consensus Project Translations About Support

Bluesky Facebook LinkedIn Mastodon MeWe

Twitter YouTube RSS Posts RSS Comments Email Subscribe


Climate's changed before
It's the sun
It's not bad
There is no consensus
It's cooling
Models are unreliable
Temp record is unreliable
Animals and plants can adapt
It hasn't warmed since 1998
Antarctica is gaining ice
View All Arguments...


Username
Password
New? Register here
Forgot your password?

Latest Posts

Archives

Climate Emergency: Time to Slam on the Brakes

Posted on 8 March 2011 by James Wight

Global warming is an increasingly urgent problem. The urgency isn’t obvious because a large amount of warming is being delayed. But some of the latest research says if we want to keep the Earth’s climate within the range humans have experienced, we must leave nearly all the remaining fossil fuels in the ground. If we do not act now we could push the climate beyond tipping points, where the situation spirals out of our control. How do we know this? And what should we do about it? Read on.

James Hansen, NASA’s top climatologist and one of the first to warn greenhouse warming had been detected, set out to define dangerous human interference with climate. In 2008, his team came to the startling conclusion that the current level of atmospheric carbon dioxide (CO2) is already in the danger zone.

Since the Industrial Revolution, atmospheric CO2 has increased from 280 to 390 parts per million (ppm). Don’t be fooled by the small number – 390 ppm is higher than CO2 has been in millions of years. CO2 is rising by 2 ppm per year as we continue to burn fossil fuels. To stabilise the Earth’s climate, we must reduce CO2 to the relatively safe level of 350 ppm. And we must hurry, because the task will soon be an impossible one.

The 350 target is based not on climate modeling, but on past climate change (“paleoclimate”). Hansen looked at the highly accurate ice core record of the last few hundred thousand years, sediment core data going back 65 million years, and the changes currently unfolding. He discovered that, in the long term, climate is twice as sensitive in the real world as it is in the models used by the IPCC.

The key question in climate modeling is how much global warming you get from doubling CO2, once all climate feedbacks are taken into account. A feedback is something that amplifies or cancels out the initial effect (eg. interest is a feedback on a loan). The models include “fast feedbacks” like water vapor, clouds, and sea ice, but exclude longer-term “slow feedbacks” like melting ice sheets (an icy surface reflects more heat than a dark surface).

Both models and paleoclimate studies agree the warming after fast feedbacks is around 3°C per doubling of CO2. Slow feedbacks have received far less attention. Paleoclimate is the only available tool to estimate them. To cut a long story short, Hansen found the slow ice sheet feedback doubles the warming predicted by climate models (ie. 6°C per CO2 doubling).
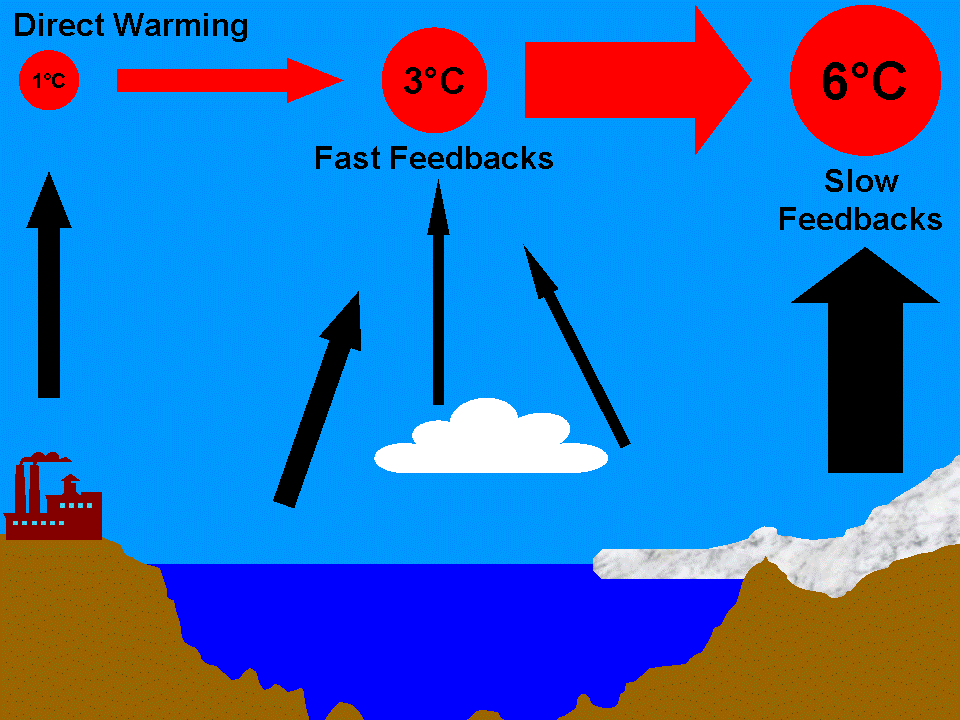
Long-Term Climate Sensitivity

The global climate has warmed only 0.7°C, but has not yet fully responded to our past emissions. We know this because the Earth is still gaining more heat than it is losing. There is further warming in the pipeline, and Hansen’s results imply there’s a lot more than in the models. If CO2 remains at 390 ppm long enough for the ice sheet feedback to kick in, the delayed warming would eventually reach 2°C. That would result in an Earth unlike the one on which humans evolved and a sea level rise of not one metre, not two metres, but 25 metres. Imagine waves crashing over an eight-storey building.

It’s hard to dispute this would be “dangerous” climate change. But how quickly could it happen? In the past, ice sheets took millennia to respond, though once they got moving sea level rose several metres per century. But maybe ice sheets can melt faster if CO2 rises faster, as it is now doing. The IPCC predicted they would grow by 2100, but instead they are starting to shrink “100 years ahead of schedule”. Once an ice sheet begins to collapse there is no way to stop it sliding into the ocean. We would suffer centuries of encroaching shorelines. The climate change we started would proceed out of our control.

If ice sheets can melt significantly this century, then Hansen’s long-term warming has near-term policy implications. The tragedy we have set in motion can still be prevented, if we get the Earth to stop accumulating heat before slow feedbacks can kick in. To do so we must target the greatest, fastest-growing, and longest-lived climate driver: CO2.

Under business as usual, we are heading for up to 1,000 ppm by 2100, or nearly two doublings (and that’s not including possible carbon feedbacks). This would surely be an unimaginable catastrophe on any timescale. Even the mitigation scenarios governments are quarreling over are based on IPCC assessments now several years out of date. The lowest CO2 target being considered is 450 ppm, which Hansen concluded would eventually melt all ice on the planet, raising sea level by 75 metres. The Earth has not been ice-free since around the time our distant ancestors split off from monkeys.

Instead of stepping on or easing off the accelerator, we need to be slamming on the brakes. We must not only slow the rise of CO2 in the atmosphere, but reverse it. We must reduce CO2 from 390 to 350 ppm as soon as possible. That should stop the planet’s accumulation of heat. Stabilizing the CO2 level will require rapidly reducing CO2 emissions until nature can absorb carbon faster than we emit it – in practical terms, cutting emissions to near zero.

The only realistic way of getting back to 350 ppm is leaving most of the remaining fossil fuels in the ground. We must:

1) phase out coal by 2030. It is not enough to slow down coal-burning by converting it to liquid fuels, because CO2 stays in the atmosphere for a very long time. The fundamental problem is with the coal being burned at all.

2) not burn tar sands or oil shale. Their reserves are virtually untapped but thought to contain even more carbon than coal. Canada cannot keep burning them.

3) not burn the last drops of oil and gas if their reserves are on the high side. If it turns out we have already used about half, then we can safely burn the rest.

4) turn deforestation into reforestation. We’d still be left with the gargantuan task of removing CO2 from the atmosphere. Nature can absorb some carbon, but it has limits.
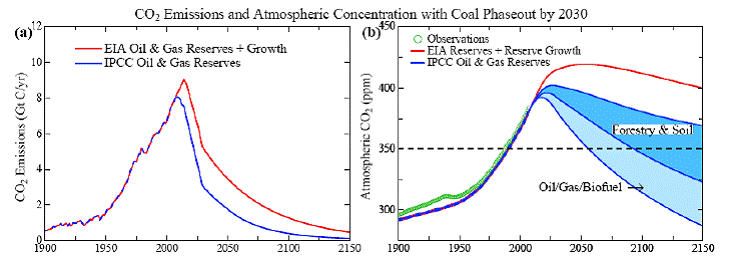
CO2 Emissions and Atmospheric Concentration with Coal Phaseout by 2030

It won’t be easy, but with these actions CO2 could peak around 400 ppm as early as 2025 and return to 350 ppm by century’s end. I believe we can achieve this; it’s primarily a question of political will. But our window of opportunity is rapidly slamming shut. Even one more decade of business as usual, and CO2 can be expected to remain in the danger zone for a very long time.

I should point out estimating a CO2 target from paleoclimate is fraught with uncertainties. I’ve had to simplify for this short article. I explain in more detail on Skeptical Science, or you can read Hansen’s paper free here. If there is one lesson recent climate research should teach us, it is that it’s a mistake to call uncertainty our friend. Arguably the most important aspect Hansen ignores, carbon feedbacks, is likely to make things even worse. There is more than enough reason to heed Hansen’s warning.

Right now we stand at an intersection. What we do in this decade is crucial. If we choose one path, by the end of the decade the world could be well on its way to phasing out coal. If we choose the other, we face an uncertain future in which the only certainty is a continually shifting climate. I’ll leave the final word to Hansen et al, whose concluding statements were pretty strongly worded coming from a dense, technical, peer-reviewed paper:

Present policies, with continued construction of coal-fired power plants without CO2 capture, suggest that decision-makers do not appreciate the gravity of the situation. We must begin to move now toward the era beyond fossil fuels. […] The most difficult task, phase-out over the next 20-25 years of coal use that does not capture CO2, is Herculean, yet feasible when compared with the efforts that went into World War II. The stakes, for all life on the planet, surpass those of any previous crisis. The greatest danger is continued ignorance and denial, which could make tragic consequences unavoidable.

Editor's Note: Many thanks to James who wrote this blog post which is also the Basic Rebuttal to the argument "It's not urgent" (if you ever encounter this argument, just point people to http://sks.to/urgent ). James originally wrote a much longer blog post but I asked him to shorten it (the longer version now acts as the Advanced Rebuttal). So he patiently rewrote a much shorter version which I asked to shorten again (that version now acts as the Intermediate Rebuttal). In this final version, James informed me, "I cannae shorten it no more, captain!"

0 0

Printable Version  |  Link to this page

Comments

Prev  1  2  3  Next

Comments 51 to 100 out of 111:

  1. Fred Staples - "I can only repeat that there is no sign of any relationship to the increase in CO2 until the late 70's, by which time the CO2 concentration had increased from 280 to 350 ppm." Please take a look at CO2 is not the only driver, as well as Temp record is unreliable. You might also want to take a look at one of the UHI threads - use the Search box. CO2 has become the dominant forcing, but is still by no means the only one - nobody claims that except to make a strawman argument. As to the temperature record, we have enough data to make some very accurate measures of the temperature anomalies. And all of the measures (multiple land and satellite) agree to a rather astonishing degree. There's no justification for claiming the temperature record is unreliable.
    0 0
  2. Fred @ 49 I just can't let that go unchallenged Fred. 1) Measuring temperature in a plant environment and measuring temperature at an official meteorological station are completely different animals, not to mention the satellite data that is available. 2) Understanding cause and effect comes from studying the paleo-record and actual observations over long periods of time. Sure there is plenty we don't know. Conversely there is a lot we do know and we do know what those cause and effects are and every known attribute is taken into account, natural and anthropogenic. 3) The relationship of CO2 has been known since the mid 1800's and the physics is well known. 4) The reason for a slight decline in global average temps from the 1940s to 1970s was due to sulfate aerosols which are extremely short lived in the atmosphere because they are solid particles that get rained out. What changed was the regulation of sulfate emissions during the 70's. If you will look at the at the same temp trend for the southern hemisphere where massive industrialization and sulfate emissions were very low, they did not experience the slight cooling. 5) As for a coming ice age it was a media event. It was no where a consensus in the scientific literature. The over whelming published science was suggesting warming. 6) What do you mean "mid troposphere" where the CO2 is supposed to be? CO2 is an extremely well mixed gas in the atmosphere. Its not all contained in the mid troposphere nor does the UAH satellite measure it. 7) As for the temp difference of the mid troposphere and the surface, that is to be expected. What do you think affects us most, mid troposphere temps or surface temps where we live?
    0 0
  3. Hansen and Sato produced a brilliant Paper of research and scholarship deserving of far greater attention and the jangling of alarm bells. James Wight, through a lot of hard work has produced elegant summaries of that work in easy to understand language which should ensure that the Hansen Paper is more widely read and studied. The James Wight article is presented as a rebuttal of “Its not urgent” and there is no doubt it achieves this with its warnings of the perils associated with BUA, perils which I have warned against for years only to be ridiculed. In my view this article is a sound rebuttal of the linked concepts of “450ppm” and “less than 2C warming”. Politicians may love them but if pursued, they will prove lethal. Our problem is that emitters with vested interests (about 1,000 companies in Australia) will continue to resist moves to reduce carbon emissions, no matter what climate scientists tell us are the consequences. What they tell us is that if CO2 pollution persist at 450ppm or more for a prolonged period, result in melting of the WAIS and GIS with consequential SL rise of >2m by 2100, accelerating thereafter. The article goes further than Hansen and Sato in that it specifies action to reduce emissions. That process will prove very lengthy process because of the residence period of CO2 - unless we develop technology to extract it from the atmosphere and then use it for something useful like making oil for fertilizer and petro-chemical production. However, fossil oil is unlikely to remain a source of vehicle pollution beyond 2050 since Peak Oil was reached ~ 2008. The effect of Peak Oil is that thereafter the amount of oil extracted diminishes while demand for oil based fuels increases. The result: rapidly escalating prices putting the use of those fuels out of reach of ordinary consumers, possibly as soon as 2020 when electric vehicles will be de rigueur. Gas may become more widely used as a transitional fuel but it too is a finite commodity. Now don’t get me wrong. I fully support and in 2008 predicted/called for Australian coal to be phased out by 2030 (http://onlineopinion.com.au/documents/articles/coal.pdf) and I still expect that to happen. Even if other countries emulate our efforts, will that ensure that 450ppm is not exceeded by 2050 and double that by 2100? My critics (I have many) tell me coal is our mainstay, as it is in China, India, the USA and many other countries and there is no choice but to continue its use. My response is that Australia is blessed with the hottest, shallowest and most accessible hot granite in the world. Heat mining is well understood and underway and has proven capacity to meet Australia’s predicted needs for base load power for centuries to come. The world will be spurred to action when the first clear signs of impending catastrophe are so evident that they can not be ignored but not my stupid policies such as those advocated by the Opposition and climate change deniers – or by government targets of reducing emissions by 5% below 2000 levels by 2020.
    0 0
    Moderator Response: I hope that peak oil will wake us up, but I fear the response is more likely to be burning tar sands and/or liquefying coal. A good argument has been made (Zero Carbon Australia 2020) that Australia's energy needs can be met by 100% renewable energy; we just need to convince our politicians of that. - James
  4. @49 Fred Staples ".... can only repeat that there is no sign of any relationship to the increase in CO2 until the late 70's, by which time the CO2 concentration had increased from 280 to 350 ppm. (Climate scientists at that time thought we were heading for another ice age)." Any relationship?? The only measure you refer to is average global temperature. There is no logical or physical reason why a system as large and complex as the earth's atmosphere, land and oceans should show signs of a particular trend, first and worst, in the average atmospheric temperature. If you leave average global temperature aside, we could choose an assortment of other indicators. Mass and extent changes in land terminating glaciers, margin of ice around Antarctica, nighttime minimum temperatures, winter minimum temperatures, ocean temperature and several other items. (Sorry - on checking I've done something nasty to my list of references, but there are several on this site anyway.) But in the end that doesn't matter a lot. The evidence linking CO2 emissions and adverse temperature change is already in. Arguing about whether there were unnoticed signs 60 or 80 or 100 years ago is for scientists interested in excruciating detail. For living in the world, we have more than enough evidence to work with.
    0 0
  5. Fred S, That's quite a set of statements. You seem to be denying just about everything. I suggest doing some research on these questions; there's a lot you can learn. If nothing else, it would help you understand what's going on so you could ask better questions. To take just a few points: "The best we can do is to monitor changes at varying points across the globe, at more or less regular times, day and night..." Yes, lots of places; at lots of times, more or less. How, exactly, is that different from determining the global average temperature? "To relate the variations in this data to cause and effect is impossible" In a word, no. Of course, the relevant variations are not the day-to-day changes you may be describing. But cause and effect is clear: the global temperature warms when there is more heat coming in than going out. "I do not know why the medieval warm period happened. I have no idea why the globe then descended into the little ice age... " There are indeed folks who know quite a lot about these things. So the meaning of this statement is unclear. I do not know how (other than in general terms) a nuclear power plant works; does that mean I cannot use the resulting power? "no sign of any relationship to the increase in CO2 until the late 70's, by which time the CO2 concentration had increased from 280 to 350 ppm." CO2 forcing is nonlinear; proportional to the natural log of the ratio of CO2 at any time to the pre-industrial level (280 ppm). Ln(1)=0; at 350ppm, ln(1.25)=0.223. At 380ppm, ln(1.36)=0.305. So in that last 30ppm (its a mere 9% increase from 350 to 380), forcing increases by more than one third. "responsible for monitoring temperature and humidity in a nuclear power plant. The idea that it could be done with any degree of accuracy ... was, believe me, absurd." That is the biggest stunner of them all. Are you telling me that the safety inspectors at nuclear power plants cannot make accurate measurements? I'm choking on my donut, turning off the lights and moving to Shelbyville right now.
    0 0
  6. I'm afraid I must agree with James' reply to Agnostic above. When faced with an entire loss of their way of life, people will make choices they believe necessary to ensure that way of life. In a case of art predicting life, Asimov touched on this in Nightfall. Faced with the loss of daylight on a planet with multiple suns, people resorted to burning their entire civilization to avoid facing the dark. Faced with peak oil, mankind now is tasked with finding viable energy alternatives or faces having to retool society at large. At least initially, the tar sands will go into full production. Until enough permafrost melts, initiating the long-feared clathrate release. Then and only then will enough take AGW seriously. Pray that then there will be yet time enough. The Yooper
    0 0
  7. muoncounter @45, While Tamino can prove almost anything to his own satisfaction there are many who disagree with his analyses. Tamino is very careful to choose 1975 as his start date because things might look a little different if he chose 1957 instead. I believe this is called "cherry picking" when your opponents do it. Here is my first attempt to post an image as a "live link". If it fails you should still be able to see the URL as a text string:
    0 0
    Moderator Response: [DB] Remember to use the img width="450" src= tag when posting images. Also, it is considered "good form" to also provide a link to the source image for those who want to see it larger than can be shown here. Example: Source Image
  8. Canadian oil sands may well be exploited initially and sell where there is no alternative. But who will buy their product at >$5/litre ($20/gallon), a price dictated by increasing demand for a decreasing product when electricity will be available to provide the same energy at a price equivalent of $2-$3/litre? We tend to judge the future on the basis of what exists at present, assuming technology remains unchanged but it changes all the time. Five years ago, who would have imagined the use of energy efficient LED’s? Daniel @ 56 In 5 years time the big revolution may have developed – production of relatively cheap, light, high density batteries able to recharge rapidly many thousands of times and hold sufficient energy to meet household and our transport needs. We may well have developed super-efficient photovoltaics which can be sprayed on surfaces, generating all the energy needs of buildings, even entire cities. The impact of such developments would make use of fossil fuels archaic globally. It is not beyond the wit of humans to make such break-throughs. The problem is our ability to do so in time to avoid the worst of global warming but it is said that desperation is the mother of invention.
    0 0
  9. Moderator : "I hope that peak oil will wake us up, but I fear the response is more likely to be burning tar sands and/or liquefying coal" I would stress again that known facts do not support this fear. Tar sands will never exceed a few Mbl/d and are quite unable to compensate for losses of a few Mbl/d every year that should follow conventional peal oil (remember that N years of reserves really means 1/N loss in production each year after the peak). Concerning CTL, there hasn't been any massive CTL plant built during the 2008 burst of oil price, for a simple reason : coal has also spiked, and so have all commodities. CTL is not cheap, and won't be cheaper than oil, because oil prices impact all industrial processes (including extraction of oil itself). That's why peak oil occurs, despite high prices make unconventional resources more profitable : because this is offset by the increase of extraction costs and because demand is also lower. Nobody will ever build expensive plants for an expensive fuel that nobody will buy. "BAU" is just a silly idea, "B" will never be "AU" after the peak of conventional resources.
    0 0
    Moderator Response: [Dikran Marsupial] italics fixed
  10. agnostic : look at that : http://www.thedailyshow.com/watch/wed-june-16-2010/an-energy-independent-future
    0 0
  11. Fred Staples @49: "Even if you accept, 47, the AGW theory, you must accept that not much happened while CO2 increased from 280 to 350ppm." Fred, you are not taking into consideration the time delay between the intial release of CO2 and the full temperature rise. There is also the issue of aerosols diminishing somewhat in our atmosphere at about that time period.
    0 0
  12. gallopingcamel - Tamino is very aware of pre-1975 temperature records. I would recommend looking at his article on Anthropogenic Global Cooling: Here he discusses the sulfate aerosols in mid-century that caused a climate cooling - said aerosols being cleaned up in the early 70's due to pollution controls. Again, accounting for the forcings on the climate, and using actual physics, it's possible to clearly identify the trend in average temperatures caused by increasing greenhouse gases.
    0 0
  13. 2 questions, KR : 1) was there a sudden burst of sulphate aerosols in the 40's ? 2) is the PDO index sensitive to sulfate aerosols, according to actual physics ? ( -Broken image deleted- ) (source : http://jisao.washington.edu/pdo/)
    0 0
    Moderator Response: [DB] The PHP here doesn't take kindly to TIF's; PNG or GIF is preferred. Also, your comment is too far off-topic of the post; please separate your questions and post them on the appropriate post and then place a comment here linking back to them. KR will see them there.
  14. @ Gilles #63 Could you add a little context to that post?
    0 0
  15. Gilles - Reply to your first question is on It's aerosols. I'm not certain what your second question actually is (as the image did not come through, and it lacked context). Perhaps you could post it on either an aerosol or PDO thread?
    0 0
  16. James perhaps you worry too much under, re "Under business as usual, we are heading for up to 1,000 ppm by 2100, or nearly two doublings (and that's not including possible carbon feedbacks). This would surely be an unimaginable catastrophe on any timescale…The lowest CO2 target being considered is 450 ppm, which Hansen concluded would eventually melt all ice on the planet, raising sea level by 75 metres."

    This appears to be extremely alarming. However, Hansen's predictions have not always been proved to be close to reality as I describe below.

    The global warming models presented by Hansen (2006) are shown in Figure 1. I have added the GISS Land Ocean Temperature Index (LOTI) data up to January 2011 and I have also added the Mauna Loa CO2 data.

    Figure 1: Scenarios A, B and C Compared with Measured GISS Land-Ocean Temperature Index (after Hansen, 2006)

    The blue line in Figure 1 denotes the GISS LOTI data and the black line is the Mauna Loa CO2 data. Scenarios A, B and C describe various CO2 emission outcomes presented by Hansen (2006).

    Scenario A is "on the high side of reality" with an exponential increase in emissions. Scenario C has "a drastic curtailment of emissions", with no increase in emissions after 2000. Scenario B is described as "most plausible" which is expected to be closest to reality.

    Nevertheless, it is interesting to note that in his testimony to US Congress, Hansen (1988) describes Scenario A as "business as usual." This somewhat contradicts "on the high side of reality" in Hansen (2006) in which Scenario B is described as "most plausible." Don't we all have 20-20 vision with hindsight?

    It is evident from Figure 1 that CO2 emissions are following Hansen's Scenario A temperatures (forcings) whilst real-world temperatures are following the "zero increase in emissions" Scenario C. What temperature do you get by doubling CO2? It would appear that we would get a lot less than predicted by Hansen (2006).

    James perhaps you worry too much. "Facts are chiels that winnae ding." The real-world currently does not seem inclined to follow Hansen's (2006) predictions.

    Notwithstanding the above, it should be noted that time period for the comparison of actual temperature/CO2 measurements with those predicted is still relatively short. Hansen (2006) suggests that we could expect reasonable results for distinction between the scenarios and useful comparison with the real world by 2015.

    0 0
    Moderator Response: Responses to this comment are better placed on the thread "Hansen’s 1988 prediction was wrong." Best to read the Advanced tabbed page there first, to learn why it makes no sense to write "It is evident from Figure 1 that CO2 emissions are following Hansen's Scenario A temperatures (forcings)."
  17. Angus @66, The moderator has directed you to go read where the misinformation that you are perpetuating here has been addressed. And the format of your post looks like portions of it may have been cut and pasted from somewhere else. Might I ask where? To stay on topic, research by James Annan and Hargreaves have demonstrated that the 95% confidence interval for climate sensitivity for doubling CO2 is +2 to +4 K, with a most likely value of +3 K. And we will easily double CO2 come 2100 under BAU. Hansen and others suggest that long-term climate sensitivity may be even higher than the +3 K estimate. But I suspect that you and other 'skeptics' believe that you know better than the overwhelming body of science....
    0 0
    Moderator Response: Responses to this comment also need to be on that thread "Hansen’s 1988 prediction was wrong." I encourage everyone responding to then post a comment here, directing readers to your comment there. It's fine to post responses on this thread as long as they are attempting to pull the conversation back on the topic of this thread. (As Albatross has done here.)
  18. Gilles - 34 "Chinese and Indians don't get it" Both of the countries mentioned are investing very heavily in renewables. The point you seem unwilling to get is that renewable energy is the economic driver of this century. The policy in the US of letting other countries take the lead is dooming the US to losing its status as the dominant power in the world. And the saddest thing is it really, truly, isn't that hard to shift policy towards innovation and leadership. Even with our perverse governmental approach towards climate change (which continues to funnel billions into the system that are causing the problem (fossil fuel industries, transportation, sub-standard (from an energy efficiency point of view (see Energy Star for a list of standards that covers 20% of what is necessary)) AND starving the innovators of the funds necessary to develop, install and profit from renewable energy technologies) some innovation still survives. If the US wants to have economic dominance in the 21st century, it must lead in renewable fuels. There is no way out of that. And so far, the government has chosen to deal with other issues: wars in far off lands, healthcare, budget deficits and a host of other short term, minor concerns, while the world continues to heat up.
    0 0
  19. Regarding model predictions, I think this is what the "skeptics" is trying to distract people from: [Source here] Time to start applying the breaks.
    0 0
  20. The temperature record may not be accurate, but it is not necessarily rubbish, moderator, 49. The following is a fair summary of recent global temperatures. 4,000 years ago to AD 900: Global cooling begins. The Arctic Ocean freezes over, mountain glaciers form once more in the Rocky Mountains, in Norway and in the Alps. The Black Sea freezes over several times, and ice forms on the Nile in Egypt. Northern Europe gets a lot wetter, and the marshes develop again in previously dry areas. The sea level drops to approximately its present level. The temperatures on the surface of the Earth are about 0.5-1 degree cooler than at present. The causes of this period of cooling are unknown. AD 1000 to 1500: This period has quick, but uneven, warming of the climate of the Northern Hemisphere. The North Atlantic becomes ice-free and Norse exploration as far as North America takes place. The Norse colonies in Greenland even export crop surpluses to Scandinavia. Wine grapes grow in southern Britain. The temperatures are from 3-8 degrees warmer than currently. The period lasts only a brief 500 years. By the year 1500, it has vanished. The Earth experiences as much warming between the 11th and the 13th century as is now predicted by global-warming scientists for the next century. The causes of this period of warming are unknown. 1430 to 1880: This is a period of the fast but uneven cooling of Northern Hemisphere climates. Norwegian glaciers advance to their most distant extension in post-glacial times. The northern forests disappear, to be replaced with tundra. Severe winters characterize a lot of Europe and North America. The channels and rivers get colder, the snows get heavy, and the summers cool and short. The temperatures on the surface of the world are about 0.5-1.5 degrees cooler than present. In the United States, 1816 is known as the "year with no summer". Snow falls in New England in June. The widespread failure of crops and deaths due to hypothermia are common. The causes of this period of cooling are unknown. 1880 to 1940: A period of warming. The mountain glaciers recede and the ice in the Arctic Ocean begins to melt again. The causes of this period of warming are unknown. 1940 to 1977: Cooling period. The temperatures are cooler than currently. Mountain glaciers recede, and some begin to advance. The tabloids (and climate science) inform us of widespread catastrophes due to the "New Glaciation". The causes of this period of cooling are unknown. 1977 to present: Warming period. The summer of 2003 is said to be the warmest one since the Middle Ages. The tabloids (and this blog) notify us of widespread catastrophes due to "global warming". The causes of warming are discovered - humanity and its carbon-dioxide-generating fossil-fuel use and deforestation. We can say with certainty that CO2 could have had nothing to do with any of these episodes, except, perhaps, the last. The association with rising CO2 since 1977 might, of course, be a classic case of the correlation-causation statistical fallacy: A is happening, B is happening, therefore A causes B. You extend the fallacy by suggesting that if C, D, E and F are also happening, these are also caused by A if we cannot provide an alternative explanation. Einstein said, quite rightly, that "10,000 observations could confirm a theory, it only takes one to refute it." At RC you will find that the crucial "fingerprint" of AGW is the simultaneous warming of the troposphere and cooling of the stratosphere. Since the UAH data shows no warming of the mid-troposhere since 1979 (the only significant warming period) this data alone would be sufficient to destroy the CO2 theory. Gavin Schmidts (of RC fame) response to me on this point is interesting: [Response: The MT (mid-troposhere) data has a very significant contribution from the stratosphere (which is cooling) and so is not expected to be rising very substantially. This is the whole reason why MSU-LT and the Fu and Johnson approaches were developed. - gavin] So, assuming that the UAH luminaries have not understood this argument, and are consequently publishing misleading data, is the stratosphere really cooling?. You can see the data in the Hadley centre radio-sonde records for the lower stratosphere. From 1958 to 1974 there was a fall of 1.0 degree centigrade, with a major volcanic eruption in 1964. Thereafter there are three distinct periods of level temperatures separated by the two volcanic eruptions marked on the chart. From 1974 to 1983, the beginning of the troposheric warming period, stratosheric temeratures did not fall. The El Chicon eruption was accomapnied by a step fall of about half a degree. Temperatures did not fall again until 1993, when a further drop of half a degree accompanied the Pintaubo eruption. Thereafte the temperatures have remained constant for 17 years. The overall fall from 1974 was (from the Hadley charts), about 1 degree, but in the years immediately following the volcanic eruptions temperatures rose by about 1 degree. It is a very big stretch to suggest that these step-wise stratospheric coolings (accompanied, as they are, by a reduction in ozone) explain the absence of warming in the troposhere. Nevertheless, it is on that stretch that AGW theory depends. As to "why isn't the rising CO2 having any effect", we would first have to ask why it should, which is where the burden of proof must lie. I have collected six different explanations from RC, of which only one is even plausible. We could perhaps discuss these in another post.
    0 0
  21. Fred Staples - "1816 is known as the "year with no summer". Snow falls in New England in June. The widespread failure of crops and deaths due to hypothermia are common. The causes of this period of cooling are unknown." (Emphasis added) That would be, to put it mildly, incorrect. There was a combination of a serious low in solar activity tied with multiple high end volcanic eruptions, including Mount Tambora in 1815, which injected volcanic dust into the stratosphere (aerosol forcing). Note the Northern European temperatures, relative to 1971-2000: This was a severe event, but limited to about a years duration, with temperature changes of about -3C in the worst areas. Makes you wonder what +2C temperatures persisting for decades or centuries will do to us, eh? As to the rest of your post - I suggest you look at (and comment upon) the tropospheric hot spot thread. Your claims on that topic are not supported. As to CO2 and your claims that it doesn't cause warming, I suggest you look at one of the (many) CO2 threads and comment appropriately.
    0 0
  22. A follow-up on my previous post - global temperature decrease in the year with out summer was 0.4-0.7°C, with rather larger local effects in the NorthEastern US and Northern Europe. Again, compare this one or two year event - that trashed agriculture in the Northern Hemisphere - with a 2°C rise that persists for centuries. And then try to convince anyone that it's not going to be a problem for us...
    0 0
  23. Fred: The association with rising CO2 since 1977 might, of course, be a classic case of the correlation-causation statistical fallacy: A is happening, B is happening, therefore A causes B. Except the physics of CO2 is well known and tested. Joseph Fourier demonstrated the greenhouse effect in 1827. John Tyndall discovered that CO2, water vapor and NH4 were greenhouse gases while O2 and N2 were not in 1858. Svante Arrhenius calculated that doubling CO2 would warm the Earth by 4-6 deg C in 1896. The over whelming majority of climate scientists today agree that a doubling of CO2 will cause a warming of about 3 to 3.5 deg. C. I think your correlation-causation statistical fallacy is wishful thinking on your part.
    0 0
  24. Fred Staples, you wrote: "1880 to 1940: A period of warming. The mountain glaciers recede and the ice in the Arctic Ocean begins to melt again. The causes of this period of warming are unknown." Your claim of unknown cause is false, as explained in the Argument "It warmed before 1940 when CO2 was low."
    0 0
  25. Fred @ 70... Wow. You've cataloged quite a body of misinformation there. I take note that none of what you've stated is substantiated by research. One thing I always appreciate here at SkS is the fact that everyone (most) people link to actual peer reviewed literature to back up what they say. Anything less is hand waving.
    0 0
  26. Fred says @70, "Since the UAH data shows no warming of the mid-troposhere since 1979 (the only significant warming period) this data alone would be sufficient to destroy the CO2 theory." SkS Readers, this statement is demonstrably false. Consider these data from RSS derived from satellites for the mid troposphere (TMT): Also, consider these data from the GUAN: From NCDC: "[radiosonde] Data collected and averaged between the 850–300 mb levels (approximately 5,000 to 30,000 feet above the surface) indicate that 1958–2010 global temperature trends in the middle troposphere are similar to trends in surface temperature; 0.13°C/decade (0.23°F/decade) for surface and 0.16°C/decade (0.29°F/decade) for mid-troposphere. Since 1976, mid-troposphere temperatures have increased at a rate of 0.18°C/decade (0.32°F/decade). For 2010, global mid-troposphere temperatures were 0.78°C (1.40°F) above the 1971–2000 mean—the warmest on record."
    0 0
  27. I will respond to all the comments, but I should first say something to muoncounter (55) so that he can sleep more soundly. I was writing about the measurement of ambient temperatures which related to working conditions, not core temperatures which related to nuclear safety. The problem was that, with relatively few measurement sites, and measurements which were neither continuous nor simultaneous, it was impossible to know the average temperature of the building. All that we could measure was trends at the measurement sites, and even these would be distorted by ventilation changes, doors opening and closing, etc. The parallels to global temperatures are obvious, which is why I made the point. However, think about the core temperatures, which are seriously important. We had (in my day) fixed points inside the core recording temperatures continuously. The maximum permitted core output depended on the average temperature, and the safety of the reactor depended on the highest temperature of an individual fuel element. Both these temperatures were strictly limited, but, by definition, not measured. Inevitably, we had to use a combination of statistics, probability, and sound theory backed up by laboratory based measurements. I hope that helps, but I am not sure that it will.
    0 0
    Moderator Response: Respond to each point on the appropriate thread as the responders have pointed you to. A general thread such as this one is okay for starting conversations, but getting into more detail must be done on more relevantly narrow threads. Feel free to post comments here, simply linking to your responses on the relevant, narrow threads.
  28. Fred Staples, you wrote: "1940 to 1977: Cooling period. The temperatures are cooler than currently. Mountain glaciers recede, and some begin to advance. The tabloids (and climate science) inform us of widespread catastrophes due to the 'New Glaciation'. The causes of this period of cooling are unknown." Your claim of unknown cause is false, as explained in the Argument "It cooled mid-century."
    0 0
  29. Also false, Fred, is your claim "The tabloids (and climate science) inform us of widespread catastrophes due to the 'New Glaciation.'" See the Argument "Ice age predicted in the 70s" about climate science predictions. What the tabloids published is entirely irrelevant.
    0 0
  30. There are times when I wonder if Gilles and Fred intend making a genuine contribution to the debate – in this case the need to limit atmospheric CO2 concentration to 350ppm by 2100 and how this might be done – or, in the tradition of the best denialists, simply make misleading, unsubstantiated, or untrue statements? If the latter, it seems so pointless, particularly on SkS.
    0 0
  31. Fred, I think you are wrong about comparing temperatures of different areas of a plant to the planet. For measuring the average temperature of the planet, NASA/GISS uses a grid system consisting of some 8,000 grid boxes of which there are many measuring sites within each. Regions do vary greatly but that is what gives the global average. What happens in one region can affect another. But in your plant setting the average temperature of the building is not an issue as there are probably many areas with separate thermostats that are set and controlled specifically for those areas. They do not affect the rest of the plant. As for you reactor temperature that is very important to control. If it starts getting too high that is a serious problem. The Earth as well has critical temperatures that seriously affect the many environments.
    0 0
  32. Agnostic - google for their "contributions" over at realclimate. See what you think (same old, same old despite helpful responses obviously ignored). Perhaps comments policy needs an extra clause: claims in responses must be substantiated by data and/or papers.
    0 0
    Moderator Response: [DB] Indeed, some have a knack for saying less with more. As for the comments policy, repetitive unsubstantiated claims can and have gotten deleted in the past; that can also happen in the future. :)
  33. Further to what RickG said. Fred, thought experiment - you could set up temperature monitoring network over say a small region, measure for a couple of years to get some averages, then start comparing anomaly temperatures from these stations to see how well they are spatially correlated. If the temperature anomalies are highly spatially correlated, then could reduce no. of station. If not, then you need to increase network to get better estimate of region temperature. Seem like a reasonable experiment to you? You would accept its results?
    0 0
  34. Fred S, Thanks for the reassurance; I guess nuclear plants are safe after all. However, on a more relevant matter for this thread: I note that your fair summary is clipped verbatim from 'The global warming scam'. Google "4,000 years ago to AD 900: Global cooling begins" and you get the whole thing, kicking around the denier echo-chamber since 2005 or so. As you've seen from the response, that's not a much of a source. If you care about your own credibility, please investigate some real science.
    0 0
  35. Fred S @70 etc "At RC you will find that the crucial "fingerprint" of AGW is the simultaneous warming of the troposphere and cooling of the stratosphere. Since the UAH data shows no warming of the mid-troposhere since 1979 (the only significant warming period) this data alone would be sufficient to destroy the CO2 theory. Gavin Schmidts (of RC fame) response to me on this point is interesting: [Response: The MT (mid-troposhere) data has a very significant contribution from the stratosphere (which is cooling) and so is not expected to be rising very substantially. This is the whole reason why MSU-LT and the Fu and Johnson approaches were developed. - gavin] So, assuming that the UAH luminaries have not understood this argument, and are consequently publishing misleading data, is the stratosphere really cooling?." Fred The UAH (and RSS) mid-troposphere products (TMT) are based on using the T2 channel from the satellites. This signal originates primarily form the lower & mid troposphere but around 15% comes from the lower stratosphere where there has been cooling. So the signal recorded by T2 is an underestimate of the tropospheres actual temp change. We know the stratosphere has been cooling based on the T4 channel from the satellites. Virtually all of its signal orginates in the lower stratosphere with minimal contamination from the troposphere. In 1992 Spencer & Christy at UAH created a new temperature product using a mathematical technique that removes the stratospheric influence from T2 (but unfortunately also much of the mid tropospheric signal as well) This is their TLT product. In 2005 RSS added a similar product. All the analyses from RSS show greater trends than UAH. This is believed to be due to several factors, primarily their different handling of the short overlap time between the NOAA-9 and NOAA-10 satellites and differing methods of handling Diurnal Drift. The Mid troposphere data shown by Albatross is the RSS T2 analysis - warmer than UAH T2 but still not compensating for stratospheric biasing. Several teams have looked at other analysis techniques - referred to by Gavin, Vinnikov & Grody and Zou et al. Fu & Johansen's method uses a different technique to extract temps from between the 830hPa to 300hPa levels and remove the stratospheric influence; these show warming throughout the entire troposphere at levels equal to or higher than the TLT products. But their method isn't useful for obtaining local or regional trends. However, NOOA maintain a running analysis using FU et al's technique applied to both the UAH and RSS TMT products here http://www.ncdc.noaa.gov/temp-and-precip/msu This may be the source of Albatross's second graph. Vinnikiv & Grody used a quite different technique again and produced even warmer results 0.20 to 0.26 C/Decade and this is without removing the stratospheric bias. Recently Zou et al have published a newer method for performing the critical intersatellite correlation needed to have an on-going trend over multiple satellites. They report a trend 1979 - 2010 of 0.137 C/Decade for TMT again without removing the stratospheric bias. You can see that here http://www.star.nesdis.noaa.gov/smcd/emb/mscat/mscatmain.htm To these comments: "1880 to 1940: A period of warming. The mountain glaciers recede and the ice in the Arctic Ocean begins to melt again. The causes of this period of warming are unknown." Some possible causes. Low level CO2 warming from the modest increase of CO2 till then. Slightly higher period of Solar activity. Low levels of Volcanic activity. And your transition point of 1940 may more accurately be 1945. Final contributory cause. A change in the nationality (and thus measurement method) of the ships taking the majority of SST measurements during the war years to those immediately after adding a small warming bias during the war years and a small cooling bias afterwards. "1940 to 1977: Cooling period. The temperatures are cooler than currently. Mountain glaciers recede, and some begin to advance. The tabloids (and climate science) inform us of widespread catastrophes due to the "New Glaciation". The causes of this period of cooling are unknown." Causes. Increased GH Gases. AGW was occurring then as evidenced by the fact that night time temps do show warming over that period. But this was masked by cooling effects. Increased volcanic activity. And much higher aerosol levels due to the post war boom before we started introducing Clean-Air Acts in the 60's/70's. All those Aerosols masking the warming. After 1970, the air gets cleaned up, GH gas warming intensifies and temps (and heat content in the ocean) start to climb, now only interspersed by two major eruptions - El Chinchon & Pinatubo. And Solar output is a little lower so warming really is greater. Then the 2000's 'flattening'. Particularly if we use the El Nino of 1998 as a bad reference point. What has happened this decade? A long and deep Solar Minimum at the end of the decade. Increasing dirty industrialisation in China, India etc. Increased Contrails from the growth of air-travel. So more masking aerosols at the same time as reduced solar output. But even then it was only a levelling off, not a real drop. Consider. 1998 and 2010 are roughly equal for average temp depending on which source you use. 1998 was one of the biggest El Nino's, an event that warms the atmosphere. 2010 was (still is) a huge La Nina, an event that cools the atmosphere. So 1998 + Warming El Nino matched by 2010 and cooling La Nina and milder Sun and more Aerosols. Looks like something else in 2010 is holding the temps up against these other forces. Could it be...GH Gases? (Moderator. I am on a @&%!ing lousy Internet Connection at present. If possible, grovel, beg, could you insert some links to SkS arguments related to the points I have just made)
    0 0
    Moderator Response: [DB] Added links.
  36. scaddenp @83 Which is exactly what Hansen et al did when developing the methodology for the GISS temperature series. Details here http://pubs.giss.nasa.gov/cgi-bin/abstract.cgi?id=ha00700d Abstract of Hansen & Lebedeff 1987 "We analyze surface air temperature data from available meteorological stations with principal focus on the period 1880-1985. The temperature changes at mid- and high latitude stations separated by less than 1000 km are shown to be highly correlated; at low latitudes the correlation falls off more rapidly with distance for nearby stations. We combine the station data in a way which is designed to provide accurate long-term variations. Error estimates are based in part on studies of how accurately the actual station distributions are able to reproduce temperature change in a global data set produced by a three-dimensional general circulation model with realistic variability. We find that meaningful global temperature change can be obtained for the past century, despite the fact that the meteorological stations are confined mainly to continental and island locations. The results indicate a global warming of about 0.5-0.7°C in the past century, with warming of similar magnitude in both hemispheres; the northern hemisphere result is similar to that found by several other investigators. A strong warming trend between 1965 and 1980 raised the global mean temperature in 1980 and 1981 to the highest level in the period of instrumental records. The warm period in recent years differs qualitatively from the earlier warm period centered around 1940; the earlier warming was focused at high northern latitudes, while the recent warming is more global. We present selected graphs and maps of the temperature change in each of the eight latitude zones. A computer tape of the derived regional and global temperature changes is available from the authors" 'Computer tape'! How times have changed.
    0 0
  37. Glenn Tamblyn @85 My Oops. Albatross's second graph is radiosonde data not Sat's. Rest of my comments still apply.
    0 0
  38. Glenn, I am very well aware of that. I was waiting to see whether Fred agreed that this was the proper way to experimental verify temperature spatial correlation or not. You could add in the analysis of Jones and Kelly too and probably many others.
    0 0
  39. "Both of the countries mentioned are investing very heavily in renewables. The point you seem unwilling to get is that renewable energy is the economic driver of this century." so they're also investing very very heavily in fossil fuels, aren't they ? Renewable energy as a driver of growth ? where is the scientific evidence of that ? BTW you seem to think that economic growth is a good thing ? so not doing an economic growth that we could achieve is a bad thing ? comments on aerosols on the relevant post Agnostic : "There are times when I wonder if Gilles and Fred intend making a genuine contribution to the debate – in this case the need to limit atmospheric CO2 concentration to 350ppm by 2100 and how this might be done" If this is the ONLY goal, whatever it costs , then solution is simple : stop all fossil fuels production at once, bomb all oil wells, forbid all gas extraction, close all coal mines. If this is not acceptable for you, then there must be another criterion. Can you be a little more explicit about "the other thing" ? 350 ppm under which condition? what is acceptable, and what isn't ?
    0 0
  40. concerning volcanic activity, I'm puzzled : does a major eruption modify a 30 years slope ? what is the characteristic time of its influence ?
    0 0
    Moderator Response: [DB] For more on that topic, go to the Two-attempts-to-blame-global-warming-on-volcanoes thread for info & related discussion. Thanks!
  41. In addition to all the other responses to Fred Staples, I’d add the following in response to Fred’s extraordinary claim that the medieval warming was equivalent to the warming expected this century – ie. several degrees. Even the reconstructions held up by contrarians only show the Medieval Warm Period as a few tenths of a degree warmer than the mid-20th century, or similar to today. Where is the evidence that the Medieval Warm Period was several degrees warmer?
    0 0
    Moderator Response: [DB] Indeed, the Martín-Chivelet et al 2010 reconstruction done in Europe states:

    "Remarkably, the presented records allow direct comparison of recent warming with former warm intervals such as the Roman or the Medieval periods. That comparison reveals the 20th Century as the time with highest surface temperatures of the last 4000 years for the studied area."

  42. For those who think that without fossil fuels our growth based "life style" will be doomed; It's worth looking at the current "Great Stagnation" .v. "Great Divergence" debate (e.g. see here or here and all over the place). The relevance is that part of Tyler Cowen's argument in The Great Stagnation is that we've basically exhausted the growth gains from technologies like fossil fuels - and other 'low hanging fruit'. That's not to say that they're not required to preserve the status-quo; but they won't provide improvements in life-styles in the future... at least for the developed countries. There's lots of details on those debates we'll all agree or disagree with... that's the fun of it; but I think the above 'take away' is really worth while. It's not so completely wrong as to be ignorable. Then, of all the possible drivers of future growth (for the technologically advanced nations) - low carbon technology is clearly, clearly, one of the big ones... ... what is surprising is that so many of the American nation are now such cowerds as not to rise to the challenge - even though overcoming that challenge will, more than likely, put them back on the sustained-growth path...
    0 0
  43. Moderator: the post #8 by alan_marshall contains extra html and body tags which affects some browsers such as lynx (although not Mozilla). The specific effect is that all the posts following are unnumbered (probably due to the /html in #8)
    0 0
    Moderator Response: [DB] Fixed, thanks!
  44. Moderator, 77, at the thread entitled "Greenhouse effect and the second law of thermodynamics" I contributed a simple demonstration, 337, (with an isothermal atmosphere) that radiative insulation (the blanket theory of AGW) was quite different from conductive insulation. I added some basic thermodynamics to explain the difference between heat and energy, a source of much confusion in the blog. Very Tall Guy, 329, agreed with my comments and responded with the "higher is colder" theory, complete with a chart. I then attempted to comment as follows (but the thread, sadly, had closed): "The explanation you offer, Very Tall Guy, is the only plausible explanation of the AGW effect. It is the preferred explanation of the founding fathers over at RC, and you can find it in the Rabbet rebuttal of the G and T paper, (immediately following their absurd multi-layer, back-radiation explanation). It begins with the lapse rate, a function of gravity and specific heat, which has nothing to do with radiative effects. Without this lapse rate there would be no possibility of AGW. The argument is that increasing CO2 in the cold, dry, upper atmosphere, impedes outgoing radiation, and moves the effective radiation point to higher (and therefore) colder temperatures. Outgoing radiation is reduced, incoming radiation remains the same, and the whole atmosphere and surface warms up to restore the balance. As your drawing demonstrates, the lapse rate moves to the right". This explanation is plausible, but is it true? Notice that this is a top-of-the atmosphere effect. It is absolutely incompatible with the UAH published results (Global Warming at a Glance) for the mid and lower troposphere. And if the stratosphere is not masking mid-troposphere warming, the AGW explanation of warming over the last 30 years cannot be sustained. Which brings us back to the "upper troposphere warming is masked by stratospheric cooling" argument. The data I quoted, 70, was from the Hadley centre radio-sonde data, not the satellites. I have seen no satellite stratospheric temperatures, but I would welcome a link. I followed the link in 85, and read this: " As the lower atmosphere warms due to an enhanced greenhouse effect, the upper atmosphere is expected to cool as a consequence. The simple way to think about this is that greenhouse gases are trapping heat in the lower atmosphere. Since less heat is released into the upper atmosphere (starting with the stratosphere), it cools" Simple indeed. Those words look sensible, but like "Friday is faster, far, than a fried egg", they are literally meaningless. Heat is not energy. It cannot be trapped or stored. It is, by definition and the second law of thermodynamics, the net transfer of energy between a higher and a lower temperature. Freeman Dyson refused to discuss the matter any further with the Independent's science editor when he made a similar comment. We can use the term "heat transfer" loosely, so long as we know what we mean. I am as ready as the next man to accept that if the facts don't agree with the theories (models), so much the worse for the facts, but there are limits to credibility. Returning to the subject of this thread, China has vast resources of accessible coal, and the US is wedded to transport and air conditioning. They will not be convinced by the story so far "to leave their remaining fossil fuels in the ground".
    0 0
    Moderator Response: No, that thread (2nd law of thermodynamics contradicts greenhouse theory) is not closed. Maybe you were logged out for some reason, or there was a temporary glitch. Try commenting there again. Everybody else, do not reply here; reply over there. Thanks.
  45. As promised, perhaps I can reply to some of the individual comments on my posts.. KR, 51, I agree that there is no significant difference between the trends in all the main records of global temperature anomalies. They all suggest that increasing CO2 did very little until 1979, when it had reached 350ppm. I know how much quality control is required to record accurate temperature measurements. You might like to try it in your own house (not forgetting the loft), and then try the garden. You car temperature gauge will demonstrate the urban heat island effect every time you drive through a town (the M4 into London is very flat, if you want a specific reference). Sea covers 75% of the globe. Do you know how sea temperatures were measured before the recent instrumented projects. Ships with buckets and thermometers. RickG, 52, The Physics of infra-red absorption by CO2 is well known, and calculable both by the wave and particle views of photons. (Radiation, page 252, by Grant W Petty, University of Wisconsin Madison if you do not accept the dual wave /particle theory) Angstrom demonstrated the saturation effect about 100 years ago, when he found that CO2 concentration made little difference to atmospheric warming. Woods demonstrated that back-radiation from an absorbing medium will not warm the interior of a greenhouse. Do you think that 100% CO2 will warm dramatically faster than air? Have a look at this high school experiment http://www.espere.net/Unitedkingdom/water/uk_overview.htm. The application of CO2 to AGW is where the problems begin -trapped heat, warming from back-radiation, little silver bullet photons, dependence on the lapse rate, etc. Many, perhaps most, of the explanations offered on the internet directly violate the second law of thermodynamics.. There were people predicting global warming in the seventies, BH, but they were not taken seriously. CO2 is certainly well mixed, but its absorption is swamped by water vapour in the humid lower atmosphere. It is the CO2 action (and re-action) that takes place in the dry mid and upper troposphere that is said to be responsible for surface warming. Hence the problem with the UAH temperatures. The observed trend difference between the upper and lower air temperatures is absolutely not to be expected. Exactly the opposite is to be expected. The temperature difference itself is due to the lapse rate, as you can see when you drive your car up a hill. Adelady, 54, there were no unnoticed signs (of CO2 impact) 60 or 80 years ago. The point is that there were no signs at all.. 55 Muoncounter. I will accept your views on past temperature movements (pre 1979) if y0u accept that they had nothing to do with increasing CO2 concentrations. 61 Villabolo If you are right, we are going to see some sharp temperature increases as the CO2 emmissions during the western industrial revolution take hold. We can expect to move up the Hansen A line, 66. If you are wrong, temperatures will continue to plod along the Hansen C line, while CO2 move close to the A line. As the CO2 and temperature lines diverge, support for AGW will wane. 76 Albatross, I analysed the HadAT Radio-sonde data myself, two years ago, from 1958 to 2009. The tropospheric lapse rate continues up to about 10 Kms, which corresponds to the HadAT 300/200hPa charts. I wanted to test the significance of the warming (and cooling) in the record, at the 5% level, by calculating the point when change becomes significant in years back from the (then) present. The results were interesting: 11 Kilometers ( 200 hpa) : 51 years (no significant warming) 9 Kilometers (300hpa) : 27 years 1.45 Kilometers (850hPa) : 13 years For significant cooling, (steps, flat periods, and volcanoes included), 29 years at 13.47 kilometers. So, low down, but still well above the surface layer, warming is clear. Higher up it falls away, and is not significant at the top of the troposphere. This is less conclusive than the UAH measurements, but it supports my argument. I will bring these results up to date. Propaganda, 80, is not necessarily false, but it is still propaganda. I seek to do no more than bring some balance to this blog. I will, if anyone is interested, reel off anecdotal evidence on the sceptical side of the argument, but that too, is propaganda. 83 I really dislike thought experiments. Thinking, of course, is welcome. 91 James Wright. I did not claim that (if I did it was a mistake). I do not know the temperature of the medieval warm period (although I have seen the same plots as everyone else). I do know that it was not caused by increasing CO2 levels. I also know that it was very cold in the Little Ice Age. Incidentally, when the Hockey stick was first published, George Monbiot in the Guardian abolished both. Propaganda again.
    0 0
    Moderator Response: I told you to respond on the appropriate threads, not here. Please copy your individual replies to those relevant threads. Then I will delete this comment from this thread.
  46. Fred, When you first mentioned that the "mid-troposhere was not warming" @70, you said nothing about the fact that you were looking only at equatorial temperatures. Now we hear that you cherry-picked temperatures in the tropics, when you know very well we are dealing with global warming (AGW), and that the greatest warming has been in the mid and high latitudes (as predicted by AGW theory). You also mistakenly claiming that the alleged missing 'anthro' equatorial hot spot refutes the theory of AGW, when in fact you should know that the equatorial hot spot is not a signal of anthro warming, one should see the same hot spot regardless of the source of warming. Also, you talk about mid-tropospheric temps and do not show data for 500 mb, which is considered to be the mid-troposphere in meteorological circles. If you want to debate the equatorial hot spot, please take that tot he appropriate thread. The NOAA and RATPAC data show that globally tropospheric temperatures are increasing. Additionally, the RAPAC data show that globally (since 1958) the 850-300 mb layer is warming faster than the instrument-based surface temperatures. To dismiss that fact is to be in denial. I'm with NOAA and the climate agencies on this one, but thanks for trying to obfuscate-- readers here will see right though that though. You will be guaranteed success at WUWT. And lastly, please stop wasting everyone's time and cluttering the threads by parroting long debunked "skeptic" myths. Thanks.
    0 0
  47. Fred Staples - Your last post contains a huge list if misconceptions and disproven skeptic arguments; enough that it could qualify as a Gish Gallop. Taking it in the light of a well intentioned post, I would suggest you read: - Temp record is unreliable - It's Urban Heat Island effect - The first global warming skeptic (Angstrom) - 2nd law of thermodynamics contradicts greenhouse theory (Read it again - please!) - The Imaginary 2nd law of thermodynamics - The Real 2nd law of thermodynamics - What caused early 20th Century warming - Why did climate cool in the mid-20th Century - CO2 is not the only driver of climate - There's no tropospheric hot spot And finally, before posting other objections to the clearly established science, I suggest you take a look at the Most Used Skeptic Arguments and see if it's already been discussed. I'm not going to bother writing a point-by-point rebuttal of your post; that's already been done on those various pages.
    0 0
    Moderator Response: Thanks. Now there have been sufficient pointers to relevant Argument threads, for both Fred and everybody else to comment there rather than here. I'll start deleting any further off topic comments that appear here.
  48. Albatross @67

    I am not aware of any misinformation in my post. All of the data presented by me is in the public domain and is available from the links in my post. Please point out where I am "perpetuating misinformation" and I will make appropriate corrections, otherwise a retraction from you would appear to be appropriate.

    0 0
  49. Angus, As shown by the moderator's comment, your post in itself is misinformation Angus. The intended message of your post--that Hansen was wrong then and therefore whatever he does now too will be wrong or inaccurate. That is disingenuous, because the reasons for the discrepancies with Hansen's forecast (made way back then in 1988) have been discussed on the relevant thread-- so repeating it here without context and without a discussion of the reasons is misleading and amounts to perpetuating misinformation. You also fail to mention Hansen's more recent work which has superseded those early efforts = misinformation. You are living in the past and it is misleading (and misinformation) to suggest to readers here that the current generation of AOGCMs have not improved in leaps and bounds since those early days of climate modeling, as evidenced by the impressive figure shown in my post @63. The models will never be perfect, but as you see @63 they are doing very well considering the complexity of the climate system. Further, observations show that the IPCC estimates for sea-level rise and Arctic ice loss (amongst other metrics) have been too conservative. You paint a picture of alarmism by omission-- that is misinforming readers here. It is time to start applying the breaks.
    0 0
  50. FYI, this aritcle has been re-posted on TreeHugger.
    0 0

Prev  1  2  3  Next

You need to be logged in to post a comment. Login via the left margin or if you're new, register here.


The Consensus Project Website

THE ESCALATOR

(free to republish)


© Copyright 2024 John Cook
Home | Translations | About Us | Privacy | Contact Us