Climate Science Glossary

Term Lookup

Enter a term in the search box to find its definition.

Settings

Use the controls in the far right panel to increase or decrease the number of terms automatically displayed (or to completely turn that feature off).

Term Lookup

Settings


All IPCC definitions taken from Climate Change 2007: The Physical Science Basis. Working Group I Contribution to the Fourth Assessment Report of the Intergovernmental Panel on Climate Change, Annex I, Glossary, pp. 941-954. Cambridge University Press.

Home Arguments Software Resources Comments The Consensus Project Translations About Support

Bluesky Facebook LinkedIn Mastodon MeWe

Twitter YouTube RSS Posts RSS Comments Email Subscribe


Climate's changed before
It's the sun
It's not bad
There is no consensus
It's cooling
Models are unreliable
Temp record is unreliable
Animals and plants can adapt
It hasn't warmed since 1998
Antarctica is gaining ice
View All Arguments...


Username
Password
New? Register here
Forgot your password?

Latest Posts

Archives

Sea Level Hockey Stick

Posted on 23 June 2011 by dana1981

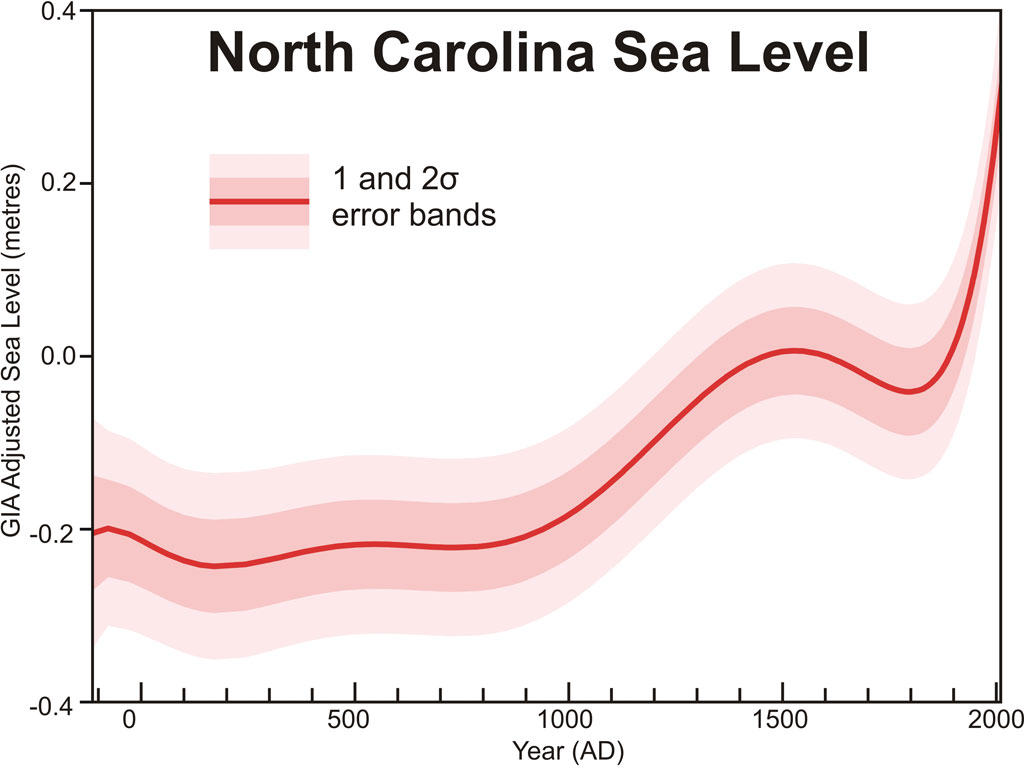
A paper recently published in the Proceedings of the National Academy of Sciences by Kemp et al. (2011) has assembled new sea level reconstructions for the past 2,100 years based on sediment from the US Atlantic coast. They found that recent sea level rise is the fastest over the last 2100 years:
Kemp et al. sea level data

Figure 1: Sea level reconstruction by Kemp et al. (2011) using sediment from salt marshes in North Carolina.  This figure has also been added to the high resolution graphics page.

Among the co-authors of this paper are some heavy hitters in climate research: Michael Mann, Martin Vermeer, and Stefan Rahmstorf.  The reconstruction is based on microfossils of foraminifera found in sediment from the US Atlantic coast."  Rahmstorf explains the study methodology at RealClimate.  The authors summarize their findings:

"Sea level was stable from at least BC 100 until AD 950. Sea level then increased for 400 y at a rate of 0.6 mm/y, followed by a further period of stable, or slightly falling, sea level that persisted until the late 19th century. Since then, sea level has risen at an average rate of 2.1 mm/y, representing the steepest century-scale increase of the past two millennia. This rate was initiated between AD 1865 and 1892. Using an extended semiempirical modeling approach, we show that these sea-level changes are consistent with global temperature for at least the past millennium."

In short, there was little change in their sea level reconstruction from 100 BC to 950 AD.  During the Medieval Warm Period and a bit beyond, sea level rose, as one would expect.  Into the Little Ice Age, sea level fell slightly, until just over a century ago, when sea level rise began to accelerate rapidly.  Rahmstorf, Vermeer, and Mann used a semi-empirical model to analyze the connection of the sea level data with climate, essentially assuming that the hotter it gets, the faster sea level rises.  Rahmstorf describes their conclusions:

"According to this model, the rise after about 1000 AD is due to the warm medieval temperatures and the stable sea level after 1400 AD is a consequence of the cooler “Little Ice Age” period. Then follows a steep rise associated with modern global warming. Modern tide gauge and satellite measurements indicate that sea level rise has accelerated further within the 20th Century."

"...the model fit to the new proxy data is highly consistent with the fit we obtained in 2009 to the tide gauge data. Hence it implies almost the same future projections as in our 2009 paper (75-190 cm by 2100)."

The authors note that their reconstruction is consistent with local tide gauge measurements, and also compared the North Carolina results to data gathered from nearby Massachusetts:

"The Massachusetts data agree with the North Carolina reconstruction, except for higher sea level between AD 700 and 1000 (although the uncertainty ranges overlap)."

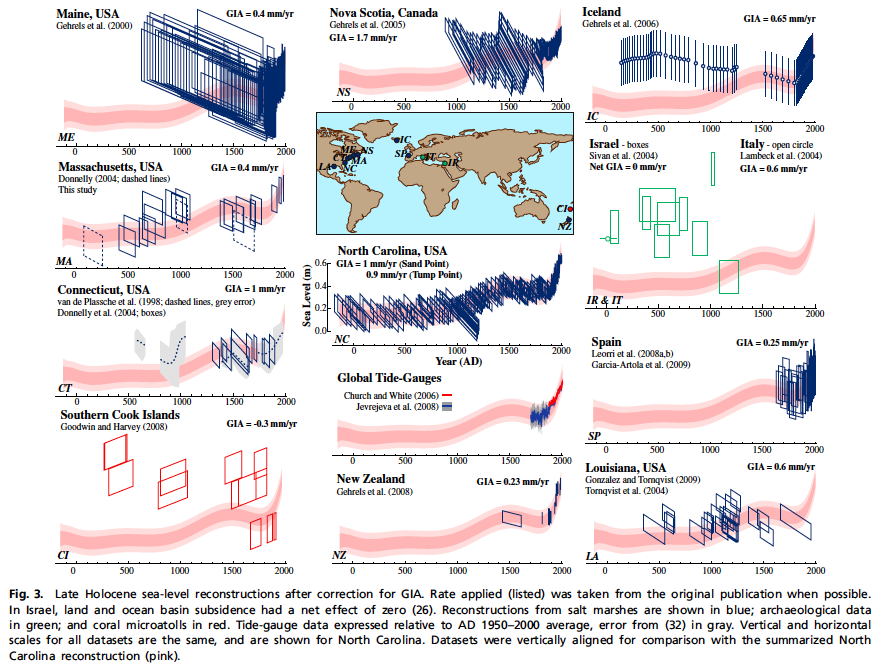
And they compared their results to a number of other sea level reconstructions (Figure 2).

"For North Carolina, we estimate that the deviation in sea-level rise from the global mean due to ocean circulation changes is between 0 and +5 cm. This estimate was based on the IPCC AR4 model ensemble for a 21st century global warming of ∼3°C, in which sea level rises globally by 22–48 cm."

"IPCC AR4 showed that local sea-level trends differed by up to 2 mm/y from the global mean over AD 1955–2003, which implies deviations of up to ±10 cm at some locations (but ±5 cm along most coastlines) as the sum of forced and unforced effects.  This analysis suggests that our data can be expected to track global mean sea level within about ±10 cm over the past two millennia, within the uncertainty band shown for our analysis."


Kemp comparisons

Figure 2: Comparison of various sea level reconstructions to Kemp et al. (2011).  The study's North Carolina reconstruction is shown in pink in every panel, and the other reconstructions for comparison are shown in blue, green, or red.

This sea level reconstruction is yet another member of the ever-growing hockey team (see other members here, here, and here) supporting the conclusion that the current rate of warming is greater than at any other time in the past two millenia.

0 0

Printable Version  |  Link to this page

Comments

Prev  1  2  3  

Comments 101 to 131 out of 131:

  1. 83, Eric the Red, Trying not to take the discussion too far off topic in covering the Ichthyan Displacement Anomaly theory of sea level rise... I'm sorry, but no, the "Earth will spin faster" is a common misconception pushed by those in icthyan denial. It is quite obvious to anyone who runs the numbers that the expansion of the ocean will in fact (given conservation of angular momentum) slow the rate of spin of the Earth. This will allow the fish to both feed more efficiently (getting fatter) and to mate more productively, producing more fish, and thus contributing even further to sea level rise. The only known negative feedbacks are the negative Laps Rate Feedback (Bainbridge, 1957 and more recently Dominici and Blake, 1997), where the expanded ocean volume combined with the larger fish surface area results in fewer laps made by the fish around the ocean, thus contributing somewhat to speeding the rate of rotation of the earth (due to the preference of fat fish to swim against the spin of the earth), and the admittedly poorly understood negative Fish Slaps Rate feedback (see Palin and Cleese, 1972).
    0 0
  2. ROFLMAO I remember the Monty Python skit - a classic. One last question before the moderator yanks us off. What will be the consequences of the ocean currents, specifically the speed of the Gulf Stream with regards to the fish swimming fewer laps?
    0 0
  3. It is considered common knowledge that the Gulf Stream will speed up as the fish swim further and further east to fatten themselves to prime netting condition.
    0 0
  4. On a more serious note, Mr. Willis Eschenbach has raised some valid concerns about this paper at Anthony Watts site: Willis Eschenbach's concerns
    0 0
    Response:

    [DB] OK, I made it 3 paragraphs in before the innuendo and accusations of malfeasance became too toxic for me.  IMHO, those who rely on such strategies deserve no credence.

    Camburn, you are really doing yourself a disservice and putting your learning curve on a two-steps-forward-one-step-back basis by your reliance on disinformation sites like that in your link.

  5. Again, historical evidence of what the sea levels were during the early AD period. They were quit a bit higher than the early levels developed for this paper. At least near Rome, and it appears also in Kent, which has been sinking for millenia. Salt studies from Roman Empire times
    0 0
    Response:

    [DB] Camburn, reliance upon compendiums of anecdotal information, however interesting, is not science.  If you wish to add to the discussion, please find scientific papers that have survived peer review and have added to the body of knowledge of climate science in some way.  That is what Skeptical Science is, using established science in proper context to properly evaluate skeptical claims and new, emerging information in the field.

  6. DB: I agree in that I didn't care for the character questioning part, but once past that Mr. Eschenbach did raise some valid concerns. I have now also read a paper that concludes that the proxy used in this study is not a good proxy for sea level. It has been quoted by several other scientists, but I need to find more confirmation before I post it here.
    0 0
  7. 87 Paul : there has been also an answer to the comment by von Storch et al. The acknowledged the fact that their reconstruction procedure is not quite the same as Mann et al., but it doesn't change that the loss of variance is a well know phenomenon that occurs routinely in any proxy reconstruction, and the reconstruction of SLR has no reason to be immune against this artifact. The origin of the issue is rather simple to understand. Proxies are, by definition, NOT temperatures, but rather another physical quantity X which can be a thickness of tree rings, an X-ray density of sediments, a density of foraminifers, or anything else. So it has , at some moment, be converted into a temperature by a calibration factor dT/dX - just for dimensional reason. This calibration factor must be computed by some reference, calibration period, where two indications overlap. But the important thing is that this calibration includes automatically other randoms factors polluting the proxies. Actually the calibration can be done on ANY signal , including totally random ones that have no link with temperatures ! of course it is unlikely that climate scientists use physically uncorrelated signals, but the amount of "pollution" by extra variance is very difficult to ascertain. So the agreement with instrumental data is granted by the calibration procedure , but not that with past data - random proxies would be very well correlated with temperatures in the calibration period, but vary randomly in the past and give an average flat curve, so they would generate automatically a "hockey stick" shape. The issue is then that : a hockey stick shape is automatically generated even by random data. This has been proved a number of times. This doesn't prove that proxy reconstruction are wrong of course ; it only proves they are dubious.
    0 0
  8. 107 - could you link to a published analysis supporting your last paragraph; and, preferably one not including anything about persistent red noise.
    0 0
  9. okatiniko wrote : "The issue is then that : a hockey stick shape is automatically generated even by random data. This has been proved a number of times." Yes, as les asks also, could you provide links to the evidence backing that claim of yours, along with a brief summary ?
    0 0
  10. Okatiniko #107: you have very handily demonstrated that you do not understand proxies or calibration at all. Thanks for that. The only person who has claimed to produce hockey sticks out of noise was a certain Steve McInyre, who could only do it through a hidden sorting of his 'random' data, so his selections were very far from random indeed - see les' link. Back in the real world, correlations will only exist if the proxy data happens to contain a shape close to that of the record being correlated against. In the real world the relationship will only be given credence if there is a physical mechanism to allow that link, say, like the expansion of ocean water with rising temperature. Otherwise if we were to believe your "random proxies would be very well correlated with temperatures in the calibration period", then anything could be correlated with anything else! I'll add my call for evidence to support your wild claims, also a call that if you cannot support those claims that you withdraw them.
    0 0
  11. skywatcher, I said that it was very unlikely that climate scientists would choose proxies totally uncorrelated with temperature. However, they are not 100 % correlated as well - or they would be also strictly correlated to each other. So the issue here is the amount of variance due to temperature, and the amount of variance due to other factors. Obviously the calibration procedure doesn't know which is which. In some extreme cases, such as the (in)famous Tiljander series, parasite modern phenomena have inverted the proxy. Obviously in this case, the calibration procedure will turn it upside down in the past. This can only lower the variance of the past reconstruction signal since it adds a negative temperature component. This has been corrected in later studies by screening the polluted period, but it shows the problem can be real.
    0 0
  12. les : the replication of hockey sticks by random pseudo proxies has been made by several authors, including Mc Shane and Wyner . It is nowhere said in deep climate that random pseudo proxies do not generate hockey sticks, the only controversy is about how far it affects reconstruction methods. I must admit that I am not competent enough to say who is right, and you aren't probably either.
    0 0
  13. okatiniko, Have you done any appropriately skeptical research to see if McShane and Wyner has any flaws as a paper?
    0 0
  14. There was a controversy about their conclusions (that real proxies didn't have a better skill to reproduce the temperature than random pseudo-proxies), but not on the very fact I mentioned, that you get a hockey stick shape even with random proxies. The exact amount of error introduced by the use of proxies is obviously a very technical point disputed even among specialists. I don't think anybody here (including me) is really competent to say who is right. But to my knowledge, nobody denies that proxies generally introduce a loss of variance in the past.
    0 0
  15. 12 - "I am not competent enough to say who is right" That is clear given your posts here and on other blogs. However it is clear to those who are that the random inputs do not give rise to hockysticks without assistance. ", and you aren't probably either." I'll thank you to make no such presumption! I've worked with a good veriety of models and data which include noise of various flavours and gave never generated any structure - let alone a hockystick - from the noise. Your remarks sum to no more that "there are uncertainties so maybe I'm right and I'm not prepared to listen to anyone's opinion. " Unless you can provede analysis to substantiate your claim, independently of the corrupted material to which we have both referred you should withdraw your accusation. You can not fall back on "well you and I don't understand it" to support your argument... ... that kind of argument should be left to the leprechauns.
    0 0
  16. 114, okatiniko, The references that I've found point to substantially more problems that you seem willing to recognize. The words "deeply flawed" are directly attributed to their paper, and in particular, the Lasso method they used appears to be unjustified and rather subjective. Their selection of data points was invalid, and proper selection yielded markedly different results. In fact, when applied properly, their own methods in comparison to MM08 yielded "considerably higher probabilities up to 99% that recent decadal warmth is unprecedented for at least the past millennium." [Gavin Schmidt and Michael Mann, two people who are competent -- I'd argue that Gavin is probably one of the most intelligent, well-educated, well-trained and skillful people I've encountered in my none-too-sheltered life.] From RealClimate:
    In this sense, the MW analysis, using the proper proxy data and proper methodological choices, yields inferences regarding the unusual nature of recent warmth that are even more confident than expressed in past work.
    I would not say the book is closed on this, but this is substantially beyond your assessment of "a controversy about their conclusions," and given the great number of specific, negative points made by a variety of investigators about their methods and conclusions, I myself find no merit in holding up their work as a point in any debate. Indeed, this entire hockey stick controversy is rather ridiculous, and I believe it serves the "denial cause" poorly to keep trying to stand by it. Every graph I look at, from temperatures to ice melt to sea level rise to anything else, all without any sort of PCA, centered or otherwise, shows some sort of hockey stick. Honestly, at this point the "Hockey Team" is not some cabal of evil scientists, but rather every temperature related measurement that one can think of. There are enough hockey sticks not merely to field a hockey team, but also to provide the second and third lines needed to win a Stanley Cup (Go Bruins!). To argue about hockey sticks is to close one's eyes to the obvious evidence that the earth is warming at a dramatic and unheard of pace. Losing oneself in centered-PCA, he-said/she-said arguments is just one more way of ignoring the unpleasant facts.
    0 0
  17. "Sea Level Study Leads to Divisions" is an in-depth review of the Kemp et al paper posted on Spiegel Online International. A number of prominent scientists, including Mojib Latif, were interviewed and are quoted.
    0 0
  18. les : "I've worked with a good veriety of models and data which include noise of various flavours " Obviously you didn't work with reconstruction of past data with a modern calibration period, since you don't seem to understand the debate. When I say "there is a controversy" , it's only factual: there is a controversy because different specialists disagree and argue in peer-reviewed papers. This is a fact. You can't use the "peer-reviewed" arguments when it goes in your direction and let it down when it goes elsewhere.Now obviously your decision about who is right and wrong is governed by your prejudices , and I'm sure you're totally unable to explain why exactly the lasso method is worse than another one - so please be modest and recognize that the subject is still unclear and discussed in the literature, as many others in science. Now I believe the hockey stick is real, since the Earth has warmed since the end of LIA, this is not discussed. But please give me ONE reference of any proxy reconstruction when the hockey "blade" starts in the 70's, after the anthropogenic component is supposed to become dominant, and not at the beginning of the century when obviously the CO2 warming was still insignificant. Show me only one.
    0 0
  19. 118 - You seem to find it very easy to be sure of things you gave no evidence for. Not least of all how much others here know. Still. Nice to see that you have retracted your claim that the proxy reconstructions recreate the hockey stick shape due to the affects of noise. That is sufficen.
    0 0
  20. 119 : I never stated that, so I cannot retract it. I said you can generate hockey stick shapes even with random pseudo-proxies, so the amount of loss of variance with real proxies is questionable, and I won't retract it. Proxies are just inaccurate indicators, and they are even unable to show any modern unusual increase of anything after 1970 - unless you give me a reference proving the opposite.
    0 0
  21. 120, okatiniko, Which of these hockey sticks do you refute? Or perhaps Arctic sea ice extent? Or perhaps Greenland ice mass?
    0 0
  22. okatiniko You might want to look at some of the 'hockey sticks' shown on Tamino's recent Five Year post. The majority of proxies cover multiple years per sample (foraminifera ratios, ice cores, isotope measures), and simply don't show the last few years because of insufficient range of time. Of course, the fact that the proxies are calibrated against the instrumental temperature record over the period of overlap, and that the instrumental record is very redundant and accurate, means that the instrumental record is the data of choice in the last 50-100 years. As to the 'random noise generating hockey sticks', you might want to look at peer reviewed refutations of McIntyre's work, such as Rutherford 2004, an extended discussion of the errors in the work, a letter to PNAS by Mann et al highlighting issues, and perhaps the most damning of all, an examination of the Mcintyre code that reveals a filtering function that selected 100 runs out of 10,000 on the basis of similarity to Mann's work, and from which a hand-picked subset of a dozen or so brought were forward as their objections/matchs. Pick the physically based process of choice and a graph of a key indicator - I'm willing to bet that running random combinations of weighted red noise 10,000 times, then selecting the best matching 0.1%, will yield surprising similarity. But that is in no way an argument against the physical process.
    0 0
  23. "I never stated that, so I cannot retract it" It was formulated in a much more convoluted way but that's exactly what your post 107 says. Infact, kudos to Les for cutting through the word salad and summarizing it in clear language.
    0 0
  24. 122, KR, Thanks. I was looking all over for that post of Tamino's to give to okatiniko, and couldn't remember the name with which to find it. Typing "show me what I want" into Google never seems to actually work. And they call that a "search engine."
    0 0
  25. KR 122, Spherica 124, I don't think Okamito would accept anything from Tamino, he's been over there spreading the same mishmash he is here. Check out Tamino's response at http://tamino.wordpress.com/2011/06/23/sea-ice-3-d/#comment-51844.
    0 0
  26. SEAN O'FARRELL - Thanks, that gives me some much appreciated context. okatiniko - You are not discussing science. At all. Looking at a few of your past comments, you are pumping out disinformation, ideas that have been disproved fully a thousand times (DFATT), and not critically reading any of the references provided. That, in my view, makes you a troll. I will not respond in detail to any more comments of yours unless they have significant scientific content. Although I might decry bad posts a bit...
    0 0
  27. 121 : Sphericae : again, which of these hockey sticks show an unusual rise after 1970, rather than after 1900 ? but between 1900 and 1970, there was nothing really unusual in forcings, nowhere. http://www.ipcc.ch/graphics/ar4-wg1/jpg/fig-9-12.jpg KR : same can be said with Taminos' HS of course. and the choice of random proxies correlated with instrumental temperatures is normal. After all, there are considered as proxies BECAUSE they're correlated with modern temperatures, so you also have a selection effect in real life. Again, it would be surprising that there is no temperature signal in them, but again the issue is just : lower variance. Philippe : I'm sorry that you didn't understand of what I said. I cannot be clearer. But you're free also to propose a hockey stick starting after 1970 if you know one ! sean : I'm ready to discuss with everyone. Tamino isn't. That's life.
    0 0
  28. 120 okatiniko - you really have to make your mind up: either the 'hockysticks' show features you feel they should show and, therefore, are not creating artefacts; or everything they show are artefacts. However you have decided - and this is clearly only based on your bias and, self-declared ignorance of statistics - that the hockey-sticks are real because they show up the LIA (and, indeed many other ancient climatic conditions). But are artefacts because they don't - in your opinion - show modern features pinned to a particular date. And as evidence? You dismiss the need for established science as being just a bias of mine, don't present any statistical analysis (because you can't) but use the good old eyeball-o-matic on graphs that you feel support your case (cherry picking). I still await your substantial demonstration of your claims, supported through published material, other than McIntyre's work which, as KR has pointed out, if not reliable. You cannot avoid that by claiming my incompetence. You will note, finally, that I am not presenting any "graph" showing a pick-up in 1970. That is, first, a total red-herring. Second, your dismissal of the indication of AGW through this data will come back, clearly, to your confusion about random noise, variance etc. which ... you have not substantiated . So, no I'm presenting nothing that allows you to spin around a circular argument.
    0 0
  29. 127 - okatiniko Just in case people get confused by this statement:
    but between 1900 and 1970, there was nothing really unusual in forcings, nowhere. http://www.ipcc.ch/graphics/ar4-wg1/jpg/fig-9-12.jpg
    due, clearly to the very poor practice of linking to a graph with no axis labels or comments... it comes from here. I think people can draw their own conclusions from the text. As always, beware the eyeball-O-matic; it is not a tool best suited to statistical analysis.
    0 0
  30. 127, okatiniko, It is unfortunate that you need to have climate change literally slap you in the face before you are willing to recognize it. Still, your obstinate denial in the face of clear evidence will help others to realize that a lot of the people that refuse to recognize climate change are doing so in clear denial of the facts, no matter how cleverly they can package or re-interpret them. More specifically, however, you need to understand the science, and the forcings. The lack of volcanic activity combined with an increase in solar insolation, a rebound from previous volcanic activity, and minor increases in greenhouse gases are all sufficient to account for the warming until 1945. No such forcings exist after 1970. The sun became more quiet, there were notable volcanic eruptions, etc., etc. At the same time, the rate of warming after 1970 is clearly faster than at any other point in the temperature record. That is the blade of the hockey stick, and it doesn't require a strong understanding of statistics to see it. At the same time, Greenland has been losing ice mass at an accelerating rate since 2000. That is the blade of another hockey stick. Arctic ice since the eighties is in an unending downward spiral. That is the blade of another hockey stick. Within a decade or two, increasing droughts will begin to seriously affect agriculture and water supplies in already water starved areas. That will be the rather painful blade of yet another hockey stick. At the same time, sea level rise is certainly going to accelerate, and that will be the blade of yet another hockey stick. That you cannot see any of this, because desperately don't want it to be true, does not change the facts. That you choose to interpret everything as a steady, unending and inexplicable heating of the planet ("Not our fault! Can't be CO2!") does not change the fact that this is clearly not the case, and that any rational, responsible and open minded person can see this for themselves. Anyone who doubts this can use the links and pages on this site to educate themselves, to understand the physics behind CO2, and to understand why it would actually be puzzling if all of this weren't happening. And anyone with an ounce of sense and responsibility will look at the Arctic, Greenland, the temperatures, the Amazon, sea levels, the increasing frequency of extreme weather events, and more, and will come to the conclusion that those who are in denial are seriously damaging everyone's future.
    0 0
  31. okatiniko wrote : "sean : I'm ready to discuss with everyone. Tamino isn't. That's life." I'm sorry but this can't be allowed to stand without the facts being known. Just in case someone reading this does not go to Open Mind to see why Tamino doesn't put up with such commenters, here are some of the relevant comments from him about okatiniko : Ignorance is reversible. But I don't believe you're really ignorant of these facts. I believe you want to *appear* to ask "questions" but it's just a thinly veiled facade. And when any of your errors are revealed (like your faulty, made-up definition of climate sensitivity of malignant design), you dare not admit any mistake, you just move on to the next talking point. When I first suggested that you might be more interested in arguing than in learning -- I had you pegged. Doubt is your product, it has been your only goal all along. I think everyone should know exactly what type of denial exists out there, and how it is repeated on different sites, often by the same people, and often falsely claiming to ask innocent questions. The question is, though : Why should we put up with it ? Especially from those claiming that they want to disuss things - in the same vein as Creationists do with regard to Evolution.
    0 0

Prev  1  2  3  

You need to be logged in to post a comment. Login via the left margin or if you're new, register here.


The Consensus Project Website

THE ESCALATOR

(free to republish)


© Copyright 2024 John Cook
Home | Translations | About Us | Privacy | Contact Us