Climate Science Glossary

Term Lookup

Enter a term in the search box to find its definition.

Settings

Use the controls in the far right panel to increase or decrease the number of terms automatically displayed (or to completely turn that feature off).

Term Lookup

Settings


All IPCC definitions taken from Climate Change 2007: The Physical Science Basis. Working Group I Contribution to the Fourth Assessment Report of the Intergovernmental Panel on Climate Change, Annex I, Glossary, pp. 941-954. Cambridge University Press.

Home Arguments Software Resources Comments The Consensus Project Translations About Support

Bluesky Facebook LinkedIn Mastodon MeWe

Twitter YouTube RSS Posts RSS Comments Email Subscribe


Climate's changed before
It's the sun
It's not bad
There is no consensus
It's cooling
Models are unreliable
Temp record is unreliable
Animals and plants can adapt
It hasn't warmed since 1998
Antarctica is gaining ice
View All Arguments...


Username
Password
New? Register here
Forgot your password?

Latest Posts

Archives

What is the role of stratospheric water vapor in global warming?

What the science says...

The effect from stratospheric water vapor contributes a fraction of the temperature change imposed from man-made greenhouse gases. Also, it's not yet clear whether changes in stratospheric water vapor are caused by a climate feedback or internal variability (eg - linked to El Nino Southern Oscillation). However, the long term warming trend seems to speak against the possibility of a negative feedback.

Climate Myth...

Water vapor in the stratosphere stopped global warming

A new study authored by Susan Solomon, lead author of the study and a researcher at the National Oceanic and Atmospheric Administration in Boulder, Colo. could explain why atmospheric carbon is not contributing to warming significantly. According to the study, as carbon levels have risen, the cold air at high altitudes over the tropics has actually grown colder. The lower temperatures at this "coldest point" have caused global water vapor levels to drop, even as carbon levels rise. Water vapor helps trap heat, and is a far the strongest of the major greenhouse gases, contributing 36–72 percent of the greenhouse effect. However more atmospheric carbon has actually decreased water vapor levels. Thus rather than a "doomsday" cycle of runaway warming, Mother Earth appears surprisingly tolerant of carbon, decreasing atmospheric levels of water vapor -- a more effective greenhouse gas -- to compensate. (Daily Tech)

The role of stratospheric water vapor is examined in Contributions of Stratospheric Water Vapor to Decadal Changes in the Rate of Global Warming (Solomon 2010). The atmosphere is divided into several layers. The troposphere is the lowest part of the atmosphere. It contains most of the atmosphere's water vapor, predominantly supplied by evaporation from the ocean surface. Through the troposphere, temperature falls as altitude rises. The boundary between the troposphere and stratosphere is called the tropopause. This is known as the "cold point", the coldest point in the lower atmosphere. In the stratosphere, temperature actually rises with altitude. It warms as you get higher - the opposite of the troposphere.
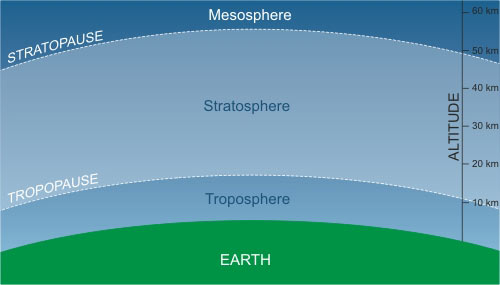
Atmospheric layers: Troposphere, Stratosphere and Mesosphere
Figure 1: Atmospheric layers: Troposphere, Stratosphere and Mesosphere

Solomon 2010 looks at the trend of water vapor in the stratosphere. Before 1993, the only observations of stratospheric water vapor were made by weather balloons above Boulder, Colorado (black line in Figure 2). They observed a slight increase from 1980. After 1993, several different satellites also took measurements (coloured circles, squares and diamonds in Figure 2). The various observations all found a significant drop in stratospheric water vapor around 2000. Most of the change in water vapor occurs in the lower stratosphere, just above the tropopause. The greatest changes also occur in the tropics and subtropics.
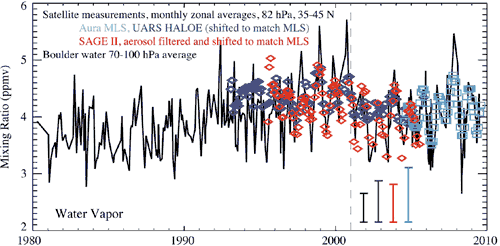
Water Vapor in stratosphere
Figure 2: Observed changes in stratospheric water vapor. Black line: balloon measurements of water vapor, taken near Boulder Colorado. Blue diamonds: UARS HALOE satellite measurements. Red diamonds: SAGE II instruments. Turquoise squares: Aura MLS satellite measurements. Uncertainties given by colored bars (Solomon 2010).

What effect would this have on climate? Figure 2 shows the change in radiative forcing imposed by changes in stratospheric water vapor. The dotted line is the radiative forcing without the effect of stratospheric water vapor changes. The grey shaded region shows the possible range of contribution from changing stratospheric water vapor. As it's a greenhouse gas, increasing water vapor has a warming effect. Consequently, the steady rise from 1980 to 2000 added some warming to the existing warming from greenhouse gases. The drop in water vapor after 2000 had a cooling effect.
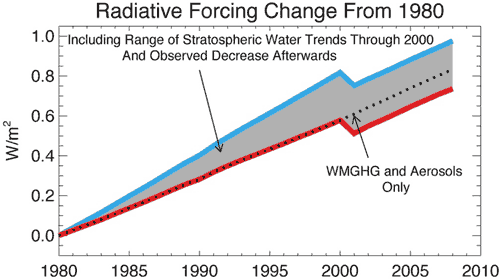
 
Figure 3: Impact of changes in stratospheric water vapor on radiative forcing since 1980 due to well-mixed greenhouse gases (WMGHG), aerosols, and stratospheric water vapor. The shaded region shows the stratospheric water contribution (Solomon 2010).

What caused these changes? Water vapor in the stratosphere has two main sources. One is transport of water vapor from the troposphere which occurs mainly as air rises in the tropics. The other is the oxidation of methane which occurs mostly in the upper stratosphere. Most of the change in water vapor occurs in the lower stratosphere in the vicinity of regions affected by the El Nino Southern Oscillation. This seems to point towards convection and internal variability driving the changes. A comparison between stratospheric water vapor and tropical sea surface temperatures show good correlation which corroborates a link with El Nino. However, the correlation breaks down in some periods suggesting other processes may also be important. Consequently, the authors are cautious in coming to a firm conclusion on the cause.

There seem to be two major misconceptions arising from this paper. The first is that this paper demonstrates that water vapor is the major driver of global temperatures. In fact, what this paper shows is the effect from stratospheric water vapor contributes a fraction of the temperature change imposed from man-made greenhouse gases. While the stratospheric water vapor is not insignificant, it's hardly the dominant driver of climate being portrayed by some blogs.

The other misinterpretation is that this paper proves negative feedback that cancels out global warming. As we've just seen, the magnitude of the effect is small compared to the overall global warming trend. The paper doesn't draw any conclusions regarding cause, stating that it's not clear whether the water vapor changes are caused by a climate feedback or decadal variability (eg - linked to El Nino Southern Oscillation). The radiative forcing changes (Figure 3 above) indicate that the overall effect from stratospheric water vapor is that of warming. The cooling period consists of a stepwise drop around 2000 followed by a resumption of the warming effect. This seems to speak against the possibility of a negative feedback.

Last updated on 26 June 2010 by John Cook.

Printable Version  |  Offline PDF Version  |  Link to this page

Argument Feedback

Please use this form to let us know about suggested updates to this rebuttal.

Comments

Comments 1 to 7:

  1. Stronger storms may destroy ozone (subtitle: Extra water vapor up high coul trigger destructive chemical reactions)
    For now, the danger exists only on paper. Actual measurements tracking chlorine compounds in the stratosphere would help to confirm whether the damage is taking place and, if so, how widespread the problem may be
    It sounds to me like this is a strictly localized effect.

  2. "It sounds to me like this is a strictly localized effect."
    Not exactly up to your usual standards of analysis, Eric. Heart just not into it today?
  3. Daniel the issue does deserve a better analysis. Strat. WV is increasing in the stratosphere above Boulder (fig 2 above) long term. And SWV arrives in the stratosphere from storms (observations described in the article I linked). Ozone is off topic in this thread, but when I looked it up I saw this simple page: http://en.wikipedia.org/wiki/Brewer-Dobson_circulation There are influences on Brewer-Dobson such as ENSO http://journals.ametsoc.org/doi/abs/10.1175/2010JAS3433.1 There are other contributions to SWV like methane oxidation.

    Here's some support for the "stronger storms causes SWV" hypothesis: http://adsabs.harvard.edu/abs/2003EAEJA.....1794W

    Recent observational studies indicate that the lower stratospheric water vapor concentration increased by 1 to 1.5% annually in the midlatitudes in the last 35 years. The mechanism proposed here may serve as a key process in the possible explanations for the observed trend.
    On the other hand, there's evidence for the opposite conclusion for SWV trends, http://acd.ucar.edu/~randel/H2O_after_2001.pdf "Global satellite observations from HALOE show a substantial, persistent decrease in stratospheric water vapor since 2001." Obviously 5 years won't say anything about long term trends and attribution, but it rules out simple depictions like the paper I originally linked unless their explanation also includes these natural fluctuations.

  4. I was at a blog yesterday. It seems like water vapor has been an issue at the denier sites as of late. I used this web address to try and make the point that water vapor only plays a small part. The gentleman responded as follows. It's a bit difficult for me to read someone speaking English as a second language. 1. http://www.ncdc.noaa.gov/sotc/fire/ “Nationally, the amount of acres burned was 9,221,639 during 2012.” 2. “Approximately 505,000 cubic kilometers of water falls as precipitation each year; 398,000 cubic kilometers of it over the oceans. Globally averaged annual precipitation is 990 millimeters.” It will be interesting to calculate that over oceans we have 398,000/505,000=0.788 or 78.8% of all precipitation, despite that ocean area is only 71% of all area of the Earth. 3. I hope you know that to evaporate 1 kg of water we need 539 kcal/kg of energy. Please, google virga and imagine that close effect we see all around the globe-not all water droplets in their way to land always partially evaporated. Calculate these transportation of energy to upper troposphere, where according your's link is cold, it will be laughable to blame stratospheric increase of temperature (what density of air there?) as reason for climate change.
  5. Stranger @4, sorry for this late response. I saw your post but did not comment because it is discussing an area about which I do not know a lot; and because the claims in your points 1 to 3 seem to have no logical relationship. What, for example, has the amount of acres burnt (in the US?) have to do with water vapour and precipitation? Never-the-less, at your request on another thread, I will attempt a response, and hope we can clarify what your respondent is trying to claim, and possibly bring in some more expert opinion. In so far as your respondent is claiming anything, it appears to be that a large amount of energy is transferred from the ocean to the atmosphere in the form of latent heat, which is true. They possibly want to conclude from this that this heat transport is not accounted for in mainstream climate science (I'm not sure). If, however that is there claim, it is blatantly false. In the famous energy balance by Trenberth, Fasullo and Khiel, evapo-transpiration is listed as transferring, on average 80 Watts per meter squared of power from the surface to the atmosphere. So, we don't have to "calculate that over all the oceans". Climate scientists, those people who study climate rather cherry picked parts of the climate because they think it will make a point, have done so already. In fact, that energy transfer is fundamental to our understanding of atmospheric physics. Without it, the lapse rate (the rate at which temperature declines with altitude) would be the dry adiabatic lapse rate, ie, 9.8 C per kilometer of altitude. But the release of latent heat as moisture precipitates out of the air lowers that. In the extreme case, it lowers it to the saturated adiabatic lapse rate of 5 C per kilometer, but on average it reduces it to 6.5 C per kilometer. All Global Circulation Models include these energy transfers, as they must to be effective. They even determine the change in lapse rate with time as global warming results in more evaporation, and hence more precipitation. Frankly, your respondent appears to be in a position analogous to an enthusiast telling a rally car driver that they are getting everything wrong because they are ignoring the operation of the accelerator. They only think they have discovered something momentous because of their overwhelming ignorance on the subject. Finally, I struggle to make sense of the comment that "it will be laughable to blame stratospheric increase of temperature", which is a complete nonsequitur. Convection only carries air, and hence evaporated water vapour to the tropopause. The result is that the stratosphere is very dry. (It has become more moist recently, but because of water produced in jet exhausts rather than from general circulation.) What ever sense can be made of their other comments (which is little), none can be made of their bringing in the stratosphere which has no bearing on anything they say earlier. Finally, your respondent may be trying to give a garbled account of a paper recently published, of which the editor said,
    "After extensive deliberation however, the editor concluded that the revised manuscript still should be published – despite the strong criticism from the esteemed reviewers – to promote continuation of the scientific dialogue on the controversial theory. This is not an endorsement or confirmation of the theory, but rather a call for further development of the arguments presented in the paper that shall lead to conclusive disproof or validation by the scientific community."
    Eli Rabbet discusses that decision (which is appalling), but also links to some extensive and informed critiques of the theory in question.
  6. Thank you so much. I've been able to use the information I've learned here and at REAL CLIMATE and have gained considerable amount of general knowledge. When you guys go off on the technical side I continue to read it anyway and through the repetition I begin to understand more of it. But when I get someone giving me what I figured was mumbo jumbo from a denier I probably need a little guidance. You’ve really made me scientifically curious after having absolutely no science background. This site has been a great resource and I'm a true fan!
  7. Hi,

    I was surprised to see this chestnut arise again in a PriusChat forum. Thanks to the search function here I quickly found this article that identified 'Solomon 2010' as the source. Google quickly snatched a copy of the paper and quickly revealed one of their sources, the Microwave Limb Sounder (MLS) is still operating and the data publicly available.

    It turns out, MLS shows the 'Solomon 2010' claim that humidity in the stratosphere going down did not remain the case. At least one subsequent paper which can be identified at the MLS as well as the site itself says stratospheric humidity is rising. It looks like the 'Solomon 2010' paper was premature.

    Bob Wilson, Huntsville, AL

Post a Comment

Political, off-topic or ad hominem comments will be deleted. Comments Policy...

You need to be logged in to post a comment. Login via the left margin or if you're new, register here.

Link to this page


The Consensus Project Website

THE ESCALATOR

(free to republish)


© Copyright 2024 John Cook
Home | Translations | About Us | Privacy | Contact Us