Climate Science Glossary

Term Lookup

Enter a term in the search box to find its definition.

Settings

Use the controls in the far right panel to increase or decrease the number of terms automatically displayed (or to completely turn that feature off).

Term Lookup

Settings


All IPCC definitions taken from Climate Change 2007: The Physical Science Basis. Working Group I Contribution to the Fourth Assessment Report of the Intergovernmental Panel on Climate Change, Annex I, Glossary, pp. 941-954. Cambridge University Press.

Home Arguments Software Resources Comments The Consensus Project Translations About Support

Bluesky Facebook LinkedIn Mastodon MeWe

Twitter YouTube RSS Posts RSS Comments Email Subscribe


Climate's changed before
It's the sun
It's not bad
There is no consensus
It's cooling
Models are unreliable
Temp record is unreliable
Animals and plants can adapt
It hasn't warmed since 1998
Antarctica is gaining ice
View All Arguments...


Username
Password
New? Register here
Forgot your password?

Latest Posts

Archives

1998 DIY Statistics

Posted on 7 January 2010 by MarkR

Guest Post by Mark Richardson

"It hasn’t warmed since 1998" is still a very popular argument. The article in the myths section here uses the scientific literature to argue against this, and statisticians reject it too. But using a spreadsheet you can do simple tests on the temperature record to see for yourself.

Imagine you’re trying to detect warming or cooling where you live in the Northern Hemisphere. You leave your thermometer outside in the shade and you run out at 3pm to read it. Then you run out every hour afterwards until you go to bed at midnight. Unbelievably the temperature is going down! Global warming must be over!

Obviously this is because you’re going from day to night; a natural cycle that doesn’t contain useful information about underlying warming or cooling. Fortunately, there are two simple ways to get around this.

  1. Only compare like-with-like, eg compare midday one day with midday the next.
  2. Use a ‘running mean like a 24 hour average.

I’m going to concentrate on 2) because it accounts for the changing amplitude of the cycle (eg a day with clear skies will have a warmer day/cooler night than a day with cloudy skies, comparing midday with midday wouldn’t work as well).

So you keep measuring the temperature day after day, starting in July and by December you’re really confused. It looks like you’re cooling. Global warming must be wrong again!

Obviously not; you’re in the Northern Hemisphere so you’re going into winter. Another pesky natural cycle has ruined your trend. So repeat 2), average over 12 months and you can compare years.

It’s ridiculous to compare night with day, or summer with winter; so why do some people compare an El Nino year with a La Nina year? Or a strong El Nino with a weak El Nino (this is like comparing midday with clouds to midday without clouds). You can’t extract any useful information about trends from this data!

To show you that this works, I’m going to make up a temperature record using just 3 things – greenhouse gases, the solar cycle & El Nino Southern Oscillation. These are 3 of the biggest factors affecting temperature, so it should look something like the real temperature record.
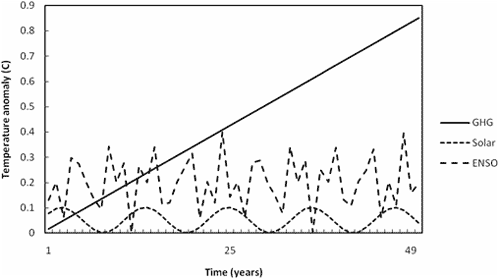

Figure 1 – Components of temperature series

To make up my ‘toy’ temperature series I add these together and get figure 2. It does a reasonable job of looking like the real temperature record for the last ~40 years and that’s what you’d expect for a period of roughly constant average solar output & El Nino.
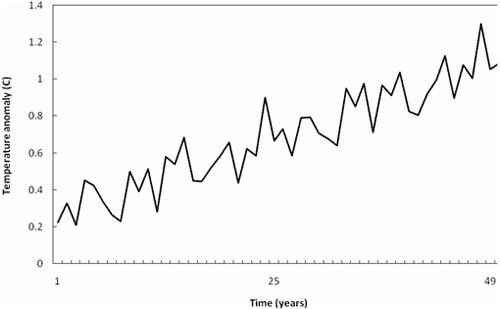

Figure 2 - Toy temperature series built from GHG, ENSO and solar components.

There is definite global warming from greenhouse gases, but there are still periods when you get a negative trend. Figure 3 is from a 9 year period in the graph for example.
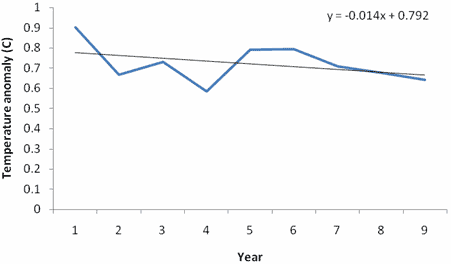

Figure 3 – Example negative trend from toy temperature series. Years 24-32.

So how do you decide what average to take? Well, you start by averaging over at least one period of the cycle; eg to cancel out day/night you take 24 hours, for summer/winter 12 months and for the solar cycle 11 years.

In a real data series without knowing all of the cycles, a scientist would do something called a ‘Fourier Transform’ – a clever bit of maths which tells you how long the cycles are. Here I know the periods: they are 4-8 years (El Nino) and 11 years (solar cycle). I’m going to take a 10 year average (remember, you can do this at home and try any average period you want to see what happens!), which is close enough to 11 that it should filter out most of the cycles.

Figure 4 shows there’s some little wiggles because 10 years doesn’t perfectly capture the periods but the interesting thing is the trend; it’s very close to the data and it thinks that there’s a warming trend of +0.017C/year.
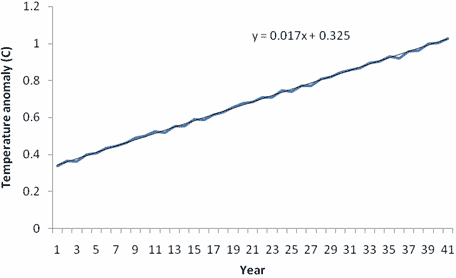

Figure 4 – Running mean 10 year average temperature.

This is exactly what I put into my toy model as the greenhouse gas warming. I tried the same trick with a quadratic equation and yet again, the averaging trick works and calculates very close to the underlying trend – try for yourself!

How could you use this trick to work out underlying trends in real temperature data? Follow the steps:

  1. Work out the period of the cycles using a Fourier Transform or by looking them up
  2. Take an average using the longest period
  3. Extract a trend

You can do it at home! There are example Fourier Transforms of the temperature on the internet, or you can just use the solar cycle as a baseline, take 10 or 11 year averages and know that this roughly covers the solar cycle and El Nino. Figure 5 shows an example using the HadCRUT3 temperature record.
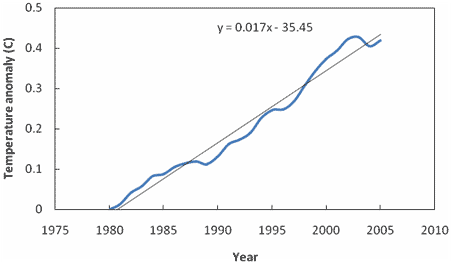

Figure 5 – HadCRUT3 using 10 year running mean for period 1975-2009. Temperature anomaly shifted up by 0.006C so that all values are positive.

This smooths out the short period cycles, but there is a slight dip recently. However, the decade trend is upwards (about +0.018C/yr), and short, small dips can be expected because you get wiggles from the cycles not fitting exactly into a 10 year trend. The average El Nino Index also dropped significantly from 1995-2009.

Once you count for the El Nino and solar cycles then you can see that something with a period longer than 10 years (and from that graph, longer than 60 years) is warming us. The rest of this site shows a lot of the evidence as to why scientists believe this effect is greenhouse gases, rather than anything else.

Many thanks to Mark Richardson for contributing this guest post.

0 0

Printable Version  |  Link to this page

Comments

Comments 1 to 43:

  1. Good, simple explanation. I tried a similar thing here last year.
    0 0
  2. Nice explanation, bookmark, bookmark!
    0 0
  3. Well written, Mark, thanks. Out of curiosity, what data source did you use for your ENSO values in Figure 1? Made-up values, or real ENSO data? Your solar cycle looks like a nice 11-year sine wave... :-)
    0 0
  4. If I use GISS data & plot it against the year, I still come up with a trend line of y=+0.0102x for the period of 1998-2008. For 2000-2009, the trend line is y=+0.012x. Also the average temperature anomaly for 2000-2009 is +0.515, compared to +0.32 degrees for 1990-1999. That the first decade of the 21st century is a clear 0.18 degrees *warmer* than the 1990's-in spite of falling solar irradiance-suggests to me that CO2 is playing a *very* important role in increasing the underlying temperature of the planet.
    0 0
  5. Here's another point worth considering. Look at the data from AMSU-A, comparing the temperature of mid-July, at roughly 2-year intervals, for the last 11 years & you get the following results: 1999: -14.35 2001: -14.29 2003: -13.98 2005: -14.00 2007: -14.06 2009: -13.65 Though the numbers bounce around a little bit, what we see is a definitive +0.7 degree warming trend at 1km above the planet's surface (the so-called "near surface layer). Looking at other parts of the year shows similar trends. Again, that this has occurred during a period of a record solar minimum just beggars belief-unless you accept greenhouse gas theory. Also, the fact that these measurements are occurring at 1km above the Earth's surface must surely discount the myth that any differences are due to the placement of weather stations!
    0 0
  6. What concerns me is the following : I took unadjusted data for a “randomly” selected set of weather stations around the globe up to around the year 2000, and looked at the data. I looked at the data for 20 stations and asked myself : “from the data is it seen that the temperature in any of the last 10 years of data is unprecedented”. In only one of the stations ( Hawaii ) was the highest ever recorded temperature in the last 10 years of data. I have been told that the earth is suffering from “unprecedented global warming” as a result of man-made CO2 emmissions since about 1970. But from this simple and quick investigation of mine, I don’t see that.
    0 0
  7. neilperth: Why are only "unprecedented" temperatures seen as being significant? Which data set(s) did you use? How many stations were in the data, total? How far back did your data go? Why select 20 stations out of N? How was your "random" selection done? What results do you get if you looked for "unprecedented" readings across all stations, and what % of hits (highest value in that 10-year window) would you consider significant to prove your hypothesis? For that matter, what was your hypothesis? You can access temp graphs and a bunch of other energy and climate graphs on a page I put together: http://www.grinzo.com/energy/graphs_v3_beta.html The temp graphs my page loads (all from NASA GISS) show a pronounced upswing beginning around 1975.
    0 0
  8. #6 & #7, global warming seems to be most easily evidenced by nighttime temperatures The above post is about trends in averages; the post I linked is about trends in record temperatures. They're really quite different things.
    0 0
  9. neilperth, there are some problems with your procedure. You cannot use unadjusted data, if by unadjusted you mean the raw data. There are several reasons and tons of papers on the need to adjust the raw readings. You can use a single station to look for the trend; although the statitstical significance of the results will probably be rather poor. Neverthless you can try. Or, you might want to look at global averages. In this case you can not simply pick up a random and rather limited selection of stations. You need to homogenize the time series first and check for the geographical distribution, the random selection criterion do not apply in this case. A final statistical test must be applied for the significance of the result. In other words, you must make a choice local vs global (or regional), then use the right data and the appropriate procedure.
    0 0
  10. #3: I made up the values using 0.2cos(At)cos(Bt). A and B were calculated to give periods of 4 and 8 years, and I chose an amplitude of 0.2 because peak to peak swings of 0.4C seem to have been observed before. Eg 1996-98 was a 0.4C swing in HadCRUT3 and I think it's reasonable to assume most of that was ENSO related.
    0 0
  11. Mark, Excellent post. "I tried the same trick with a quadratic equation and yet again, the averaging trick works" Be careful using the word "trick." ;-) Deniers like to use their own "tricks" to manipulate the charts to their own meaning. Unfortunately, most people don't understand how to read these charts, so they only see what they want to see. As I tell them, if you look hard enough, you can find an image of Jesus in a piece of toast. It's not enough to say there's a trend. Any trend must be supported by real-world evidence in order to properly interpret that trend. A minor point the deniers conveniently miss. To them, a trend is just a trend. One of my favorite books is "How to Lie With Statistics" by Darrell Huff. I like how Huff lines up these fallacies and explains how to filter them out. http://en.wikipedia.org/wiki/How_to_Lie_with_Statistics http://en.wikipedia.org/wiki/Misuse_of_statistics Keep up the good work! I'll keep sending folks your way!
    0 0
  12. This is nice, but it leaves open the question of the significance of the trend. By using a running mean to smooth the data, the autocorrelation will be increased dramatically. My concern with this kind of DIY thing is that someone will repeat what you've done here but then make the leap to naively interpreting the variance around the trend estimate as an actual confidence interval, which would be a big mistake. There's actually much more uncertainty in the estimate of the trend than one would think based on the smoothed data. I like Tamino's approach of looking at the temperature data many different ways -- using annual data and correcting for autocorrelation, and then just taking straightforward decadal means (NOT running means, literally plot the average from the 1970s, the 1980s, the 1990s, and the 2000s). The latter isn't as exciting, because you can't update it very often, but it does a nice job of eliminating all the autocorrelation issues. Anyway, this is all just nitpicking. Thanks for the interesting and informative post.
    0 0
  13. Ned: the target I had in mind for this method was someone who has barely been introduced to statistics, so probably wouldn't think of things like uncertainty. I can't see how someone conversant in beginner stats could fall into the 'it's been cooling since 1998' -> 'global warming is over' trap anyway! Of course, there are thousands of people much better at stats than I am and maybe they'll show up my naivety...
    0 0
  14. I think woodfortrees.org is a good source to mention in this connection. It is both a DIY (though only basically univariate) analysis/checking/plotting site and data source, for example... I'm a lot more pessimistic than you about basic statistical skills and global-warming-is-over fallacies, Mark. Remember the saying: "Statistics is often used the same way a drunken man uses a light-pole: For support rather than illumination." Sadly, we can't presuppose sound reasoning, and we must be prepared to document all sorts of things that should be rather obvious by now. Tamino has just done the modeling exercise "the statistical way", without sun, but with volcanic activity and the multivariate ENSO index: http://tamino.wordpress.com/2009/12/31/exogenous-factors/#more-2150
    0 0
  15. Ned, starting from the raw data, the more you smooth the lower the chance that you get spurious short time trends. This is the zeroth order treatment of the time series, i.e. no other statistical test on uncertaintiy or significance. On the contrary, if you can manage some stitistics, you'll probably want to use the raw data. But even in this case, sooner or later you'll end up smoothing and looking at residuals.
    0 0
  16. NEILPERTH: You said, "I have been told that the earth is suffering from 'unprecedented global warming' as a result of man-made CO2 emmissions since about 1970." No one has ever said that. What is unprecedented in at least 10,000 years is radiative forcing, NOT temperature. There are a few other things that are unprecedented, such as temperature in at least 400 years, glacier melting in some areas, etc. See for yourself. Do a search for "unprecedented" in the AR4: http://ipcc-wg1.ucar.edu/wg1/wg1-report.html
    0 0
  17. RE:# 11SLRTX That looks like an excellent book, i'm requesting my library for it now... A general question about the data sets for Mark or anyone...I'm assuming the GISS data set I've linked below is one that I can use. Also is Excel a good enough program to do the analysis? http://data.giss.nasa.gov/gistemp/tabledata/GLB.Ts.txt
    0 0
  18. #17 yocta I used excel because it's simple! Your GISS data set is commonly used and the experts say it's fine, so feel reasonably confident using it. :) If you're particularly interested, it's worthwhile taking a look at the satellite data as well (UAH & RSS are the names of the sets). You get some interesting squiggles from them; they seem more sensitive to El Nino for example, and it takes a bit more work to get an idea of what might be going on!
    0 0
  19. Ah coolthanks. I think I've done it, though rather crudely I got something like this. Year Jan 1880-1890 -0.136363636 1891-1901 -0.406363636 1902-1912 -0.354545455 1913-1923 -0.153636364 1924-1934 -0.026363636 1935-1945 0.035454545 1946-1956 0.000909091 1957-1967 0.019090909 1968-1978 -0.04 1979-1989 0.306363636 1990-2000 0.4 2001-2009 0.691111111 I understand the need to use temperature anomalies rather absolute temperatures but I am interested in specifically how they work them out. Rather than waste alot of time telling me, if you know of a paper or two that would be handy. (perhaps you know Ricardo?) This page has some info but it is a bit basic but their description reminds me of Excel Solver. http://data.giss.nasa.gov/gistemp/abs_temp.html
    0 0
  20. Hey MarkR, great post. As I said in posts #4 & #5, I've tried plotting the rate of change in average global temperatures myself, & have come up with a value of +0.108 degrees per decade for 1949-2009, & +0.163 degrees per decade for 1979-2009 (both with greater than 70% correlation). Now I wanted to do the same thing with RSS but, when I downloaded the dataset, I confess the whole thing looked like complete gibberish! Could you quickly explain how I can make the RSS data more....legible? Thanks in advance.
    0 0
  21. Excuse me fellas, the above is way over my head. But what is so wrong about simply plotting the 1997-2010 RSS? Or if I must, 1997-2010 CRU?
    0 0
  22. Hope you guys can tolerate another grade school comment from me, but why not just plot 1938-1979 CRU then switch to UAH because CRU was the best we had until satellites. So there was basically no warming from 1938 to 1997, then we had an enormous step up during the El Nino and we have been wallowing in such since. Very similar to what happened to Alaska with switch of PDO in 1997.
    0 0
  23. Nofreewind, what is of particular interest is in plotting sunspot numbers for 1997-2010: http://www.woodfortrees.org/plot/sidc-ssn/from:1997/plot/sidc-ssn/from:1997/trend which shows a massive downward trend in sunspot numbers over the 13 year period(from 100 to almost 0 from 1997-2010). Yet over that same time period, average global temperatures still manage to increase-even in spite of the El Nino event of 1998.
    0 0
  24. So I've been over the RSS data &-though I still say its too short a time period to show concrete trends either way-I come out with a weak warming trend between 2000-2010 (around +0.02 degrees for the decade), in spite of a massive drop in sunspot numbers over that time. Which just reaffirms the strong role of both the sun & GHG's in global warming.
    0 0
  25. Oh, & my point is further highlighted by the fact that the R^2 value for the trend-line is a mere 0.0027, i.e. too small a correlation to signify a trend.
    0 0
  26. yocta, not sure i understand what you're asking for. If you are curious about how the average absolute climatology is obtained I'd suggest this review by Jones et al.; in section 6 you'll find how they do. This is the "HadCRU method", details vary between research centers.
    0 0
  27. nofreewind: Such a short time period is 'wrong' if you assume that things like the Sun affect climate. If the Sun affects climate, then there is a cycle in heat flow with a period of 11 years (same time as the solar cycle). The entire point of my post is that if you take a trend over 1 cycle or less (in fact, you can even do the same with longer periods too), then you get spurious 'trends' that say nothing about greenhouse gases or longer trends, because they're dominated by the short term one. Eg a 1 year trend would be dominated by summer/winter, a 24hr one by day/night. You can get big positive or big negative trends from cycles that have no real trend if you pick your starting period well enough. Eg the linear regression of the cycle Sin(x) in the period [0, 2pi] is negative: http://www.4shared.com/file/184278813/5069ef42/SineNeg.html If you took the trend in the period [-pi, pi] then you'd get an equal and opposite positive trend. However, the 'real' trend is zero. The 'it's cooling' types tend to rely on tricks like this.
    0 0
  28. It is curious that the level of mercury in a glass tube seems to be more relevant to decision makers than the actual measurable effects of global warming (i.e., sea level rise, sizes of glaciers, water supplies, etc.) Just as the Earth is a giant magnet, it is also a giant thermometer; you just have to know how to read it.
    0 0
  29. nofreewind, use whatever data set you like but do not be fooled by short term trends, they are statistically meaningless. Based on what you claim that UAH is superior to HadCRU? It's worth recall that surface air temperature data set (GISS, HadCRU, etc.) are not the same as lower troposphere dataset (UAH, RSS). They measure similar but different things, you should not expect to get exactly the same results. Each has its own problems and strengths, their overall agreement is reassuring of the similarity but your sort of conclusive claim is totally unsupported.
    0 0
  30. RSVP, good point. I happen to comment on this problem a lot of times with friends. It appears that people more easily grasp temperature than other often more important effects. I think this is because we all are directly affected by temperature and we have a feeling of it; it's a direct measurement as opposed to indirect measurements such as sea level rise, tree line shift, etc.
    0 0
  31. What is also intriguing, though, is how the RSS data shows warming (I hesitate to use the word "trend") of 0.04 degrees per year between 2000-2005 (with an R^2 of 0.434-still not great, but better than 0.0027), which is nearly identical to the GISS value of +0.037 degrees per year over that same time period. These nearly identical warming rates can even be extended as far as 2000-2007 (+0.021 degrees per year for RSS vs +0.025 degrees per year for GISS). Its only in the last two years that the RSS & GISS numbers have really split apart, with the GISS anomaly showing a fall from +0.57 to +0.44 back up to +0.58, & the RSS anomaly showing a drop from 0.308 to 0.09 to 0.26. This is intriguing when you consider what a massive effect just 2 data points can have on such a small data set, & it makes me wonder which are the *correct* data points!
    0 0
  32. I think that a hot spike in a warming trend as the foundation for arguments the world is cooling just indicates how weak the case for "cooling" is.
    0 0
  33. I tend to agree Ken. Looking to use a single data point to invalidate 30-60 years worth of warming really does highlight the desperation of the Fossil Fuel Industry & its willing dupes (apparently these dupes would rather stuff an extra $1000 per year in the pockets of energy generators than just insulate their homes a bit better?!?!) Oh & I concur with you too RSVP. Temperature alone isn't the only thing that leaves me convinced of global warming, it's the massive shift in rainfall patterns, the retreat of glacial, Arctic & Antarctic ice & a host of other factors that tell me the planet has been warming the last 30 years *at least*!
    0 0
  34. This post was started with the statement "It hasn’t warmed since 1998" is still a very popular argument." Then the author began to obtusely deconstruct that statement using all type of complicated data not related to temperature over a much longer period than the past 12 years. I show a few simple graphs to prove the point. Here are all four graphs, it hasn't warmed since 1998, don't you think that is something to consider? Here is the IPCC projections, circa 2001. They were wrong. Marcus, what do sunspots have to do with the topic of this post? Where I hang out with my skeptic pals, sunspots are just another theory to consider, certainly their seems to be some correlation, (cycle length maybe, the Minimums had none etc), but there are diversions it seems. Give it 10 years! "willing dupes of the fossil fuel indusry". HILARIOUS! How many miles of driving using gasoline have you been "duped" into to. How do you heat your home? Why is your electricity so cheap(not oil but coal). Maybe that would I suggest you junk your vehicle and use wood to heat your house, and coal(on to wind), let's not get into that on this topic. Anyone here who believes that big oil has had anything but minuscule influence on this scientific debate is being deceived. Do you want to know about money, read this. , i'll show you the money! Glaciers melting - they have been melting since 1850, don't you know. Arctic Ice - The past two years there has been an enormous recovery from the 2007 September low. And I just read a warmer arctic scientist state he expects further recovery this year. Antartica, at least as far as sea ice goes, no strong trend, except maybe slightly up. Of course there are all kinds of measurements going on in Antartica.
    0 0
  35. Nofreewind, it seems that you haven't got the main point here: In order to find _reliable_ trends as fast as possible, you have to sort out as much as possible of short time oscillations, special events like volcanoes etc. That's what this post is about. "It hasn't warmed sincce 1998" is a typical example of an unreliable trend observation. 1998 was a very special year, and when we are talking about trends, like "it has/hasn't warmed", we are making statements about what the typical situation is. I don't think you have looked very closely into the arctic ice data. That "enormous recovery" you talk about, led, for example, to Nov 2009 ice levels being lowest in several decades, practically the same as 2007, and, rank-wise, we are at about the same level right now. If we had been back to the situation around 2000, we would have been more safe in talking about "recovery" from the 2005-2008 average situation, but we aren't. Also, the September 2007 arctic ice extent is about as untypical as the 1998 global temperature anomaly, so that doesn't in any way establish an ice level to "recover" from.
    0 0
  36. nofreewind, oh yes, i see, but unfortunately now global warming has started again at the incredible pace of more the 20 °C/century!!! Pretty scaring, isn't it? Or maybe we (me and you) are missing something?
    0 0
  37. nofreewind: I'm not convinced by your politics argument. If something is wrong mathematically then it's wrong regardless of whether you believe in communism, free markets or pastafarianism. As far as I can tell, when a function has periodic components in it (eg assume that temperature is affected by the Sun's output), looking at a single trend over periods similar to the periods of those components and making absolute conclusions about longer trends is simply wrong. Not bad, or communist, just plain wrong.
    0 0
  38. "Here is the IPCC projections, circa 2001. They were wrong. " Why IPCC 2001 rather than AR4? Another form of cherry picking? The temperature record falls within the two-sigma error bars of the ensemble projections in AR4. I imagine a similar exercise performed on the earlier projections would show a similar result, but Real Science tends to look at recent results rather than focus on the past ...
    0 0
  39. Oh, here's another thing-Nofreeewind-try reading here about glacial retreat: http://www.nichols.edu/departments/Glacier/glacier_retreat.htm or here: http://glacierchange.wordpress.com/ As to the Arctic, perhaps you are unfamiliar about the stories, in 2008 & 2009, which highlighted how conventional merchant ships were able to navigate the length of the North-West & North-East passage, in *late Autumn*! Doesn't sound like much of a recovery to me.
    0 0
  40. #11 SLRTX: thanks for the heads up on the book. Through the wonder of the internet I now have a second hand copy of 'How to lie with statistics' - looking forwards to it! #20 Marcus: Is it this data? In which case first column is yr, 2nd column is month and 3rd+ columns are anomalies. You want the third column data because that's as close as it gets to global (the numbers are latitudes). It's not as easy to handle in excel as hadCRUT and GIStemp, but the data is all there :)
    0 0
  41. RE: #26 Ricardo Thanks that is a helpful paper. I wanted to know how the variances were recorded. The methods in Section 3 "Aggregation of the Raw Data" seem to address that.
    0 0
  42. A similar demonstration of the issue is from an Australian political skeptic here. I almost understand statistics after that :)
    0 0
  43. Came across this old thread in my wanderings, and the post from nofreewind showing us a graph with a declining trend from 1998. Here's what it looks like: It's more than a year later, so we can add another year's data to that 1998 trend line. The result: Emphasising the point that short term data demonstrates the variability, not the trend.
    0 0

You need to be logged in to post a comment. Login via the left margin or if you're new, register here.


The Consensus Project Website

THE ESCALATOR

(free to republish)


© Copyright 2024 John Cook
Home | Translations | About Us | Privacy | Contact Us