2016 SkS Weekly Climate Change & Global Warming Digest #41
Posted on 9 October 2016 by John Hartz
Story of the Week... SkS Highlights... Toon of the Week... Quote of the Week... Graphic of the Week... SkS in the News... SkS Spotlights... Video of the Week... Coming Soon on SkS... Poster of the Week... Climate Feedback Reviews... SkS Week in Review... 97 Hours of Consensus...
Story of the Week...
A renowned economist who helped persuade the world to start taking climate change seriously has warned the global economy could “self-destruct” if countries fail to ditch fossil fuels and embrace a clean, green, high-tech future.
Professor Lord Nicholas Stern was credited with bringing about a sea change in attitudes when he calculated the cost of failing to tackle the problem in 2006. While dealing with global warming would cost one per cent of the world’s gross domestic product, doing nothing would be up to 20 times more expensive, he concluded.
Now Professor Stern, former Mexican president, Felipe Calderón, and other leading figures from politics, finance and science have launched a major new report saying Governments and businesses must change course – and quickly.
“The challenge is urgent: the investment choices we make even over the next two to three years will start to lock in for decades to come either a climate-smart, inclusive growth pathway, or a high-carbon, inefficient and unsustainable pathway,” said the report by The Global Commission on the Economy and Climate.
Global economy could 'self-destruct' if world carries on burning fossil fuels, leading economist warns by Ian Johnston, The Independent, Oct 6, 2016
SkS Highlights...
Using the metric of comments garnered, the two most popular articles posted on SkS during the past week are:
- DOE charts show why climate doom and gloom isn't needed by Dana Nuccitelli (Climate Conensus - the 97%, Guardian)
- The future belongs to clean energy by Anders Runevad (Climate Conensus - the 97%, Guardian)
Toon of the Week...

Quote of the Week...
As the American Southwest grows hotter, the risk of severe, long-lasting megadroughts rises, passing 90 percent likelihood by the end of the century if greenhouse gas emissions continue at their current pace, a new study says. If we aggressively reduce emissions, however, we can cut that risk substantially, the authors write.
The findings from scientists at Columbia University’s Lamont-Doherty Earth Observatory, Cornell University and NASA provide new insights into the role temperature plays in megadrought risk and how our choices today can affect water resources in the future.
“By the end of the century, the real controlling influence on megadrought risk will be temperature. That stands out very starkly against precipitation projections that can vary quite a bit,” said study co-author Jason Smerdon, a climate scientist at Columbia University’s Lamont-Doherty Earth Observatory. “What really seems to drive the drying in terms of future projections is the magnitude of the mean temperature increases.”
Rising Temperatures Load the Dice for Megadrought Risk by Stacy Morford, Nexus Meida, Oct 6, 2016
Graphic of the Week...

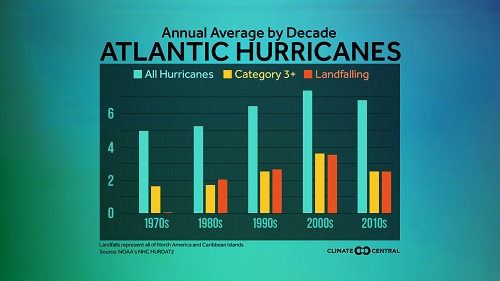
Hurricane Matthew threatens the Southeast through this weekend. Although no major hurricane has made landfall in the U.S. since 2005, that has not been the case in other parts of the Atlantic Basin. The number of major Atlantic hurricanes has been increasing since 1970 and the the U.S. is long overdue for one to strike.
Annual Average Atlantic Hurricanes by Decade, Climate Central, Oct 5, 2016
SkS in the News...
In his article, Cross Post: What do sugar and climate change have in common? Misplaced scepticism of the science, Prof Neil Levy links to the SkS Rebuttal article, Over 31,000 scientists signed the OISM Petition Project. Levy's post is on the Practical Ethics website of the University of Oxford.
SkS Spotlights...
Women's Earth & Climate Action Network, International
The Women's Earth & Climate Action Network is a solutions-based, multi-faceted effort established to engage women worldwide to take action as powerful stakeholders in climate change and sustainability solutions.
Video of the Week...
Atmospheric Scientist: Donald Trump & Mike Pence are a Climate ChangeDenial Dream Team, Democracy Now!, Oct 6, 2016
Coming Soon on SkS...
- Trailer: After the flood (greenman)
- Explainer: Paris Agreement on climate change to ‘enter into force’ (Sophie Yeo)
- Video: Laurence Tubiana on the 1.5C questions scientists need to answer (Leo Hickman)
- Climate change could push risk of ‘megadrought’ to 99% in American southwest (Robert McSweeney)
- Scientists: How the new focus on 1.5C is reshaping climate research (Roz Pidcock)
- 2016 SkS Weekly Climate Change & Global Warming News Roundup #42 (John Hartz)
- 2016 SkS Weekly Climate Change & Global Waming Digest #42 (John Hartz)
Poster of the Week...

Climate Feedback Reviews...
Climate Feedback's team of experts analyze the article, James Lovelock: ‘Before the end of this century, robots will have taken over’ by Decca Aitkenhead (Guardian, Sep 30, 2016) and concludes:
Five scientists analyzed the article and estimated its overall scientific credibility to be ‘low’ to 'very low'.
Click here to access the detailed review.
SkS Week in Review...
- 2016 SkS Weekly Climate Change & Global Warming News Roundup #41 by John Hartz
- Pew survey: Republicans are rejecting reality on climate change by Dana Nuccitelli (Climate Conensus - the 97%, Guardian)
- The future belongs to clean energy by Anders Runevad (Climate Conensus - the 97%, Guardian)
- Obama, Hayhoe, DiCaprio climate discussion by Guest Author
- DOE charts show why climate doom and gloom isn't needed by Dana Nuccitelli (Climate Conensus - the 97%, Guardian)
- 2016 SkS Weekly Climate Change & Global Warming Digest #40 by John Hartz
97 Hours of Consensus...


 Arguments


Has anyone noticed that despite a static or slightly decreasing world carbon dioxide output over the past couple of years, the ManaLoa Carbon dioxide web site shows a marked jump in the increase of Carbon dioxide as reported for pairs of months (Jan2015 to jan2016 etc). Has some sink closed down or is in the process of closing down. We will need the results from 2916-2017 to see if this is a trend or if we revert to the mean. If it is a trend, we have cut in half (approx.) the time to whatever level of Carbon dioxide you consider the ceiling absolute ceiling beyond which we must not go.
Sorry. Typo. 2016-2017
william @1, the rate at which CO2 is taken up into the ocean is primarilly governed by GMST relative to current CO2 concentrations. The result is that if you have a sequence of successively warmer years (such as 2012-2016), you will get a higher airborne fraction of CO2 in each successive year, with a consequent rapid increase CO2 concentration. Conversely, with succession of cooler years will result in a much reduced short term trend in CO2 concentration. Over the long term, however, CO2 concentration grows at approx 55% of industrial CO2 emissions (ie, those from fossil fuels and cement manufacture) or about 45% of all anthropogenic emissions including Land Use Change:
The upshot is that it is far to early to say that the recent more rapid increase in CO2 concentration is due to our having passed some tipping point and triggered a new feedback rather than just a response to the rapid increase in temperaure over the last few years.
To elaborate on Tom Curtis@3 in intuitive terms (at least for a statistician):
Warm water dissolves less CO2 than cold water does: check second graph here.
During ElNino (as we've had in last year or so) the ocean surface water - responsible for excess CO2 sequestration - is warmer. Ergo, less man made CO2 goes into ocean, ergo perceived rate of atmospheric CO2 increase due to humans becomes higher than everage.
Correspondingly, During LaNina the ocean surface water - responsible for excess CO2 sequestration - is cooler. Ergo, more man made CO2 can go into ocean, ergo perceived rate of atmospheric CO2 increase due to humans becomes lower than everage.
However ElNino/LaNina variability has been perfectly balanced so far - no one has observed any deviation from neutral state. That's why an average CO2 concentration increase follows the cumulative emmisions so closely on Tom's graph above. ElNino/LaNina variability is seen on this graph as irregular red noise of few year to a decade frequency - precisely the average ElNino/LaNina historical frequencies.
Other sinks of CO2 exhibit different variabilities, e.g terestrial biosphere has very steady annual cycle visible on Keeling curve. But it is smoothed on Tom's graph.
William @ 1. Even allowing for the explanation from Tom Curtis @ 3, you make a good point.
It would be interesting to know to what extent the global emmisions growth is subject to some creative accounting.
If emmisions growth is really negative we should start to see a change in the gradient of the Keeling curve within the next few years.