2017 SkS Weekly Climate Change & Global Warming Digest #4
Posted on 29 January 2017 by John Hartz
Story of the Week... La Niña Update... Toon of the Week... Quote of the Week... Graphic of the Week... SkS in the News... SkS Spotlights... Video of the Week... Coming Soon on SkS... Poster of the Week... SkS Week in Review... 97 Hours of Consensus...
Story of the Week...
Last weekend, a massive milieu of women in pink hats descended on Washington, D.C. for the Women’s March. The next big protest being planned for the nation’s capital could involve a sea of lab coats (and likely a few pink hats as well).
A group of researchers have proposed a March for Science. What started as a discussion on Reddit has quickly blossomed into a movement.
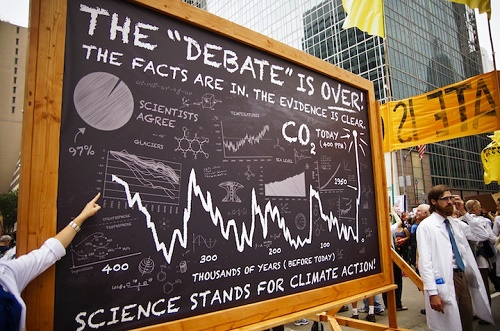
Scientists at the 2014 People's Climate March in New York. Credit: Joe Brusky/flickr
Organizers started a private Facebook group and Twitter account on Monday. By Wednesday afternoon, the former boasted more than 300,000 members and the latter had nearly 55,000 followers. A public Facebook page had more than 11,000 likes just five hours after going online. The explosion of support caught organizers off guard, but they’re meeting this weekend to discuss details about the date and full mission statement.
The march would be the latest in a string of actions taken by scientists following Donald Trump’s election and his inauguration as president. His administration has been widely viewed as hostile to science — from the transition period through hearings for his cabinet nominees through silencing key federal science agencies and freezing grants.
“This is not a partisan issue. People from all parts of the political spectrum should be alarmed by these efforts to deny scientific progress,” Caroline Weinberg, a medical researcher who is helping organize the march, said. “Scientific research moves us forward and we should not allow asinine policies to thwart it.”
Scientists Are Planning the Next Big Washington March by Brian Kahn, Climate Central, Jan 25, 2017
Toon of the Week...

La Niña Update...
It is time to say goodbye to La Niña, and possibly hello to El Niño again later in the year.
Ever since the record-setting El Niño of late 2015 started winding down early last year, commodity markets have been fully focused on the La Niña that forecasters had predicted would dominate late 2016 and potentially much of 2017.
The El Niño-Southern Oscillation, or ENSO, is one of the most followed global climatic features, as its cool phase La Niña and warm phase El Niño have somewhat contrasting effects on weather patterns worldwide.
El Niño may return in 2017 by Kearen Braun, Reuters/Daily Mail, Jan 26, 2017
Quote of the Week...
“Donald Trump has been in office for four days and he’s already proving to be the dangerous threat to our climate we feared he would be,” said Michael Brune, executive director of the environmental organisation the Sierra Club.
“Simply put, Donald Trump is who we thought he is: a person who will sell off Americans’ property and tribal rights, clean air and safe water to corporate polluters.”
Resurrection of Keystone and DAPL cements America's climate antagonism by Oliver Milman, Guardian, Jan 24, 2017
Graphic of the Week...
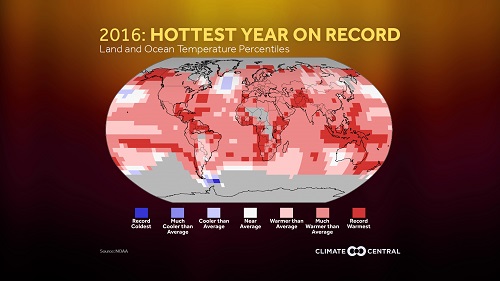
2016 Was the Hottest Year on Record, Climate Central, Jan 18, 2017
SkS in the News...
It's possible to 'vaccinate' Americans against fake news, experiment shows by Sean Greene, Los Angeles Times, qutoes John Cook via Dana Nuccitelli's article, Study: real facts can beat 'alternative facts' if boosted by inoculation, Climate Consensus - the 97%, Guardian.
SkS Spotlights...
Track 0 is an independent, not-for-profit organization serving as a hub to support all those transitioning to a clean, fair and bright future for future generations around the world compatible with the goals set out in the Paris Agreement. We convene leaders and provide strategic research, training, advice, communications and networking support to governments, businesses, investors, philanthropies, communities and campaigns run by civil society.
Track 0’s mission is to translate the globally agreed well below 2ºC/1.5ºC limit on temperature rise set out in the 2015 Paris Agreement into emissions pathways and metrics that can support transformative solutions implementable by everyone. Scientists say we need to reach net zero emissions by around 2050 for a high chance of limiting temperature rise to well below 2ºC/1.5ºC. Track 0 supports countries, companies, cities and individuals that are making a commitment to get to zero emissions through setting concrete emission reduction targets aligned with science.
Phasing out emissions to zero is feasible and supported by the science. This goal is recognised in the Paris Agreement, which mandates everyone to work collectively to decarbonise the global economy by aiming to reach a global peaking of emissions as soon as possible so as to achieve a balance in global emissions in the second half of this century. Scientists agree this means bringing the biggest sources of emissions from fossil fuel combustion and industry down to zero as quickly as possible, starting today.
Video of the Week...
Michael Hoffmann of the Cornell Institute for Climate Smart Solutions gave a talk October 13, 2016 as part of the Soil and Crop Sciences Section seminar series. Find more seminar videos at http://sips.cals.cornell.edu
Michael Hoffmann: Climate change: A call to action! by Michael Hoffman, Cornell University, Jan 24, 2017
Coming Soon on SkS...
- Fact Check: Trump's Cabinet Nominees on Human-Caused Global Warming (Dana)
- Trump copies Bush censorship playbook, but scientists aren’t standing for it (Dana)
- Global warming hiatus claims prebunked (Ari Jokimaki)
- Guest Post (John Abraham)
- A message to Trump from and a support group for climate scientists (Colin Maessen)
- 2017 SkS Weekly Climate Change & Global Warming News Roundup #5 (John Hartz)
- 2017 SkS Weekly Climate Change & Global Waming Digest #5 (John Hartz)
Poster of the Week...

SkS Week in Review...
- 2017 SkS Weekly Climate Change & Global Warming News Roundup #4 by John Hartz
- Joint Statements on Climate Change from National Academies of Science Around the World by Peter Gleick (Significant Figures)
- We may be closer than we thought to dangerous climate thresholds by John Abraham (Climate Consensus - the 97%, Guardian)
- From the eMail Bag: Abrupt Climate Change in Greenland's Past? by David Kirtley
- Study: real facts can beat 'alternative facts' if boosted by inoculation by Dana Nuccitelli (Climate Consensus - the 97%, Guardian)
- We’re now breaking global temperature records once every three years by Dana Nuccitelli (Climate Consensus - the 97%, Guardian)
- 2017 SkS Weekly Climate Change & Global Warming Digest #3 by John Hartz
97 Hours of Consensus...


 Arguments


If warming melts the polar caps the ocean goes up 100 or more feet. It hasn't gone up an inch yet, so why worry. 99% of everything in our solar system is in the Sun, so it controls and we don't understand it.
[JH] Sloganeering snipped.
[PS]
Thank you for taking the time to share with us. Skeptical Science is a user forum wherein the science of climate change can be discussed from the standpoint of the science itself. Ideology and politics get checked at the keyboard.
Please take the time to review the Comments Policy and ensure future comments are in full compliance with it. Thanks for your understanding and compliance in this matter. To avoid sloganeering back your assertions with data/references to support your view.
I've got a question that I believe SS can best answer/direct me... do the modeled forecasts for temp from reduced CO2 also account for decreased solar dimming and thus more wamring?
Ravenken, I cant comment on the forcing used to climate commitment papers but I would note a couple of things:
1/ Aerosols are increasing decoupled from CO2 emissions anyway thanks to scrubbing technologies and have been dropping since 1990s.
2/ If you look at the forcing strength, the heating from increased CO2 is rather stronger than aerosol cooling.
From this I would conclude the GHG concentration is most anthropogenic important factor affecting temperature.
Not common to see sealevel rise talked about in inches but I just found this image
based on this paper.
scaddenp- thank you for getting back to me...
I'm still a little in the dark... what I am trying to get at is, as global society starts using less coal I thought that might decrease the amount of global dimming occuring from coal power plants... There might not be any dimming from coal plants (as my ignorance would attest) but I'm assuming there is... I get and understand the CO2 is going nowhere but I thought the particulate matter from coal plants contributed to global dimming...
I guess my first question is do coal plants contribute to global dimming. If so, how much... I appreciate your patience.
Ravenken @5, the particulate matter is soot, which contributes to global warming, and is accounted for in models as Black Carbon (BC). Coal or oil with high sulfur contents also release sulfur dioxide (an invisible gas). That reacts with components in the atmosphere to form sulfates, very small particles that reflect sunlight and also form cloud condensation nuclei. As a result of the latter, the presence of sulfates will result in more, but smaller water droplets in a cloud, which results in a greater cloud albedo, and reduced rainfall. The effects of sulfates are taken into account as the aersol direct effect (the albedo of sulfates), and the aerosol indirect effect (the impact on clouds by providing cloud condensation nuclei). Combined the consequences of these two effects is what is generally called global dimming. As both effects are taken into account in climate models, so also are the effects of global dimming. However, the uncertainty of the strength of the two effects is one of the largest uncertainties in climate science.
From the above, you should see that the impact of reduced aerosols from shutting down fossil fuel energy sources is taken into account in scenarios with rapid decarbonization of the economy.
But independent of Tom's comment - scrubbing technologies are reducing global dimming independently of the about of FF we burn. As far as I can tell, the models for zero emissions also nil the human aerosols.
scaddenp @7, do you know that global dimming is reducing from a scientific study. My understanding was that as aerosols decreases in the developed world due to the introduction of scrubbers, it increased in the third world, and particularly in China due to their rapid industrialization. Because aerosols tend to be regional effects, it may be that global dimming as measured in the US, EU or Australia has fallen, but that globally it has remained the same or increased. I have made a quick skim of Wild 2012, and Wild 2016, and can see no definite conclusion on that point. Wild 2012 does illustrate the different trends in different regions (Figure 2).
So coal causes some quantity of cooling through the global dimming effect. But as noted, it also causes warming, and on the best evidence we have this is the more powerful effect, although with some level of uncertainty.
However we cannot stop there. I read this recently so thought I would add it in. A recent study by the WHO has found air pollution, including particularly from coal, causes far more deaths than previously thought, as below.
www.who.int/mediacentre/news/releases/2014/air-pollution/en/
And coal mining remains a very hazardous occupation. We had a coal mine explode a few years back, killing dozens of people, despite all the modern technology, and health and safety rules.
And we are no longer in the Industrial Revolution with coal generating steam power or home heating. We now have other energy alternatives.
Things constantly evolve and change.
You have to consider the big picture, and the full range of evidence. Trump seems to struggle with that, as do his inner circle.
Tom, I was basing of this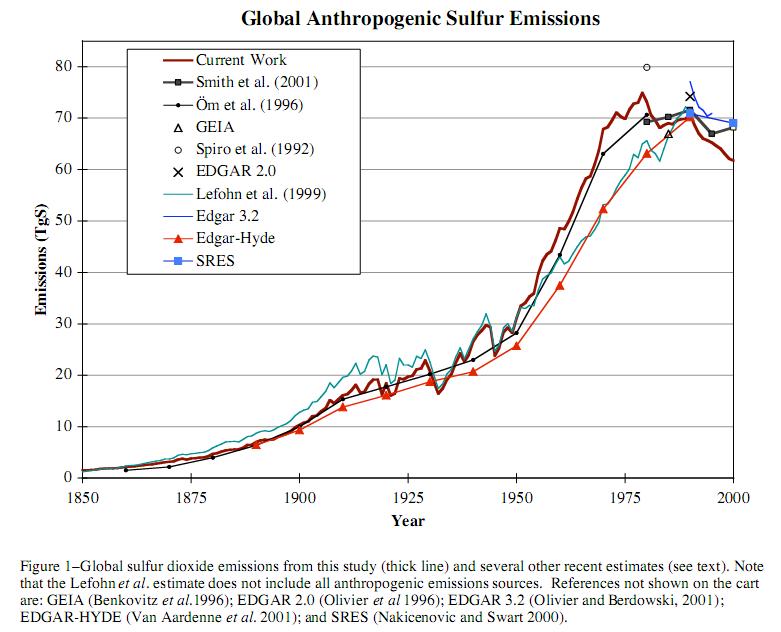
which certainly to come from a published source.
scaddenp @10.
Your graph is not unusual for SO2 graphs in that it stops at 2000. Coal-use has thankfully ceased its massive post-2000 rise and perhaps even peaked, as data from the BP 2016 review suggests.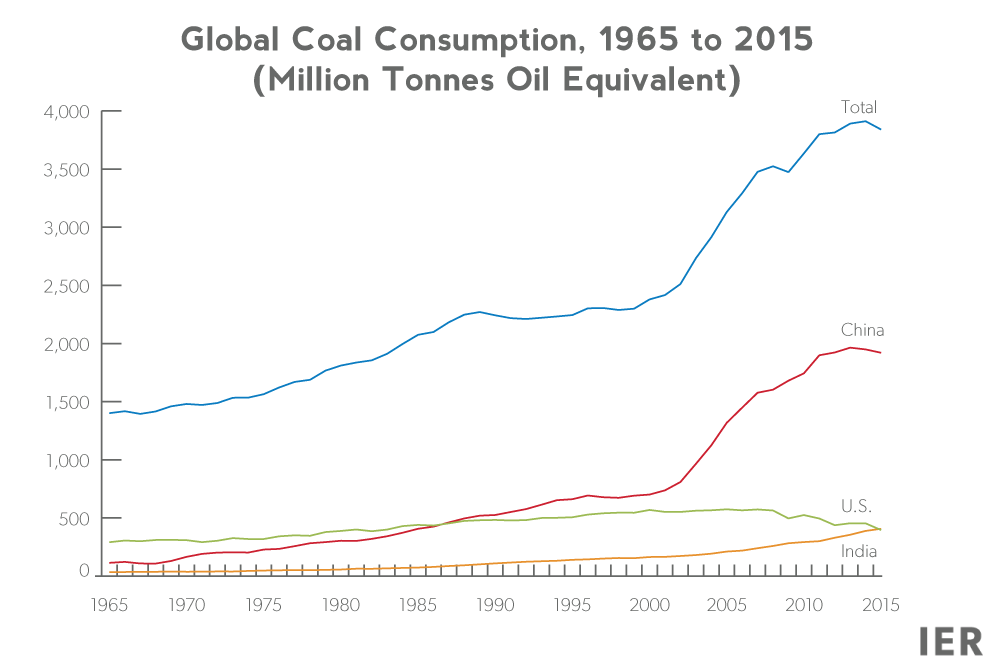 The stat is mirrored in CDIAC CO2 emission data (2000 - 2,413Gt(C), 2015 - 4105Gt(C), down 2% on 2014).
Thankfully, the post-2000 global SO2 emissions are not as dramatic as CO2 emissions, this graphic of SO2 from Klimont et al (2013) demonstrates.
And even more up-to-date is the NASA Global Sulfur Dioxide Monitoring Page which shows emissions 2005-14 from 500 locations around the globe and so allows analysis by latitude. It also splits emissions into electricity generation (totalling ~50%), smelters (~12%), FF (~12%), volcano (~25%). And it shows the monitored anthropogenic sources falling from 2007 (58 TgSO2) to 2014 (41 TgSO2). We can presumably expect this trend to continue for some years as SO2 emissions are further decoupled from coal use and coal-use hopefully also dropping substantially.
In the humour department comes this paper refuting the science of global warming:
(Full sized copy).