2019 SkS Weekly Climate Change & Global Warming Digest #38
Posted on 22 September 2019 by John Hartz
Story of the Week... Toon of the Week... Coming Soon on SkS... Climate Feedback Reviews... SkS Week in Review... Poster of the Week...
Story of the Week...
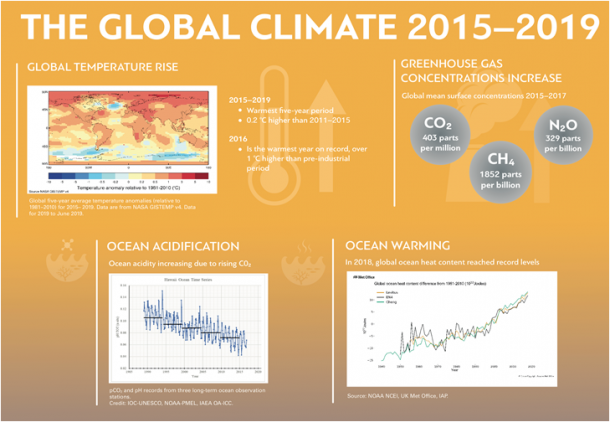
Global Climate in 2015-2019: Climate change accelerates
Record greenhouse gas concentrations mean further warming

The tell-tale signs and impacts of climate change – such as sea level rise, ice loss and extreme weather – increased during 2015-2019, which is set to be the warmest five-year period on record, according to the World Meteorological Organization (WMO). Greenhouse gas concentrations in the atmosphere have also increased to record levels, locking in the warming trend for generations to come.
The WMO report on The Global Climate in 2015-2019, released to inform the United Nations Secretary-General’s Climate Action Summit, says that the global average temperature has increased by 1.1°C since the pre-industrial period, and by 0.2°C compared to 2011-2015.
The climate statement – which covers until July 2019 - was released as part of a high-level synthesis report from leading scientific institutions United in Science under the umbrella of the Science Advisory Group of the UN Climate Summit 2019. The report provides a unified assessment of the state of Earth system under the increasing influence of climate change, the response of humanity this far and projected changes of global climate in the future. It highlights the urgency and the potential of ambitious climate action in order to limit potentially irreversible impacts.
An accompanying WMO report on greenhouse gas concentrations shows that 2015-2019 has seen a continued increase in carbon dioxide (CO2) levels and other key greenhouse gases in the atmosphere to new records, with CO2 growth rates nearly 20% higher than the previous five years. CO2 remains in the atmosphere for centuries and in the ocean for even longer. Preliminary data from a subset of greenhouse gas observational sites for 2019 indicate that CO2 global concentrations are on track to reach or even exceed 410 ppm by the end of 2019.
“Climate change causes and impacts are increasing rather than slowing down,” said WMO Secretary-General Petteri Taalas, who is co-chair of the Science Advisory Group of the UN Climate Summit.
“Sea level rise has accelerated and we are concerned that an abrupt decline in the Antarctic and Greenland ice sheets, which will exacerbate future rise. As we have seen this year with tragic effect in the Bahamas and Mozambique, sea level rise and intense tropical storms led to humanitarian and economic catastrophes,” he said.
“The challenges are immense. Besides mitigation of climate change, there is a growing need to adapt. According to the recent Global Adaptation Commission report the most powerful way to adapt is to invest in early warning services, and pay special attention to impact-based forecasts,” he said.
“It is highly important that we reduce greenhouse gas emissions, notably from energy production, industry and transport. This is critical if we are to mitigate climate change and meet the targets set out in the Paris Agreement,” he said.
“To stop a global temperature increase of more than 2 degrees Celsius above pre-industrial levels, the level of ambition needs to be tripled. And to limit the increase to 1.5 degrees, it needs to be multiplied by five,” he said.
Sea level rise:
Over the five-year period May 2014 -2019, the rate of global mean sea-level rise has amounted to 5 mm per year, compared with 4 mm per year in the 2007-2016 ten-year period. This is substantially faster than the average rate since 1993 of 3.2 mm/year. The contribution of land ice melt from the world glaciers and the ice sheets has increased over time and now dominate the sea level budget, rather than thermal expansion.
Shrinking Ice:
Throughout 2015-2018, the Arctic’s average September minimum (summer) sea-ice extent was well below the 1981-2010 average, as was the average winter sea-ice extent. The four lowest records for winter occurred during this period. Multi-year ice has almost disappeared.
Antarctic February minimum (summer) and September maximum (winter) sea-ice extent values have become well below the 1981-2010 average since 2016. This is in contrast to the previous 2011-2015 period and the long term 1979-2018 period. Antarctic summer sea ice reached its lowest and second lowest extent on record in 2017 and 2018, respectively, with 2017 also being the second lowest winter extent.
The amount of ice lost annually from the Antarctic ice sheet increased at least six-fold, from 40 Gt per year in 1979-1990 to 252 Gt per year in 2009-2017.
The Greenland ice sheet has witnessed a considerable acceleration in ice loss since the turn of the millennium.
For 2015-2018, the World Glacier Monitoring Service (WGMS) reference glaciers indicates an average specific mass change of −908 mm water equivalent per year, higher than in all other five-year periods since 1950.
Ocean heat and acidity:
More than 90 % of the excess heat caused by climate change is stored in the oceans. 2018 had the largest ocean heat content values on record measured over the upper 700 meters, with 2017 ranking second and 2015 third.
The ocean absorbs around 30% of the annual anthropogenic emissions of CO2, thereby helping to alleviate additional warming. The ecological costs to the ocean, however, are high, as the absorbed CO2 reacts with seawater and changes the acidity of the ocean. There has been an overall increase in acidity of 26% since the beginning of the industrial revolution.
Extreme events:
More than 90 % of the natural disasters are related to weather. The dominant disasters are storms and flooding, which have also led to highest economic losses. Heatwaves and drought have led to human losses, intensification of forest fires and loss of harvest.
Heatwaves, which were the deadliest meteorological hazard in the 2015-2019 period, affecting all continents and resulting in numerous new temperature records. Almost every study of a significant heatwave since 2015 has found the hallmark of climate change, according to the report.
The largest economic losses were associated with tropical cyclones. The 2017 Atlantic hurricane season was one of the most devastating on record with more than US$ 125 billion in losses associated with Hurricane Harvey alone. On the Indian Ocean, in March and April 2019, unprecedented and devastating back-to-back tropical cyclones hit Mozambique.
Wildfires
Wildfires are strongly influenced by weather and climate phenomena. Drought substantially increases the risk of wildfire in most forest regions, with a particularly strong influence on long-lived fires. The three largest economic losses on record from wildfires have all occurred in the last four years.
In many cases, fires have led to massive releases of carbon dioxide to the atmosphere. Summer 2019 saw unprecedented wildfires in the Arctic region. In June alone, these fires emitted 50 megatons (Mt) of carbon dioxide into the atmosphere. This is more than was released by Arctic fires in the same month from 2010 to 2018 put together. There were also massive forest fires in Canada and Sweden in 2018. There were also widespread fires in the non-renewable tropical rain forests in Southern Asia and Amazon, which have had impacts on the global carbon budget.
Climate change and extreme events
According to the Bulletin of the American Meteorological Society, over the period 2015 to 2017, 62 of the 77 events reported show a significant anthropogenic influence on the event’s occurrence, including almost every study of a significant heatwave. An increasing number of studies are also finding a human influence on the risk of extreme rainfall events.
Global Climate in 2015-2019: Climate change accelerates, WMO Press Release, Sep 22, 2019
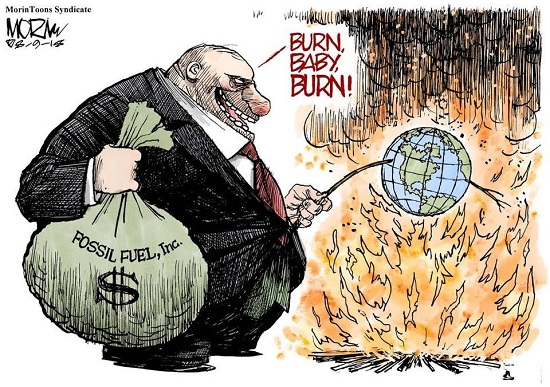
Toon of the Week...

Coming Soon on SkS...
- A brief guide to the impacts of climate change on food production (Daisy Simmons)
- Skeptical Science New Research for Week #38, 2019 (Doug Bostrom)
- How the Greenland ice sheet fared in 2019 (Ruth Mottram, Martin Stendel & Peter Langen)
- A small electric plane demonstrates promise, obstacles of climate-friendly air travel (Lindsay Fendt)
- What psychotherapy can do for the climate and biodiversity crises (Caroline Hickman)
- 2019 SkS Weekly Climate Change & Global Warming News Roundup #39 (John Hartz)
- 2019 SkS Weekly Climate Change & Global Warming Digest #39 (John Hartz
Climate Feedback Reviews...
[To be added]
Poster of the Week...

SkS Week in Review...
- 2019 SkS Weekly Climate Change & Global Warming News Roundup #38 by John Hartz
- The Consensus Handbook: download and translations by Baerbel
- Greta Thunberg is a painful reminder of decades of climate failures by Dana Nuccitelli (Bulletin of the Atomic Scientists)
- Skeptical Science to join the Global Climate Strike on September 20! by BaerbelW
- Skeptical Science New Research for Week #37, 2019 by Doug Bostrom
- 'Trollbots' Swarm Twitter with Attacks on Climate Science Ahead of UN Summit by Marianne Lavell (InsideClimate News)
- 2019 SkS Weekly Climate Change & Global Warming Digest #37 by John Hartz


 Arguments


The report "Global Climate 2015-2019" has a number of very useful graphs and other images. Does anyone know how I can get electronic copies of them?
Richieb,
GOOGLE suggests a PDF of the report is here
Michael Sweet
How are you? Nice to hear from you again. I have the PDF, but I cannot extract the images. I was hoping someone knew where to find them at another location.
[PS] Try here for suggestions on extracting images. Many images in that report are sourced from elsewhere so you could larger version by going to source.
Ritchieb,
Unfortunately, I am a dinosaur at extracting images.
I am doing well. I have moved off grid onto a sailboat and will be out of the country until December. I will infrequently post untill I am back.
Moderator
Thanks. I will try that.