2021 SkS Weekly Climate Change & Global Warming News Roundup #1
Posted on 2 January 2021 by John Hartz
Editor's Choice
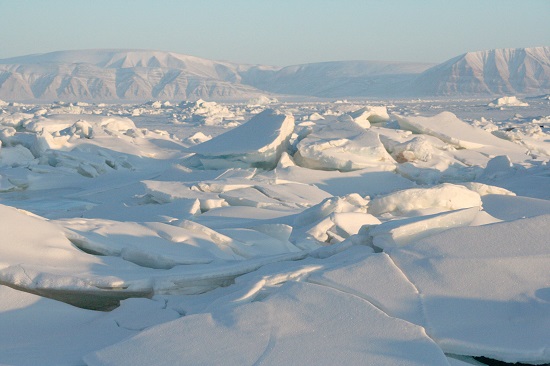
7 Graphics That Show Why the Arctic Is in Trouble

Arctic Sea Ice: NSIDC
It’s no secret that the Arctic is in trouble. And while the worrying state of the ice in the region has made numerous headlines this year, they’re just the latest twists and turns in a long-term trend.
One of the best gauges for putting what’s happening in the region into perspective is the National Oceanic and Atmospheric Administration’s Arctic Report Card, a compilation of environmental observations and analyses that the agency has been producing annually for 15 years. It was released earlier this month, providing an in-depth look at the Arctic’s struggles as the climate crisis reshapes the region. But if you’re more of a visual person, NOAA made these neat—although worrying—graphics to help get a handle on what’s happened this past year and how it fits into the bigger picture.
Join us as we take a dive into a series of graphics that highlight key findings of the Arctic Report Card, and explain why you should care about what happens up there.
Click here to access the entire article and slideshow as originally published on the Gizmodo website.
7 Graphics That Show Why the Arctic Is in Trouble by Jody Serrano, Slideshow, Gizmodo, Dec 31, 2020
Articles Linked to on Facebook
Sun, Dec 27, 2020
- Was 2020 The Year That EVs Hit it Big? Almost, But Not Quite by Nicholas Kusnetz, InsideClimate News, Dec 21, 2020
- Pakistan signals coal power exit, in potential model for China’s belt and road by Joe Lo, Climate Home News, Dec 16, 2020
- The Resistance: In the President’s Relentless War on Climate Science, They Fought Back by Marianne Lavelle, Science, InsideClimate News, Dec 27, 2020
- Video advertising “Powersave” device is misleading and makes impossible home power savings claims, Edited by Scott Johnson, Claim Review, Climate Feedback, Dec 27, 2020
Mon, Dec 28, 2020
- I'll be fierce for all of us': Deb Haaland on climate, Native rights and Biden, Interview by Nina Lakhani, Environment, The Guardian, Dec 27, 2020
- ANALYSIS-Climate could pay the price as Europe's nuclear plants age by Nina Chestney & Susanna Twidale, Reuters, Dec 21, 2020
- 'The most significant climate legislation ever': How stimulus bill tackles warming planet by Ledyard King, Politics, USA Today, Dec 27, 2020
- Activists Eye a Superfund Reboot Under Biden With a Focus on Environmental Justice and Climate Change by David Hasemyer & Lise Olsen, InsideClimate News, Dec 28, 2020
- Climate Change Led to Record Insurance Payouts in 2020 by Leslie Kaufman, Bloomberg Green, Dec 28, 2020
Tue, Dec 29, 2020
- Celebrating climate action during Kwanzaa by Heather McTeer Toney, Audio, Yale Climate Connections, Dec 28, 2020
- Religion Meets Climate Change by Robert Hunziker, Counter Punch, Dec 28, 2020
- Dad/daughter writers fear a warmer Minnesota future for their heirs by Bud Ward, Article, Yale Climate Connection, Dec 22, 2020
- ‘All-Out Offensive' Planned on Climate Bills in Mass., by Colin H Young, State House News Service/NBC10 Boston, Dec 26, 2020
Wed, Dec 30, 2020
- The 5 Biggest Climate Stories of 2020 by Robinson Meyer, The Weekly Planet, Science, The Atlantic Magazine, Dec 22, 2020
- Climate change: Extreme weather causes huge losses in 2020 by Matt McGrath, Science, BBC News, Dec 28, 2020
- Op-ed: How Joe Biden can tap the private sector to accelerate transition to clean energy, Opinion by Laura Tyson & Daniel Weiss, Politics, CNBC, Dec 29, 2020
- 2020 was meant to be the year of climate action. Instead, it crowned a wasted decade by Ivana Kottasová, CNN, Dec 30, 2020
Thu, Dec 31, 2020
- Bomb cyclone in northern Pacific Ocean may challenge all-time records by Jason Samenow, Capital Weather Gang, Washington Post, Dec 30, 2020
- Meatless meat is going mainstream. Now Big Food wants in. by Brian Kateman, Future Perfect, Vox, Dec 29, 2020
- Ahead of Georgia’s runoff elections for US Senate, what do young climate activists think? by Mekdela Maskal, Covering Climate Now/Bulletin of the Atomic Scientists, Dec 30, 2020
- Looking ahead: The top food and agriculture stories for 2021 by FoodPrint, Salon, Dec 31, 2020
Fri, Jan 1, 2021
- Apocalyptic Narratives, Climate Data, and Hope, with Zeke Hausfather and Diego Arguedas Ortiz by Jacquelyn Gill and and Ramesh Laungani, Warm Regards Podcast, Dec 28, 2020
- Researchers unveil new method for converting carbon dioxide into jet fuel by Dalvin Brown, Technology, Washington Post, Dec 31, 2020
- 2020 in Review: an interesting year for Skeptical Science by BaerbelW, Skeptical Science, Dec 29, 2020
- Covid-19 and Climate Change Will Remain Inextricably Linked, Thanks to the Parallels (and the Denial) by Ilana Cohen, InsideClimate News, Jan 1, 2021
Sat, Jan 2, 2021
- A Monster Wind Turbine Is Upending an Industry by Stanley Reed, Business, New York Times, Jan 1, 2021
- Yellowstone science forecasts climate change crunch for amphibians by Brett French, Billings Gazette, Dec 31, 2020
- 7 Graphics That Show Why the Arctic Is in Trouble by Jody Serrano, Slideshow, Gizmodo, Dec 31, 2020
- The pandemic taught us how not to deal with climate change by James Temple, Climate Change, MIT Technology Review, Jan 1, 2021


 Arguments


Comments