A Relentless Rise in Global Sea Level
Posted on 5 August 2014 by Rob Painting
- One of several confounding influences on global sea-level rise is natural multi-year, and decadal-scale, variation in water mass exchange between the oceans and land. This is due to weather patterns which affect the amount of rainfall and snow falling over the oceans and land surfaces. Weather-related variations in precipitation alter the volume of water in the ocean, but they are only temporary.
- Global sea level continues to rise, but in the last decade the rate of this rise has been slower than that of the previous decade.This slowdown has occurred despite an increase in the amount of heat entering the ocean, and a growing contribution of glacial meltwater from disintegrating land-based ice - creating an apparent paradox.
- A recent study, Cazenave et al (2014), reveals that sea level over the last two decades has in fact risen at an almost constant rate, but that this has been obscured by the temporary effect of smaller-than-average continental water mass storage from 1994-2002, and greater-than-average continental water mass storage from 2003-2011.
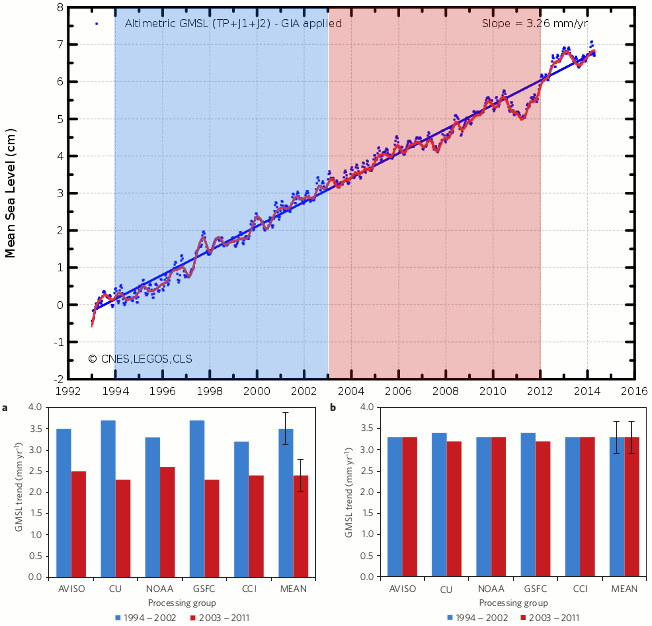
Figure 1 - 1993-2014 global sea-level rise from the AVISO data set (top) with 1994-2002 shaded blue and 2003-2011 shaded red. The lower figure (from Cazenave [2014]) shows a) the measured sea level trends of the five satellite altimetry data sets and their mean for the two periods, and b) the 'actual' sea level trend once corrected for weather-related ocean mass change (and thermal expansion fluctuations). The right-hand bars in b) demonstrate a near-constant rate of 'actual' sea-level rise over the two decades.
Some Background Context: Sea-Level Since the 19th Century
After the start of the Industrial Revolution, and due to the geologically-rapid increase in planet-warming gases such as carbon dioxide that accompanied it, global sea level began to rise. This most probably wasn't the case before the onset of human industrial activity, as a wealth of scientific evidence suggests the ocean volume was (effectively) static for 4-5000 years before this.
The reason for the rise in sea level since the 19th century is rather obvious - increased concentrations of greenhouse gases trap heat in the atmosphere and ocean. Seawater expands as it grows warmer, and extra water volume is being added to the oceans through the global-scale disintegration of land-based ice from warming. Not so obvious, however, is the fact that there is a large year-to-year variation in sea level due to fluctuations in the storage of water on land - be it as water or in the form of snow or ice.
Wrinkles in Sea-Level Rise
These annual fluctuations in continental water storage are largely driven by the El Niño-Southern Oscillation, as this coupled ocean-atmosphere phenomenon determines whether the bulk of precipitation falls over land or ocean. This topic is dealt with in more detail in the SkS Sea Level Fell in 2010 rebuttal, but briefly; during La Niña periods anomalous precipitation typically falls over land, and during El Niño it falls over the ocean.
Even less well-known than these year-to-year natural variations, is that variations in weather patterns can affect global sea-level trends at the scale of not just years, but decades (Ngo-Duc et al [2005]). If, for instance, one decade (or decades) concentrated more rainfall over land (La Niña-dominant, or the negative phase of the Interdecadal Pacific Oscillation [IPO]), this would obscure part of the 'actual' sea-level rise over that period. The opposite would occur during El Niño-dominant (positive IPO) periods as anomalous rainfall over the ocean, combined with drying continental basins, drain water mass back into the sea.
Neither annual, nor decadal-scale, fluctuations in continental water storage affect sea level in the long-term though, as they are driven by variations in weather, but they certainly do complicate determining the precise amount of sea-level rise due to global warming itself, i.e. the rise in global sea level through the addition of glacial meltwater, and the long-term warming of the ocean.
Sea Level Rise in the Last Decade: An 'Apparent' Paradox
Even though global sea level has very obviously risen in the last decade, several peer-reviewed scientific papers (Ablain et al [2009], Cazenave & Llovel [2010]) have remarked that the rate of sea-level rise over this period has slowed down. Given that the rate of heat uptake by the ocean has increased in recent decades (Von Schuckmann & Le Traon [2011], Levitus [2012], Nuccitelli [2012], and Balmaseda [2013]) and the contribution of glacial meltwater is accelerating (Rignot [2011]), this appears to be a paradox. How can the ocean take up more heat, and how can water be added to the ocean at a greater rate, and yet the apparent rate of sea-level rise decline? Part of the answer to those questions has been provided by a group of French sea-level researchers.
Paradox Lost
In Cazenave (2014) the study authors combined observations from the GRACE satellites, which are able to detect changes in water mass due to gravitational changes that it induces, along with satellite altimetry measurements of sea surface height. Cazenave (2014) looked at the period from 1994-2011, a time for which detailed satellite altimetry data is available, but, because the GRACE satellites only provide data back to 2003, the authors also made use of a global hydrological (water cycle) model to estimate continental water storage back to 1994. In order to gain a better understanding of the long-term change, the authors also filtered out the year-to-year fluctuations in global sea level due to year-to-year variations in heat uptake - in effect smoothing out the expansion of seawater due to the short-term thermal fluctuations.
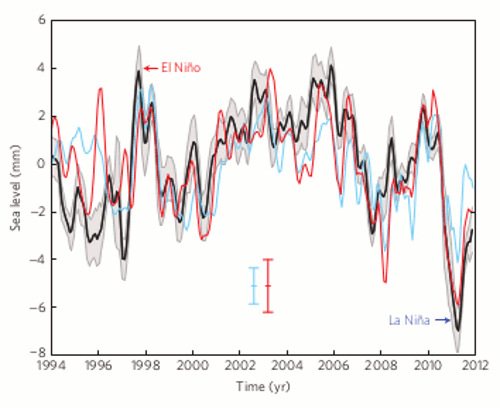
Figure 2 - Detrended global mean sea level between 1994-2011, i.e. the short-term component removed from the long-term global sea level trend. The black line is the average of the five satellite altimetry data sets, with the grey band the associated uncertainty. The light blue line is the hydrological model (land water plus atmospheric water vapour), and the red line the mass and (short-term) thermosteric components. The red & blue vertical bars in the centre are the uncertainty errors for each. Image from Cazenave (2014).
As can be seen in figure 2, the observed sea level trend is strongly biased by variations in continental water storage and short-term fluctuations in thermal expansion, however also see Figure 1 a) & b). Before 2003 these two components of sea-level inflate the rate of sea-level rise, but after 2003 these same two deflate the observed rate of sea-level rise. Removing this 'noise' from the global sea level trend yields a near-constant rate of sea-level rise for the entire period.
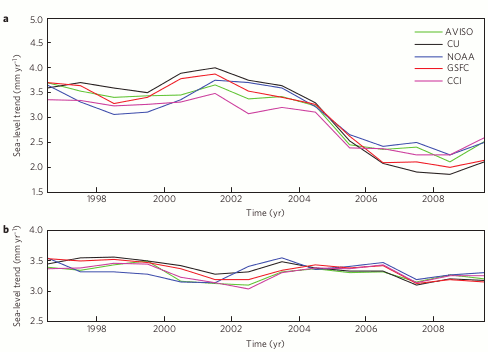
Figure 3 - Global sea level rate for the five satellite altimetry time series calculated over five-year-long moving windows. a) is the observed rate and b) is the rate once corrected for fluctuations in thermal expansion and continental water mass storage. Image from Cazenave (2014).
It should be noted though, that the authors did not include estimates of year-to-year variations in the mass balance of land-based ice, particularly the polar ice sheets of Greenland and Antarctica. The ongoing loss of ice mass is global in nature, but despite the long-term loss there are substantial annual variations in the mass balance because of fluctuations in snowfall in any given year can temporarily offset the loss of ice at the edges of the ice sheets/ice caps. Detailed global data for these fluctuations does not yet exist, but the annual variability implied by estimated changes in mass balance of the Antarctic ice sheet alone - over 300 billion tons of ice (over 0.86mm of sea level equivalent) - suggest that these fluctuations are not trivial.
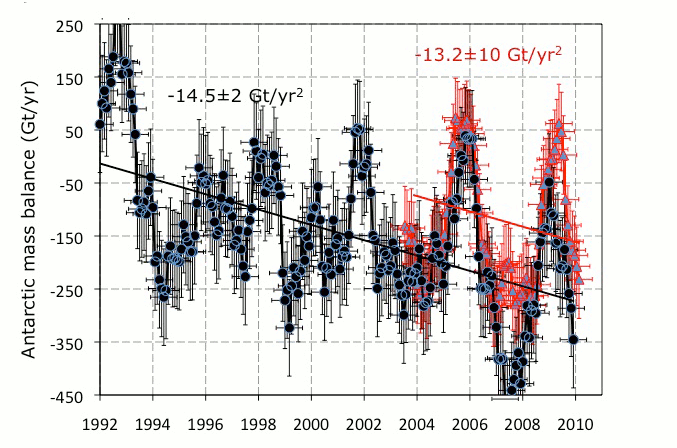
Figure 4 - estimated Antarctic ice sheet mass balance (in billions of tonnes (Gt) per year) for the period 1992-2010. Image adapted from Rignot (2011).
Pawses Are Still For Kittens & Puppies, Not Global Warming
Contrarians are a fringe element within scientific circles due to a distinct lack of evidence to support their claims. Most notably they are lacking in any coherent explanation for continued warming of the climate system. So the slower rate of 'observed' sea-level rise in the last decade has provided yet another opportunity for them to cherry pick (one of the five characteristics of scientific denial) the recent decade in order to insinuate a slowdown in global warming. Contrarians did a similar thing with the sea level fall in 2010 - but that 'pothole' in global sea level was short-lived.
Not only does the continued warming of the ocean and atmosphere refute the notion of a pause, but the analysis by Cazenave (2014) does too, as part of this continued rise is due to thermal expansion (i.e. warming). But the data analyses do raise an interesting question: why is the 'actual' rate of global sea-level rise near-constant when glacial meltwater entering the ocean is accelerating, and there has been a large increase in ocean heat content?
A complete and thorough answer to that question is not yet available, see the above discussion about land-ice fluctuations for instance, but the question overlooks the actual evolution in ocean heat content over recent decades. Although the oceans have certainly warmed much faster in the last 16-17 years, the interval of the so-called pause, than the previous 16-17 years, the rate of uptake of heat by the ocean has not been constant from year-to-year. Once again annual and multi-year fluctuations exert a strong influence on short-term trends and it therefore depends upon which time frame is being examined.
Consider the evolution of ocean heat content in Balmaseda (2013) - arguably the best estimate of ocean warming to date (Figure 5). The interval between 2001-2004/2005 saw an enormous, and as yet unexplained, surge in heat uptake in the tropical oceans. After 2004-2005 the rate of heat uptake by the oceans slowed down. The two time periods, 1994-2002 and 2003-2011, happen to straddle this interval from 2001-2004/2005, greatly affecting the ocean warming rates over these short time frames. A short-term acceleration of ocean warming, followed by a deceleration, is broadly consistent with the analysis by Cazenave (2014), taking into consideration the acceleration of land-ice contribution to ocean volume. The reduction in thermal expansion has probably been counteracted by the increase in water mass.
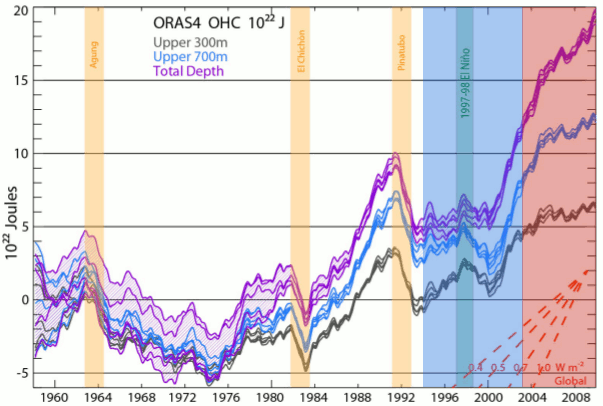
Figure 5 - Ocean warming as depicted by Balmaseda (2013). The blue-shaded column highlighting the 1994-2002 period and red-shaded column the 2003-2009 period. Even without statistical analysis (and the data isn't readily available) it is obvious the ocean heat uptake increases during the earlier interval and tapers off during the latter - general trend evident in two other ocean heat content data sets.
And Like Celine Dion's Heart, Sea-Level Rise Goes On....
Global sea-level rise may appear to have decelerated during the last decade, however smaller-than-average continental water storage during 1994-2002 combined with greater-than-average continental water storage during 2003-2011 has largely created this false impression. Once corrected for this, and for thermal expansion fluctuations, we find that the 'actual' rise in global sea-level has been near-constant at 3.3 +/- 0.4mm per year.
Warming of the planet is of such a scale that future sea-level rise is inevitable (Meehl (2012). The oceans will take centuries to fully respond to the greenhouse gas-forced warming of the Earth, and the vast polar ice sheets are likely committed to at least partial disintegration. This means that not only will sea level continue to rise, but is almost certain to greatly accelerate at some point. In spite of this, sea-level rise is also bound to exhibit year-to-year fluctuation and even decadal-scale fluctuation, due to the influence of weather. Even the likely future collapse of the West Antarctic ice sheet (Joughlin [2014, Rignot [2014]), will not change that. Don't be surprised, though, if these short-term trends are exploited by contrarians to deny the obvious.


 Arguments


It's interesting that you comment that the rapid rise in ocean heat content during the period 2001-2004/5 is unexplained. I think that Hansen et al.
J. Hansen et al.: Earth’s energy imbalance and implications (p.13439)
attributed at least some of the rise to a bounce back from the preceding period (1991-2000) where ocean heat content fell.
In the paper, the mechanism for this heating was described as:
"The physical origin of the rebound is simple. Solar heating of Earth returns to its pre-volcano level as aerosols exit the stratosphere. However, thermal emission to space [from the ocean's surface] is reduced for a longer period because the ocean was cooled by the volcanic aerosols."
Is that hypothesis valid? What are the alternate explanations?
[Rob P] - As far as explanations go, it's not really much of an explanation. The Mt Pinatubo eruption would certainly have played a role, but a whole lot more detail is needed to qualify as a possible explanation.
Good presentation. But isn't the larger point that 20 years is not long enough to accurately chart anything? It's nice to be able to be able to identify some of the factors that go into natural variation here. But really, 20 years?
Isn't it true that if you take a slightly longer time frame (and anything longer that 20 years would surely be more appropriate), that there has actually been an acceleration in the rate of global warming? 1990 or so actually seems to be something of an inflection point, with the rate twenty years before it being about half that of the rate over the following twenty years or so.
LINK
[PS] Fixed link.
The length of time required to draw inference about a trend depends on the amount of noise (variability) compared to magnitude of trend. 20 years is short for surface temperature but long for sea level.
[RH] Shortened link.
So many arguments for and against.
I have concerns, mainly due to the excessive amount of carbon now in the atmosphere compared to past low levels.
But then again, am I worried over nothing, and the Earths systems can cope with these levels, and all will be well.
Who knows !!
One end of the argument is depicted by this cartoon . . . . .
http://cartoonmick.wordpress.com/editorial-political/#jp-carousel-891
Cheers
Mick
[JH] Activated link.
I thought warmer air holds more moisture. Wouldn't increased atmospheric heating carry water vapor sufficient to affect sea level?
If we have deluge rainstorms that can release many inches of water, wouldn't there be some quatifyable increase of water removed from oceans??
[Rob P] - The caption in Figure 2 does mention that the comparatively small increase in atmospheric water vapour is included in the calculations of Cazenave et al (2014). So this effect, albeit small so far, is accounted for.
As for your 2nd question, yes, that certainly seems likely and is something I've mentioned in previous posts - these fluctuations could increase in magnitude as the Earth grows warmer. The atmosphere, in the absence of changes in the large-scale circulations, should be able remove and dump more water on land during La Nina-dominant (negative Interdecadal Pacific Oscillation) periods, and during La Nina events themselves.
In the last 4-5 years the magnitude of the year-to-year variation in global sea level seems to have gone up quite a few notches - which suggests that the large-scale circulations are playing role as well.
The atmosphere isnt a very large reservoir. On the other hand, moving enough water from sea to land can indeed lower sea level as it did in 2011.
See "The 2011 La Niña: So strong, the oceans fell"
r.pauli:
Yes, warmer air is capable of holding more moisture. The relationship is roughly exponential.
At cold temperatures (say, -30C), the air holds little moisture and large changes in temperature don't change that capacity by much. You don't see much snow falling at cold temperatures, because there isn't much moisture and you can't get much out for a given decrease in temperature.
At warmer temperatures (say +30C), the capacity is much higher, and small changes in temperature make a much bigger difference. A little bit of cooling leads to significant condensation, which lleads to thick clouds and lots of potential for heavy rain.
First of all, I'd like to thank you all for the information you provide here on a daily basis. Second, I'd like to say that I am in no way scientific or have a degree in the sciences. However, I do have a very inquisitive mind, especially when it comes to the effects that human interactions has on the Earth. The question I wish to pose in regards to sea level rise and warmth is whether the large scale nuclear testing that has been conducted at sea over the years has contributed and whether such anthropogenic factors are considered in the models. Would this have a significant impact on sea level temps and rise? Again, please forgive me if this question is a silly one to ask here.
Stardustoz - if you look to the right of this comment, you will see the heat widget. Currently heat gain is equivalent to more than 2 billion Hiroshima bombs since 1998 - so no - the heat release from bombs is insignificant compared to the extra solar trapped from GHG accumulations.
My thoughts these days go to implications. 3.3 mm is a global average and there are strong regional variations, or so I read. At that rate in 10 years its 3.3 cm and in 100 years .33 of a metre. In the end I wonder how much of an issue that is?
This leads to another question of how much future sea level rise is locked in? If we magically reduced excess CO2 output tomorrow for how much longer would sea levels rise?
My third question is that we have seen in recent years a slower rate of growth in surface air temperature (now about 5% higher than the 20th century mean) and a slower rate of growth in sea level rise. El Nino is invoked as a partial explanation for both. Do we see a similar development in the rate of change in water acidity?
[Rob P] - No, El Nino does not explain the slower warming rate in surface air temperatures in the 21st century. Stronger and more frequent La Nina, however, are only a partial explanation - see Climate Models Show Remarkable Agreement with Recent Surface Warming for instance.
La Nina is dominant during the negative phase of the Interdecadal Pacific Oscillation [IPO]. As the spin-up of the wind-driven ocean circulation is able to mix more heat down into the ocean (mainly the Western Pacific & the subtropical ocean gyres), and draws up more cool water from below the thermocline in the eastern tropical Pacific, we get this stronger ocean warming/weaker surface warming pattern.
It so happens that the trade winds connected with the current negative IPO have been exceptionally intense, and have thus temporarily counteracted the strong greenhouse gas-forcing during this century. See England et al (2014).
The processes involved in sealevel rise, especially ice melt are non-linear. What models we have for sealevel rise predict accelerating. This post at Realclimate links to many of the relevant papers.
"and a slower rate of growth in sea level rise". Um I am not seeing that. Do mean the pothole in 2011? That La Nina moving water onto land, not any reducing rate in ice loss.
Acidification is tightly bound to concentration of CO2 in atmosphere, completely independent of surface temperature, and no, no reduction in that.
As for locked-in sealevel rise, the sea will stop rising when the ice stops melting. If temperatures stopped rising tomorrow, then you would still get more glacier melt since so many are out of balance with current temperature, but you would expect rate of rise to decline. A recent paper on West Antarctica ice sheet suggests it may be too late with warmer ocean already doing the damage.
@Rob P,
You linked me to the paper Balancing the sea level budget - Leuliette & Willis (2011) which I gave a quick read.
The paper explains “Using GRACE measurements alone, for regions near coasts, it is impossible to distinguish whether gravity variations are influenced by water changes on land or in the ocean.” I was thinking sea level rise could be slowing because the sea water is progressing inland. A example can be seen in the diagram below.
If you treat the coast as a barrier you could get sea level rise A but if you include sea water inundation of coastal areas you could get sea level rise B.
Another factor I dont think is discussed in the paper is if the amount of cold water from melting ice is reducing thermal expansion?
This is the image below
I appreciate the diagram, but the on the scale of world oceans, the expansion of the basin surface area associated with the rise is pretty tiny, especially compared to ocean depth.
For GRACE, the expansion of ocean due to rising sea level is impossibly tiny at that resolution. The bigger issue is changes in the freshwater storage on land.
Michaele Whittemore @11&12, the length of the worlds coast line has been quoted as being 1.635 million kilometers long (the longest estimate I could find, although a smaller scale would result in a longer estimate). The world's oceans have an area of 361.162 million km^2. So, even if 2 meters of sea level rise flooded an average of a kilometer back from the shore around the world, it would only flood 0.5% of the ocean surface area. In percentage terms, that is well below the observational error for measuring sea level rise, and can be neglected.
There was a poster at the 2014 AGU meeting that calculated the effect on albedo of flooding of coastal areas. Because the sea tends to be darker than the land, this leads to a (very) slight positive feedback.
Michael Whittemore... Think of the oceans this way: The Pacific Ocean is averages about 3 miles deep, but it's about 8000 miles wide. If the Pacific were a sheet of writing paper the depth of ocean would roughly be the thickness of the paper.
Rob @16, XKCD illustrates it best:
Note the insets of Mauna Loa and the Marianas Trench with "accurate" horizontal scale (= same scale for horizontal and vertical).
Thank you for all the replys