A new resource - high rez climate graphics
Posted on 14 December 2010 by John Cook
Graphics used in science communication are often complicated and overburdened with details, trying to provide as much information as possible. But when you're communicating science to a broad audience, your visuals need to contain just the bare minimum required to get the message across. Cram too much detail in there and your meaning can get lost in a sea of factoids. So often when I scratch around for good climate graphics to communicate the required message, I can't find anything simple enough and am forced I create my own. As the number of visuals at Skeptical Science have built up over time, I often get asked for high rez versions for powerpoint presentations or print publications. Especially since The Scientific Guide to Global Warming Skepticism was released. So to make things easier for everyone (and let's be honest, to save me time in the long run), I've created a new resource: Climate Graphics by Skeptical Science, featuring high rez versions of the original graphics created at Skeptical Science.
All the graphics are licensed under a Creative Commons Licence so everyone is welcome to use them in any non-commercial use (and for commercial use, just contact me for permission). For each graphic, I've included a JPEG typically 1024 pixels wide, suitable for use in Powerpoint presentations. For those printing on paper, I've included Window Metafiles. These are in vector form so they print at high resolution at any size (yep, a Skeptical Science graphic would look great on a billboard). I'll also try to include Excel spreadsheets of the data and links to the data sources whenever possible (e.g. - if I'm not too busy and can be bothered).
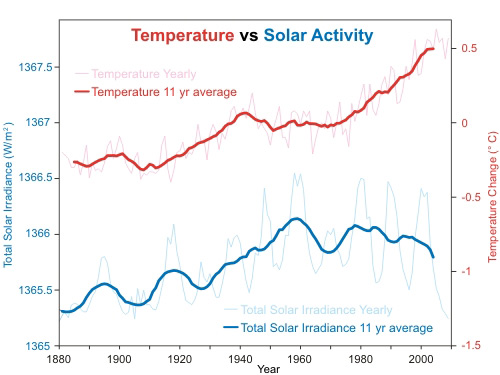
So far, I've only uploaded a handful of graphics - the easier ones that I had lying around in a handy format. I slightly reformatted the Solar Activity vs Global Temperature graph and added some details on where the data came from. The spreadsheet also includes all the raw data:
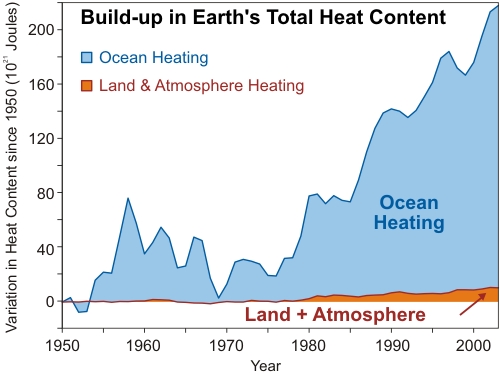
Similarly, when uploading the Total Heat Content graph, I also included some details on where the data came from (I often get asked about this) and also uploaded the spreadsheet (note - the Excel spreadsheet has slightly different formatting to the final version - I did some visual tweaking after exporting from Excel):
I plan to add more graphics steadily over time. When putting together The Scientific Guide to Global Warming Skepticism, I finally figured out how to export graphs from Excel into vector format (by printing to a PDF) so I'd like to go through all my old graphs and create nice sharp, Windows Metafile versions.
I may also set up a feature allowing Skeptical Science translators to add translated versions of each graphic - that'll come in version 2 :-)


 Arguments


http://www.skepticalscience.com/solar-activity-sunspots-global-warming.htm