Climate Science Glossary

Term Lookup

Enter a term in the search box to find its definition.

Settings

Use the controls in the far right panel to increase or decrease the number of terms automatically displayed (or to completely turn that feature off).

Term Lookup

Settings


All IPCC definitions taken from Climate Change 2007: The Physical Science Basis. Working Group I Contribution to the Fourth Assessment Report of the Intergovernmental Panel on Climate Change, Annex I, Glossary, pp. 941-954. Cambridge University Press.

Home Arguments Software Resources Comments The Consensus Project Translations About Support

Bluesky Facebook LinkedIn Mastodon MeWe

Twitter YouTube RSS Posts RSS Comments Email Subscribe


Climate's changed before
It's the sun
It's not bad
There is no consensus
It's cooling
Models are unreliable
Temp record is unreliable
Animals and plants can adapt
It hasn't warmed since 1998
Antarctica is gaining ice
View All Arguments...


Username
Password
New? Register here
Forgot your password?

Latest Posts

Archives

ACRIM vs PMOD, the rematch

Posted on 2 November 2009 by John Cook

In March 2008, we examined the long term solar trend over the last 30 years. There are two major reconstructions of Total Solar Irradiance (TSI) - ACRIM and PMOD. The ACRIM composite shows a slight warming trend. PMOD shows slight cooling. Independent measurements of solar activity are a useful referee to determine which is more accurate. UV levels and solar magnetograms all indicate a slight cooling trend, consistent with PMOD. However, in March 2009, Scafetta 2009 claimed a TSI reconstruction by Krivova & Solanki confirmed the ACRIM composite (h/t to HealthySkeptic for the heads up in June). I contacted Sami Solanki who informed me that their official response was currently awaiting publication. The paper was finally published a few weeks ago.

The paper is ACRIM-gap and total solar irradiance revisited: Is there a secular trend between 1986 and 1996? (Krivova 2009). To briefly summarize the ACRIM/PMOD dispute, solar activity has been measured by satellites since 1979. However, there isn't one single satellite that has continuously measured TSI over the last 30 years. Instead, scientists have had to piece together different measurements from various satellites into a single composite data series. The main disagreement is the handling of data between 1989 and 1991. This is a 2 year gap between the ACRIM I and ACRIM II data series, labelled the "ACRIM Gap".
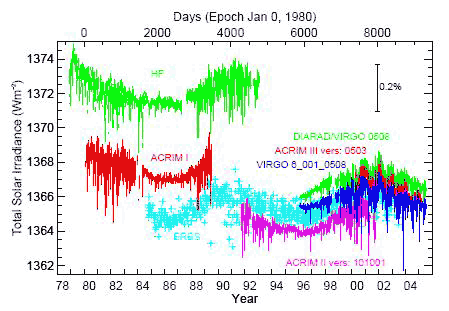
TSI raw satellite data - ACRIM, PMOD, VIRGO, ERBS, HF
Figure 1: daily averaged values of the TSI from radiometers on different space platforms since November 1978.

The ACRIM composite by Scafetta and Willson finds that TSI increased over the ACRIM gap. The PMOD composite finds that TSI stayed relatively level. The result is that ACRIM shows a slight warming trend while PMOD shows a slight cooling trend. Is there an independent analysis that can confirm which composite is more accurate? In Scafetta 2009, the authors compare their ACRIM composite to the SATIRE model. This is a model of TSI created by Krivova and Solanki.

There are several versions of the SATIRE model, each developed from different data and optimised for different time scales. For periods after 1974, they calculate TSI values based on daily measurements of solar magnetograms. For longer periods going back centuries, they used sunspot numbers to reconstruct TSI. When parsing sunspot data, averages over several months must be used. Therefore, the sunspot model is significantly less accurate than the magnetogram model on short time scales.

Scafetta 2009 used the sunspot model in their analysis. By design, the sunspot model is suitable for decadal to centennial scales but significantly less accurate on time scales of months. The more appropriate model is based on daily measurements of solar magnetograms. Therefore, Krivova and Solanki take the next logical step and analyse the TSI results from the magnetogram model over the ACRIM gap. What they found was TSI does not increase over this period. Thus the SATIRE model is independent confirmation that the PMOD composite is the more accurate representation of solar activity.

What relevance does this have for the global warming debate? Not terribly much. We're talking about a very slight warming sun versus a very slight cooling sun. Either TSI reconstruction show a stark break down in correlation between sun and climate in the mid 1970's. But the evidence points towards the sun showing a long term cooling trend. Even if solar variations are amplified by cosmic ray modulation and other phenomenon, this means the sun has actually been masking the global warming experienced over the past 30 years.

Note: for a more detailed overview of the ACRIM/PMOD controversy, see "The Sun is getting hotter".

0 0

Printable Version  |  Link to this page

Comments

Comments 1 to 10:

  1. Thanks for posting that. Another recent paper that addresses this same point is: M. Lockwood and C. Fröhlich (2008) Recent oppositely directed trends in solar climate forcings and the global mean surface air temperature. II. Different reconstructions of the total solar irradiance variation and dependence on response time scale Proc. R. Soc. A 464, 1367-1385 http://rspa.royalsocietypublishing.org/content/464/2094/1367.abstract This addresses the "ACRIM gap" from a different perspective, and shows that the PMOD analysis is not only more consistent with observational evidence and the Wenzler/Solanki analysis (that you refer to), but that if the ACRIM stitching of the "ACRIM gap" were to be correct, that this would essentially overthrow everything that solar science understands about the relationship between solar irradiance and other solar parameters, and between solar parameters and earth climate. e.g. Lockwood and Frolich state:
    Here, we point out that the TSI modelling of Wenzler et al. (2006) from ground-basd magnetograms is also consistent with the PMOD composite and inconsistent with ACRIM and IRMB. The great accuracy of this modeling, and the fact that the facular filling factor is the only free parameter,means that it provides an excellent test. In addition we point out that the ACRIM composite generates some curious phenomena thatwould need explanation. For example, if the ACRIM composite were correct, the strong negative correlation between TSI and GCR fluxes over the solar cycle, for which we have a physcal explanation, would reverse polarity on longer time scales for reasons we do not understand. This would invalidate almost all previous evidence for solar effects on climate on time scales longer than the solar cycle.
    and:
    Extrapolating the long-term drift in TSI required by the ACRIM composite would imply that non-cyclic stars were actually brighter than the cyclic ones and that Am was negative (i.e. the Sun was brighter in the Maunder minimum than now). Note also that the trend in the ACRIM composite on time scales greater than the solar cycle is exactly the opposite to what is asumed in palaeoclimate studies that employ cosmogenic isotopes generated by cosmic ray bombardment of the atmosphere as an inversely correlated proxy for TSI (e.g. Bond et al. 2001; Neff et al. 2001).
    In essence the physical world does make sense, which is why science is such a successful enterprise...
    0 0
  2. http://www.fel.duke.edu/~scafetta/pdf/Scafetta-JASP_1_2009.pdf N. Scafetta 2009 is “Empirical analysis of the solar contribution to global mean air surface temperature change,” Journal of Atmospheric and Solar-Terrestrial Physics (2009), doi:10.1016/j.jastp.2009.07.007 “The sun may have caused from a slight cooling, if PMOD TSI composite is used, to a significant warming (up to 65% of the total observed warming) if ACRIM, or other TSI composites are used.” http://pielkeclimatesci.wordpress.com/2009/08/03/nicola-scafetta-comments-on-solar-trends-and-global-warming-by-benestad-and-schmidt/ Nicola Scafetta Comments on “Solar Trends And Global Warming” by Benestad and Schmidt http://dpnc.unige.ch/ams/ICRC-07/icrc1243.pdf McCracken, K. G. (2007), Heliomagnetic field near Earth, 1428–2005, J. Geophys. Res., 112, A09106, doi:10.1029/2006JA012119
    0 0
  3. To me this is one of the many examples that clearly show how the scientific knowledge can be obtain just putting together several pieces ov evidence. The single ACRIM/PMOD issue is not particularly intriguing, "Not terribly much" indeed, and more technical than scientific. But this site is devoted to discussions on whatever irrelevant or false claim is made on the skeptic side. What is looks really weird is that Scafetta 2009 uses the SATIRE model to bridge the few years of the ACRIM gap when the model by itself do not show any long term increase. Does this mean that SATIRE works only for those few years? ;)
    0 0
  4. Thanks again for a very informative post. New studies go on confirming that PMOD seems more reliable. Anyway, I had also read elsewhere that the temperature difference between using ACRIM or PMOD would be very little, that's why I still wonder how Scafetta gets that 65 % (mentioned by clayco) if ACRIM was used (?): "Since 1980 the solar contribution to climate change is uncertain because of the severe uncertainty of the total solar irradiance satellite composites. The sun may have caused from a slight cooling, if PMOD TSI composite is used, to a significant warming (up to 65% of the total observed warming) if ACRIM, or other TSI composites are used" http://www.fel.duke.edu/~scafetta/pdf/Scafetta-JASP_1_2009.pdf Do you know any paper or blog post where it's been addressed? Thnks!
    0 0
  5. PeterPan, Scafetta, in the paper you link to uses (in my opinion) a sleight of hand based on false premises to come up with an extraordinaly high climate sensitivity to solar forcing, to arrive at the ("up to 65%") value that you reproduce. He analyses different Empirical Solar Signature ("ESS") parameterizations (ESS1 and ESS2) to attempt to match the solar variability to climate (temperature)variability. He finds that according to his ESS1 parameterization (fast climate response to solar forcing and thus small climate sensitivity to solar forcing), the solar variation cannot account for preindustrial temperature variation (he seemingly considers "preindustrial" to mean pre-1900), and therefore choses a model (ESS2) with a slow response time and very large temperature response to solar forcing. His error is one shared by a couple of the dull selection of papers he cites, namely he makes an a priori assumption that all "pre-industrial" temperature variation is solar-induced, and thus he has to swell the solar contribution to attempt to match this. This is obvously wrong. It's quite well characterised that some of the warming from the LA to 1900 warming was due to reducrion of volcanic (negative) forcing (say 0.l oC) and the change in CO2 concentration from pre-industrial levels (around 276 at the LIA) to 1900 (~300 ppm) should give around 0.35 oC warming at equilibrium within the middle of the range of climate sensitivity (3 oC of warming per doubling of CO2). Let's say that 0.25 oC of this was realized by 1900. So we expect that around 0.35 oC of the warming from the bottom of the LIA to 1900 was volcanic/greenhouse-induced. The Moberg temperature reconstruction that Scafetta "fits" to (see Scafetta's Figure 6), gives around 0.35 oC of warming from the bottom of the LIA to 1900. So there isn't any need to "pump up" the climate response to solar variability to ludicrous proportions in an attempt to "fit" solar variability to a particular temperature reconstruction, and the solar contribution to temperature variability determined by proper solar scientists (Lean, Frolich, Solanki, Lockwood etc) is likely to be correct (e.g. perhaps 0.10 C warming Maunder Minimum (MM) to 1900 or 0.2 oC MM to 1950)...
    0 0
  6. One thing to add to chris comment. The trick to artificially pump solar sensitivity in the model is to use a "slow" time constant as short as possible and similar to the solar cycle, 8-12 yr in the paper. Where does this number come from? Is it realistic? The number comes from Schwartz 2007 JGR 112, D24S05 which has been shown to grossly underestimate it (Foster et al 2008 JGR 113, D15102). Also, it looks quite unrealistic given that it represent the time it takes to the climate system to reach equilibrium.
    0 0
  7. Loads of thanks, chris & Riccardo!! Your answers have been very quick, clear and helpful! :) Thanks!
    0 0
  8. @ Peter Pan http://pielkeclimatesci.wordpress.com/2009/08/03/nicola-scafetta-comments-on-solar-trends-and-global-warming-by-benestad-and-schmidt/ "Benestad and Schmidt apparently do not know that since 1978 Lean 1995 as well as Lean 2000 do not differ significantly from PMOD because PMOD was build (by altering the published TSI satellite data) by using Lean 1995 and Lean 2000 as guides. Moreover, we also merge the Lean data with ACRIM since 1978 to obtain an alternative scenario, as it is evident in all our papers. The discontinuity problem addressed by Benestad and Schmidt in merging two independent sequences (Lean’s proxy model and the ACRIM) is not an issue because it is not possible to avoid it given the fact that there are no TSI satellite data before 1978." Nicola Scafetta
    0 0
  9. solar magnetograms? http://www.iop.org/EJ/article/1755-1315/6/9/092016/ees9_6_092016.pdf?request-id=8e517d78-d0ca-42ea-8628-27ee1c1f3eca Katya Georgieva “The role of the sun in climate change” Earth and Environmental Science 6 (2009) 092016 doi:10.1088/1755-1307/6/9/092016
    0 0
  10. Clayco, look at the cites in that paper. It's speculative. It ends with a supposition, a what-if. What remains is for someone to find a way to establish the existence (measure, identify, show, detect) of those supposed effects. Show they happen, measure them. Remember, for a "god-in-the-gaps" explanation, you need two of them, you need _both_ 1) show the hidden cause working, and 2) find an explanation that counteracts the known causes already accounted for. You need to subtract the known causes with some unknown force taking them out, then replace them with the same amount of effect from the newly revealed cause. ----excerpt----- ... Its effect on climate is supposed to be through modulation of the cosmic rays flux which affects stratospheric ozone and small constituents (Veretenenko S.V., Pudovkin M.I., J. Atm. Solar-Terr. Phys., 61, 521, 1999), and/or aerosol ionization (Marsh N., Svensmark H., Space Sci. Rev., 107 (1), 317, 2003), and/or the global electric circuit (Tinsley B.A. et al., Adv. Space Res., 40 (7), 1126, 2007), and finally the transparency of the atmosphere. However, the mechanism is not quite clear, and is not included in any climate simulation model ...." If you go and look at each of those papers, follow the "citing papers" forward in time. The supposed mechanisms are less than "not quite clear" in each case. The unstated supposed mechanism that counteracts the known forcings is also not discussed at all.
    0 0

You need to be logged in to post a comment. Login via the left margin or if you're new, register here.


The Consensus Project Website

THE ESCALATOR

(free to republish)


© Copyright 2024 John Cook
Home | Translations | About Us | Privacy | Contact Us