Accelerating ice loss from Antarctica and Greenland
Posted on 29 October 2009 by John Cook
One of the greatest uncertainties in climate models is predicting the behaviour of positive feedback systems. An example is the loss of ice mass from the ice sheets on Greenland and Antarctica. As temperatures warm, ice melts contributing to sea level rise. However, water also lubricates the base of the ice sheets, causing the ice to slide faster as it calves into the ocean. The IPCC AR4 report in 2007 was conservative in incorporating these mechanisms in their modelling. Consequently, they didn't predict a large contribution from Greenland and Antarctica to sea level rise over the century.
As new data comes in, we can assess the behaviour of the ice sheets to gain a clearer understanding of how the ice sheets behave. A new paper Increasing rates of ice mass loss from the Greenland and Antarctic ice sheets revealed by GRACE (Velicogna 2009) analyses the latest results from the GRACE satellite data to discern the trend in mass change in the Antarctic and Greenland ice sheets.
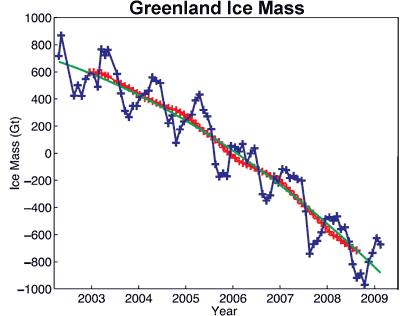
Figure 1 shows the ice mass changes in Greenland for the period April 2002 to February 2009. The blue line/crosses show the unfiltered, monthly values. The red crosses have seasonal variability removed. The green line is the best fitting quadratic trend.

Figure 1: Time series of ice mass changes for the Greenland ice sheet estimated from GRACE monthly mass solutions for the period from April 2002 to February 2009. Unfiltered data are blue crosses. Data filtered for the seasonal dependence using a 13-month window are shown as red crosses. The best-fitting quadratic trend is shown (green line).
Antarctic ice mass loss is more complicated. While West Antarctica is showing strong warming and ice mass loss, the Eastern land mass is in approximate mass balance. This is because while East Antartica is losing ice at the edges, it's gaining ice in the interior. Nevertheless, overall the continent is losing ice mass as seen in Figure 2.

Figure 2: Time series of ice mass changes for the Antarctic ice sheet estimated from GRACE monthly mass solutions for the period from April 2002 to February 2009. Unfiltered data are blue crosses. Data filtered for the seasonal dependence using a 13-month window are shown as red crosses. The best-fitting quadratic trend is shown (green line).
For both ice sheets, the mass loss is accelerating with time. To discern the long term trend, the best fitting estimate was a quadratic trend that found that Greenland was losing an extra 30 Gigatonnes/yr2. In other words, the contribution to sea level rise from Greenland is accelerating at a rate of 0.09 mm/yr2. This means that Greenland's mass loss doubled over the 9 year period.
Similarly, Antarctic ice mass loss is accelerating at a rate of 26 Gigatonnes/yr2. This is equivalent to an acceleration of sea level rise at the rate of 0.08 mm/yr2. Antarctic mass loss increased by 140% over the 9 year period. The combined contribution of Greenland and Antarctica to global sea level rise is accelerating at a rate of 56 gigatonnes/yr2 during April 2002–February 2009, which corresponds to an equivalent acceleration in sea level rise of 0.17 mm/yr2.
These results unambiguously reveal an increase in mass loss from both ice sheets. The acceleration in mass loss is statistically significant to a high degree (99%). We already knew that Greenland and Antarctica ice sheets play an important role in the total contribution to sea level. That contribution is continuously and rapidly growing.


 Arguments


Sea level rise is subject to internal variability due to ocean processes like El Nino/La Nina. In La Nina conditions, sea level falls. Considering that we've been experiencing the strongest La Nina conditions in over 20 years and yet the rate of sea level rise has not fallen, the only explanation is that the contribution from ice sheets has increased. This is confirmed by the latest GRACE satellite data.