Climate Science Glossary

Term Lookup

Enter a term in the search box to find its definition.

Settings

Use the controls in the far right panel to increase or decrease the number of terms automatically displayed (or to completely turn that feature off).

Term Lookup

Settings


All IPCC definitions taken from Climate Change 2007: The Physical Science Basis. Working Group I Contribution to the Fourth Assessment Report of the Intergovernmental Panel on Climate Change, Annex I, Glossary, pp. 941-954. Cambridge University Press.

Home Arguments Software Resources Comments The Consensus Project Translations About Support

Bluesky Facebook LinkedIn Mastodon MeWe

Twitter YouTube RSS Posts RSS Comments Email Subscribe


Climate's changed before
It's the sun
It's not bad
There is no consensus
It's cooling
Models are unreliable
Temp record is unreliable
Animals and plants can adapt
It hasn't warmed since 1998
Antarctica is gaining ice
View All Arguments...


Username
Password
New? Register here
Forgot your password?

Latest Posts

Archives

Are sea levels rising?

Posted on 30 April 2009 by John Cook

A common error in climate debate is drawing conclusions from narrow pieces of data while neglecting the whole picture. A good example is the recent claim that sea level rise is slowing. The data cited is satellite altimeter measurements of global mean sea level over the past 16 years (Figure 1). The 60 day smoothed average (blue line) seems to indicate sea level  peaked around the start of 2006. So one might argue that sea levels haven't risen for 3 years. Could one conclude that the long term trend in sea level rise has ended?
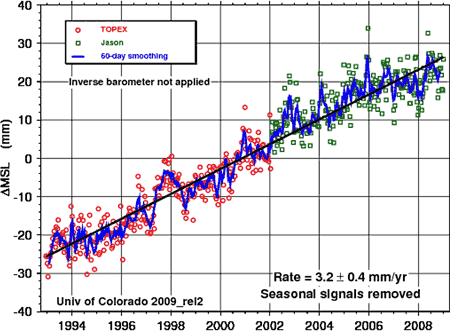

Figure 1: Satellite altimeter measurements of the change global mean sea level with inverse barometer effect (University of Colorado).

To answer this question, all one has to do is view the entire 16 year dataset. A noisy signal is imposed over the long term trend of sea level rise. These fluctuations mean there will be short periods where sea level shows no trend. For example, 1993 to 1996 or 1998 to 2000. In other words, there have been several short periods of several years over the last 16 years of steady sea level rise where sea level appears not to rise.

This is inevitably the case when you have a noisy signal imposed over a long term trend. We see exactly the same phenomenon occur in the temperature record (which is why we also see the same erroneous conclusions). The lesson from this is to treat with skepticism anyone who concludes long term trends from several years of a noisy signal (after all, skepticism should cut both ways).

In addition to this, Figure 1 is a particularly noisy signal because it displays unfiltered data. Sea level is subject to the "Inverse Barometer" Effect. This is where sea level is depressed in areas of high atmospheric pressure, and raised in areas of low pressure. When barometric pressure effects are filtered out, the result is a less noisy signal and a clearer picture of what's happening with sea level.
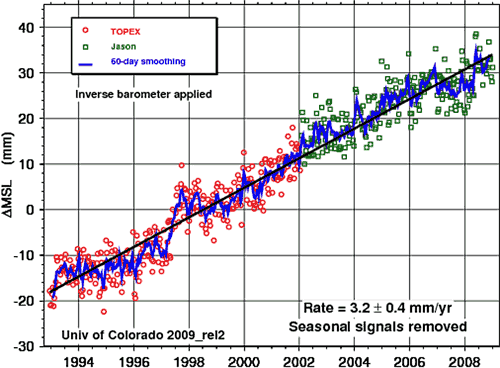

Figure 2: Satellite altimeter measurements of the change global mean sea level with inverse barometer effect filtered out (University of Colorado).

0 0

Printable Version  |  Link to this page

Comments

Comments 1 to 10:

  1. I agree John I have no problem with this. Sea level has been rising for thousands of years and for the last two centuries at about 2 mm per year. Here it looks like about 3mm per year? I think we all expect sea level to continue to rise. We would need very large net cooling to get us a negative slope wouldn't we? One point though, the actual skeptic argument is that the 6 meter (lately I've seen 10 meters) plus rise that is claimed to be immenent by the alarmists is not supported by the data and the prediction from 5 years ago that a tipping point had been reached and rapid rise was about to start, specifically at 30 times the currently observed rate, is not supported by the data. Hoping for warming.
    0 0
    Response: Future sea level rise is a subject of a future post - I started a post on sea level rise about a week ago and the topic grew and grew to the point where I've divided it up into several posts. I'm always saying get the complete picture but it's not easy to communicate the complete picture in a single blog post.

    As for your last comment, thoroughly read all the positives versus the negatives of global warming and tell me you're still hoping for warming.
  2. Actually I avoid that thread, it is the one where you are least cionvincing. Opposing understated positves vs sometimes silly exaggeration of negatives. For example 5.74% excess deaths due to heat waves vs 1.59% for cold snaps? Both numbers wildly high and the placing of heat waves deaths higher is just laughable. No matter how shoddy the editorial review process at New Scientist wass I can't believe they published that howler. At best it is an example very similar to the deliberate confusion of sea ice and land ice you were complaining about the other day on that thread.
    0 0
    Response: If you're not convinced of all the positives versus the negatives of global warming, all the more reason to post your comments there where they're relevant rather than on an unrelated topic. For starters, I suggest explaining exactly what problem you have with the methodology of the heat wave/cold snap research published in New Scientist.
  3. Re #1 Wondering Aloud, your analysis of sea level changes encompassed in this sentence doesn't accord with the evidence:
    Sea level has been rising for thousands of years and for the last two centuries at about 2 mm per year.
    In fact the evidence indicates that sea levels were pretty steady during at least the two millenia (2000 years) before the 19th century. So sea levels haven't been rising for thousands of years, at all. And of course they've only been rising "for the last two centuries at about 2 mm per year", if one averages over the whole two centuries. In fact if one analyses sea level rise more carefully during this period (see IPCC AR4 pages urled below), they were hardly rising at all during the early part of the 19th century, and only started to accelerate during the early part of the 20th century. See for example the papers cited below [***]. Some of this is summarised in the IPCC AR4 (see chapter 5 pp 408-411, for example): http://www.ipcc.ch/pdf/assessment-report/ar4/wg1/ar4-wg1-chapter5.pdf Your assertion about claims of imminent sea level rises and so on, seems a straw man argument, since no one considers that 6 or 10 metres of sea level rise is imminent! Unfortunately since you seem reluctant to substantiate your assertions with evidence/sources, it's not clear what to make of them. The bottom line is that rather small temperature rises of around another 1 - 1.5 oC of warming will take the Earth's global temperature to a value that is similar to that existing during the last interglacial 125,000 or so years ago when sea levels were around 4-5 metres higher than now. No one considers that such a sea level rise is "imminent". However it would likely be inevitable in a world with the temperatures we are pretty likely to see at the end of the 21st century, such that our descendents would/will have to accommodate themselves to a committed sea level rise of this order. [***] JA Church et al. (2008) Understanding global sea levels: past, present and future Sustainability Science 3, 9-22 K Lambeck et al. (2004) Sea level in Roman time in the Central Mediterranean and implications for recent change. Earth Planet Sci Lett 224:563–575
    0 0
  4. I have seen the 2mm/year assumption in a lot of places including in the IPCC report of course there listed as 15-20 cm per century. I agree the 6 to 10 meter claims are rediculous! But maybe you better tell Al Gore. The claim in AIG is 20 feet. I actually don't have a problem believing that 1.5 degree change would eventually cause a 5 meter rise. I don't say it would, some folks claim that would in fact take a 5 degree rise, but I could certainly be convinced by data on that. My problem is with the panic time frame. A change of 5 meters that takes a millenium and simultaneously moves growing seasons North by 300 miles is a heck of a lot less scarry. Then we could talk about what to do about it in real terms.
    0 0
  5. Hey John: interesting post - you could almost call it fractal skepticism since it is almost like the "no warming since 1998" argument but on a different scale. Wondering Aloud: I have not seen AIT, but I believe that Gore does not put a time frame on the 20 foot rise. Regards, John
    0 0
    Response: LOL, 'fractal skepticism'. Just when I thought this website couldn't get any nerdier, you've just taken it up a notch. Kudos, John :-)
  6. But if the trend is changing where do you draw the line? if you take the whole period of your first chart you get 3.2, but if you just take the portion relative to JASON you get about 2.3. Is JASON or TOPEX data skewed, or are we seeing the rate drop significantly? With temperature not increasing in the 21st century (so far) the drop in sealevel change doesn't seem abnormal or just noise.
    0 0
  7. "But if the trend is changing where do you draw the line?" You can draw any line you want, you just can't use it to extrapolate into the future. You need a climate model for that.
    0 0
  8. Sorry John Thanks for the correction AIG? What the heck? simple typo. I do that a lot. I think the implication in AIT is that this is a likely near term consequence. I know you can find proponents trying to scare us with it being a near term thing. It is mighty hard for people to get frightened over something that might happen hundreds if not thousands of years in the future. Please expand on fractal sketicism. Explain, sounds like fun.
    0 0
  9. "I have seen the 2mm/year assumption in a lot of places including in the IPCC report of course there listed as 15-20 cm per century. I agree the 6 to 10 meter claims are rediculous! But maybe you better tell Al Gore. The claim in AIG is 20 feet." Common error. AIT doesn't put any timeframe on 20 feet of sea level rise. [I see John Cross already covered this] One could say Gore is being cautious. If you read the latest draft SCAR report, 6 meters is seen as an upper bound by 2100: "Rates of sea level rise at least twenty times the current 3.1 mm/yr sustained over more than a century have been measured for the transition to the current warm period following the termination of the last ice age and during some of the warmer intervals of the last ice age. Until improved predictive capability is achieved, this can be regarded as a reasonable upper bound of Antarctica's potential contribution to global sea level. This maximum rate (62 mm/yr) would lead to a 6-meter sea level rise by 2100, but such rates occurred when there was considerably more ice on the planet." http://www.antarctica.ac.uk/met/SCAR_ssg_ps/ACCE.htm
    0 0
  10. It's interesting to note that the jump leading into 1998 doesn't lessen due to the Inverse Barometer correction. Likely that jump was largely a result of thermal expansion as ocean temperatures shot up well above the trendline due to the super el Nino. Oceans have had slight cooling in recent years, largely as a result of ENSO values turning negative, yet sea levels continue to rise, indicating perhaps that land ice melt is accelerating. The next moderately strong el Nino could bring a sizable jump.
    0 0

You need to be logged in to post a comment. Login via the left margin or if you're new, register here.


The Consensus Project Website

THE ESCALATOR

(free to republish)


© Copyright 2024 John Cook
Home | Translations | About Us | Privacy | Contact Us