Climate Science Glossary

Term Lookup

Enter a term in the search box to find its definition.

Settings

Use the controls in the far right panel to increase or decrease the number of terms automatically displayed (or to completely turn that feature off).

Term Lookup

Settings


All IPCC definitions taken from Climate Change 2007: The Physical Science Basis. Working Group I Contribution to the Fourth Assessment Report of the Intergovernmental Panel on Climate Change, Annex I, Glossary, pp. 941-954. Cambridge University Press.

Home Arguments Software Resources Comments The Consensus Project Translations About Support

Bluesky Facebook LinkedIn Mastodon MeWe

Twitter YouTube RSS Posts RSS Comments Email Subscribe


Climate's changed before
It's the sun
It's not bad
There is no consensus
It's cooling
Models are unreliable
Temp record is unreliable
Animals and plants can adapt
It hasn't warmed since 1998
Antarctica is gaining ice
View All Arguments...


Username
Password
New? Register here
Forgot your password?

Latest Posts

Archives

Can humans affect global climate?

Posted on 26 August 2010 by John Russell

When we experience weather events like hurricanes and floods, it’s very easy for us to feel insignificant and powerless in the face of such massive natural forces. How can humans influence this? Well, yes, we can. Of course we can’t influence a single weather event, but we can and do have a long term influence on the climate that causes it.

Since the industrial revolution, with ever-increasing supplies of fossil fuels, the activities of a dramatically expanding world population have made significant alterations to the make-up of our atmosphere.

In some cases human-caused change is direct and unambiguous. The harmful effect of the human release of CFCs on the ozone layer is well documented and not disputed. Down on the ground, draining of marshland and deforestation can produce a significant decrease in water vapour in the atmosphere downwind; while the introduction of irrigation for agriculture has the opposite effect. Over time, both of these human activities can alter patterns of rainfall, turning deserts into green areas and green areas into deserts.

In other cases the human causes of climate change are more complex. Emissions from cement production, pollution and the release of particulates to form smog in the atmosphere, all affect climate.

Without doubt the most significant of all the human causes of changing climate is the dramatic increase in CO2. After remaining relatively steady for the last 650,000 years or more, in just the last two hundred years the concentration of CO2 in the atmosphere has suddenly shot up from 280, to more than 380 parts per million. And it’s still rising. This dramatic 30% increase has all taken place at the same time as humans have been burning fossil fuels at a greater and greater rate.

Of course there are also natural sources of the CO2 in the atmosphere, such as vegetation, but fortunately there are differences that scientists can measure between the CO2 derived from fossil fuels and the CO2 derived from plants. The changing concentrations of the two types demonstrate that the additional CO2 can only be the result of human activity.
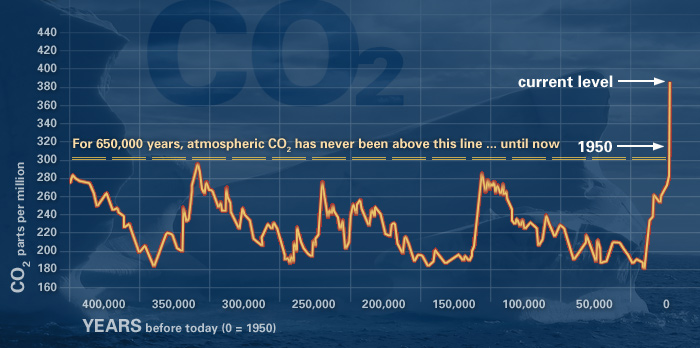
Of course, as CO2 is the most common of greenhouse gasses, the additional concentration is what causes most of the rise in temperature. This is resulting in a change in weather patterns and ocean currents; the melting of global ice formations; and an increase in extreme weather events.

So, yes; though we might be pretty helpless when it comes to controlling the weather, humans are certainly capable of changing the world’s climate.

This post is the Basic version (written by Graham Wayne) of the skeptic argument "Humans are too insignificant to affect climate". We're currently going through the process of writing plain English versions of all the rebuttals to skeptic arguments. It's a big task but many hands make light work. If you're interested in helping with this effort, please contact me.

0 0

Printable Version  |  Link to this page

Comments

Comments 1 to 38:

  1. Just a quick point - 'as CO2 is the most common of greenhouse gasses' needs to changed or clarified. Good post otherwise.
    0 0
  2. Another quick change: of course we can’t influence a single weather event. We can and do. Cloud-seeding is one obvious example. Depending how strongly you take "influence", then part of the point of ACC is that we are indeed influencing the weather. Perhaps simply substituting "We can't control what the weather will be like tomorrow, but we can and do have a long term influence on the climate that causes it." Is speaking of the climate "causing" weather is a little too loose as well? Perhaps, "We can and do have a long term influence on the climate patterns which it forms". Kudos again to Graham for his work!
    0 0
  3. More detail picking: I noticed that the text say "... in just the last TWO hundred years the concentration of CO2 in the atmosphere has suddenly shot up from 280, to more than 380 parts per million", while the graph say that the 280 ppm level was at 1950, which is less than ONE hundred years ago. Correct me if I'm wrong but I think the graph should be changed to "1850" instead of "1950". Thanx for a good post otherwise!
    0 0
  4. Same remark as Anne-Marie #1. Of course, the most abundant GHG is H2O.
    0 0
  5. CO2 the most common greenhouse gas? Please. Water vapor is the most common by far.
    0 0
  6. A minor language nitpick. You write: "How can humans influence this? Well, yes, we can." "Yes" is not an answer to "How?". Either drop the "How" entirely and start with "Can", or answer the question: "Well, we do it by influencing the climate." Or some such.
    0 0
  7. I think I sort of know what you really meant when you said "most common of greenhouse gases", but yeah, it sure is quite wrong as it's written! ;) Most markedly rising in concentration? Most significant in terms of changing climate? Most common GHG produced by human activity?
    0 0
  8. Mike at 09:11 AM Most markedly rising in concentration? Water vapour increases 6-7.5% per degC but being about 2% of the atmosphere in absolute terms it outstrips CO2. .............. Most significant in terms of changing climate? The direct effect of water vapour far exceeds the direct effect of CO2, with water vapour responding to ANY source of additional heating. However clouds are excluded as they are not considered a GHG, but are a major determinant of climate. ............. Most common GHG produced by human activity? Yes. But natural sources far exceed human emissions by a factor of about 30.
    0 0
  9. #8: "But natural sources far exceed human emissions by a factor of about 30. " Please substantiate that claim. Fossil fuel sources produced 30 Gtons (that's metric tons) CO2 in 2008. Perhaps you found it here?
    0 0
  10. //"Of course we can’t influence a single weather event, but we can and do have a long term influence on the climate that causes it."// Lorenz would be rolling in his grave...
    0 0
  11. muoncounter at 11:45 AM, the chart below shows that the 440 + 260 +70, total 770 Gigatonnes released by natural means is roughly 30 times the 26 Gtonnes indicated as being released primariliy by fossil fuels.
    0 0
  12. Isn't H2O the most common GHG? (This is maybe unrelated but I like it so I'll try a tenuous justification) I don't disagree that we can affect many aspects of our planet, your example of atmospheric CO2 is a strong candidate for that argument. But I wonder if in considering that we aren't blinding ourselves to natural variability. Here's the official data from a long temperature record at Armagh Observatory stretching back to 1800. This will take you 5-10 minutes but grab the annual data and graph it. Smooth it with 25 year running mean. What you get is a warming trend stretching back to the start of the record with low frequency oscillations. The most recent 'extreme' warming doesn't even show up as anything out of the ordinary. Tell me how humans have caused this and it is not natural variability? Humans can change our planet doesn't mean they have changed it in all the ways we think.
    0 0
  13. Can someone truly explain how you can determine when CO2 is produced by humans burning fossil fuels versus natural decomposition of vegetation that would occur naturally as the temperature increases? The signature for all decomposing vegetation is the same (where atmospheric gases are slightly different because of the concentration of the Carbon isotope (C14 vs C15). I can not tell how you could separate the CO2 emitted by just more decomposition of plants when the planet warms up during natural oscillations.
    0 0
  14. Why doesn't the Armagh Observatory have records since 2002??
    0 0
  15. nerndt - To put 2ppm/year into the atmosphere would require an additional years growth of the Amazon burning every year. That's every year for the last 100 or so. It would closely match the observed isotope ratios, but... At that rate we would have lost ~10 Amazons (assuming plant ages ~10yrs on average) in the last century. That simply hasn't happened. And as to natural variation, take a look at the last 425Kyr, from the Vostok ice core data: The current 390ppm of CO2 simply isn't in the range of natural variations for the last half million years. On the other hand, we know we're currently adding 29Gtn of CO2 to the air every year (enough for 4ppm increase), of which half seems to be sticking around in the air (2ppm yearly increase), the rest going into sinks like the ocean. So we would have to disregard our CO2 output and believe that a few Amazons we haven't been tracking have burned/decayed? Or perhaps we can conclude that it's our CO2 output?
    0 0
  16. In answer to #13, the words of David Karoly ... Burning fossil fuels produces carbon dioxide enriched with carbon isotope C12 and reduced C13 and essentially no C14, and it decreases atmospheric oxygen, exactly as observed.
    0 0
  17. #14 John Chapman at 15:03 PM on 27 August, 2010 Why doesn't the Armagh Observatory have records since 2002?? They have them, it's just data beyond 2002 are not processed like this. In fact daily data in the archive are in a reasonable format only since July 2000, prior to that date they only have the scanned images of handwritten forms. Anyway, it is imperative not to go beyond 2002, because monthly temperature anomalies (relative to 1930-1989 means) recovered from the archive look like this between July 2000 and 2010: As you can see, after 2002 Armagh Observatory is cooling at an alarming rate of 13.2°C/century.
    0 0
  18. BP, what's the 30 year trend at Armagh?.
    0 0
  19. HR @ 12 - wouldn't we really need to plot temperature data prior to the Industrial Revolution, to really understand "natural" natural variability?. Once humans start to pump larges amounts of greenhouse gases into the atmosphere, how natural is that?.
    0 0
  20. Speaking of C12/C13 ratio. This is an analysis of Spencer that clearly shows its imcompetency. http://wattsupwiththat.com/2008/01/28/spencer-pt2-more-co2-peculiarities-the-c13c12-isotope-ratio/ Check the comments, there are as coherent ;)
    0 0
  21. #18 Dappledwater at 22:16 PM on 27 August, 2010 what's the 30 year trend at Armagh? For the last 30 years it's +0.21°C/decade. However, for the last 20 years it is only 0.06°C/decade and for the last 80 it's 0.046. Should measurements be finished at the end of 2002, facts would not get in the way and the accelerating trend stands out clear. 20 years: 0.48°C/decade 30 years: 0.35°C/decade 80 years: 0.06°C/decade
    0 0
  22. “a significant decrease in water vapour in the atmosphere” I recall, the reasons may be different. “We have measurements, that in 1970-90s water vapour was on the rise in the stratosphere. As soon as SOLAR ACTIVITY STARTED TO DROP in 1990s, WATER VAPOUR ALSO STARTED TO DROP. In 2000-2009 water vapour content in the troposphere dropped by 10%. [...]” (Contributions of Stratospheric Water Vapor to Decadal Changes in the Rate of Global Warming,Solomon,2010.). With this, beautifully, correlates decline of NPP: Drought-Induced Reduction in Global Terrestrial Net Primary Production from 2000 Through 2009 – Zhao & Running (2010): “The past decade (2000 to 2009) has been the warmest since instrumental measurements began, which could imply continued increases in NPP; however, our estimates suggest a reduction in the global NPP of 0.55 petagrams of carbon. Large-scale droughts have reduced regional NPP ...” “A continued decline in NPP would not only weaken the terrestrial carbon sink, but it would also intensify future competition between food demand and proposed biofuel production.” "This is a pretty serious warning that warmer temperatures are not going to endlessly improve plant growth, [...???]" Running said. “... that the additional CO2 can only be the result of human activity.” “Burning fossil fuels produces carbon dioxide enriched with carbon isotope C12 and reduced C13 and essentially no C14, and it decreases atmospheric oxygen, exactly as observed.” First, for the record once again remind you: of course CO2 from respiration is the same as the ratio of ratio13C/12C from fossil fuels. And 14C? If we base on it (tree ring, np. Eddy, 1976), then we would have to conclude that, for example in the MWP - it was similar or even more CO2 in the air than now ... 14C ... ... formed in the upper atmosphere of Earth as a result of the impact of cosmic rays with nitrogen (14N). Particle flux of radiation is greatest during periods of minimum solar activity - the weakening of its magnetic field, which shields the Earth and is a barrier to cosmic radiation. Arises more isotope 14C, which, diffuses into the lower areas of the atmosphere, among other things aside in annual increments of trees. So the greater the activity of the Sun, the less 14C falls on Earth ... “Nonetheless, it is confirmed with the new palaeomagnetic series that the Sun spends only 2–3% [!] of the time in a state of high activity, similar to the modern episode. This strengthens the conclusion that the modern high activity level is very unusual during the last 7000 years [...].” (Usoskin, IG , SK Solanki, and M. Korte (Geophys. Res. Lett., 2006 ), Solar activity reconstructed over the last 7000 years: The influence of geomagnetic field changes.) Now, in recent decades have seen increased by 15% increase in soil respiration (especially the Arctic) than predicted were the best models, also decreased to CO2 absorption by the oceans ..., ... and as we add to this the current decline in NPP ... Jaworowski Z. (2007) Carbon Cycle. Working materials for Seminar of Nongovernmental International Panel on Climate Change, Vienna 14 April, 2007. NIPCC Seminar, p. 1-21. annual fluxes of CO2 into the atmosphere: all natural ~ 170 Gt C Human total 7.97 Gt C = 4.7% of the natural stream, 0.16% of "greenhouse effect" I also recommend the latest work Beck for discussion; and the web article and his best criticism.
    0 0
  23. CO2 and oceans. Natural forcing of climate during the last millennium: fingerprint of solar variability, Swingedouw et al., 2010: “We argue that this lag is due, in the model, to a northward shift of the tropical atmospheric convection in the Pacific Ocean, which is maximum more than four decades after the solar forcing increase. This shift then forces a positive NAO through an atmospheric wave connection related to the jet-stream wave guide. The shift of the tropical convection is due to the persistence of anomalous warm SST forcing the anomalous precipitation, associated with the advection of warm SST by the North Pacific subtropical gyre in a few decades. Finally, we analyse the response of the Atlantic meridional overturning circulation to solar forcing and find that the former [AMOC] is WEAKENED when the latter increases. Changes in wind stress, notably due to the NAO, modify the barotropic streamfunction in the Atlantic 50 years after solar variations. This implies a wind-driven modification of the oceanic circulation in the Atlantic sector in response to changes in solar forcing, in addition to the variations of the thermohaline circulation.” Dr Fraser (Southern ocean carbon sink weakened, 2007) says: “The increase in wind strength is due to a combination of higher levels of greenhouse gases in the atmosphere and long-term ozone depletion in the stratosphere, which previous CSIRO research has shown intensifies storms over the Southern Ocean.” „The increased winds influence the processes of mixing and upwelling in the ocean, which in turn cause an increased release of carbon dioxide into the atmosphere, reducing the net absorption of carbon dioxide into the ocean.” “A new hydrographic section across 25° N was taken in 2004, and comparison with measurements from 1957, 1981, 1992 and 1998 reveals a slowing [AMOC] of almost a third between 1957 and 2004.” (Atlantic Ocean trends, Nature Journal, 2005.) ... Solar activity increased, AMOC weaken - CO 2 increased - it’s "pure" The Nature ... Extreme deepening of the Atlantic overturning circulation during deglaciation, Barker et al., 2010.: “We conclude that the rise in atmospheric CO 2 concentrations and resultant warming associated with an especially weak overturning circulation are sufficient to trigger a switch to a vigorous circulation, but a full transition to interglacial conditions requires additional forcing at an orbital scale.” “... i.e., the AMOC is stronger when the north is cooler ...” (Toggweiler, 2010) D’Orgeville & Peltier (2009), CCSM3 T31x3 pre-industrial control, 60 yr: Similar in-phase T and S contributions to density, less role for NAO, but suggest gyre – bathymetry interaction. Results: min. AMOC - reduced sea ice, increased upwelling ...
    0 0
  24. Arkadiusz Semczyszak, both E.G. Beck and Jaworowski are very poor sources. Citing them tends to weaken rather than strengthen your case.
    0 0
  25. Yvan Dutil #20- The only 'incompetency' Spencer proved is his own. The whole article is pseudo-science. You should have been able to guess this by his frequent reference to 'trending' and its removal, with no discussion of what algorithms he used to do this. But without that discussion, we have no idea if he did it right, or if he did it to get the results he wanted. Then there is also his red herring about the ratio changing due to rise in C12 instead of fall of C13.
    0 0
  26. Those who have lived in cities that have been hit by hurricanes/cyclones will be hoping that the comment about humans not being able to affect single weather events is true, or perhaps not. There is a train of thought developing that hurricanes/cyclones may be drawn towards large population areas because of the changes such infrastructure has on the local climate. If true not only does it affect the area hit, but those areas missed that may have otherwise received at least the moisture such events bring in the course of such natural events.
    0 0
  27. 19.Dappledwater I guess I posted this record to try to extend the record further back from the post-WWII increases in CO2. I think we might be able to consider 1800-1900 as a period of very low CO2 emission but there's always a danger in assuming things.
    0 0
  28. HumanityRules at 14:20 PM on 27 August, 2010 and John Chapman at 15:03 PM on 27 August, 2010 “Why doesn't the Armagh Observatory have records since 2002?” The answer is not due to some hidden agenda as Peter B implies, but is far less exciting. The calibrated Armagh temperature data series to 2002 is from Butler 2005. This paper (submitted 2004) attempts to calibrate the record from the different thermometers and times of observation used in Armagh with data and information available up to the end of 2002. These factors are discussed in the paper, and have most importance for the data prior to the 20th century. An update (to 2004) is available in a more recent NASA study by Wilson 2006, which updates the calibrated records from 1844 to 2004, and of course Peter B correctly points out that up to date monthly records with daily resolution are available at the link he has kindly provided, but I believe this data is not yet in a convenient month by month tabular form. In the following charts I have used full up to date (to July 2010) Armagh monthly records and for comparison (and quick sanity check) the monthly (composite) CET (Central England Temperature) record, (details of CET calibration and error sources given in Parker 2005). Due to the close proximity of these sites, general short and long term correlation is high. The decadal average shows a very similar recent significant upwards trend in both records. This puts the chart in comment 17 (BP) in perspective. However there are some significant trend divergences from the Armagh data in the pre 20th Century period. It is in this period that there are higher uncertainties. In the 20th Century the 100yr trends are indistinguishable, which casts doubt on claims on some skeptical websites that "Urban Heat Island" (UHI) effects may have affected the Central England record. These same websites suggest Armagh is unaffected by UHI. Given the above, an eight year gap in the records (filled from Dublin data), and the discussion of uncertainties in the papers, we should be cautious about interpreting data from a single site from the very early instrumental period, though we are lucky to have these precious early instrumental records. Berényi Péter at 00:23 AM on 28 August, 2010 You state: “For the last 30 years it's +0.21°C/decade. However, for the last 20 years it is only 0.06°C/decade and for the last 80 it's 0.046” I am not sure how you have generated your values. Here are values I derived from the monthly data up to July 2010. Unless I am mistaken the 20 yr and 30 yr trends are not significantly different.
    0 0
  29. All, I appreciate the Armagh stuff should be shifted to a more appropriate thread, but some of the points raised on this thread needed clarifying.
    0 0
  30. 28.Peter Hogarth "The decadal average shows a very similar recent significant upwards trend in both records." Signficicant in relation to what? The 25year smoothing I did in comment #12 shows that the warming trend in the recent period is little different to other periods in the record. Such as the times around 1850 and 1950. Even your decadal smoothed data shows that to some extent. Yes the early data has to be qualified but it is all we have so have to either accept it or not. If you're going to make the statement that the recent period is in some way significant then you have to at least try to include as much of the record as possible to make that statement meaningful.
    0 0
  31. Why are we having such a long discussion about a SINGLE weather station. The reason deniers point to Armagh is that they claim the data from this station contradicts global warming. That is, by looking at only a single station for a limited number of years the warming doesn't look that bad. As Peter has shown above, this argument is completely false. The data from Armagh is completely consistent with global warming. Scientists EXPECT the trend at single stations to vary more than the global average. This is exactly what is observed. HR what is your point that you think is relevant about this single weather station?
    0 0
  32. 31.michael sweet You read too many nefarious motives in what 'deniers' write. Everything is up for discussion in my eyes (although I accept this is OT). My original post explains the tenuous connection between the Armagh data and the article. One problem I have with AGW is that I think it understates natural variability, which might be the flip side of human induced change. The data was just meant to illustrate that. Even with Peter's useful post I don't feel fully satisfied it doesn't. (just to be clear those "limited number of years" would be the full, 200 years of one of the longest temperature records in the world)
    0 0
  33. HumanityRules at 19:51 PM on 29 August, 2010 Significant compared to the 20th century trend? The CET data shows the longer term trends better as there is even more data, which is why I included the CET data as a "sanity check". We also have to factor in the different forcing factors operating at different times, and uncertainties, which are high in the early data, compared with the modern data. Though this will sound a little perverse, a multidecadal slope in the early part of the data may be less statistically significant than a similar slope in the modern data where measurement errors are very small indeed. Anyone pointing to the very early CET temperature variations should bear in mind the Mercury thermometer was invented around 1714, and the Stevenson Screen around 1864. For Armagh, there were some documented 19th century thermometer errors of around 3 degrees Fahrenheit (if memory serves) which was a potential problem when trying to calibrate some of the early data.
    0 0
  34. Is Dr. Singer's statement true? If not, how can it be refuted? " There is no dispute at all about the fact that even if punctiliously observed, (the Kyoto Protocol) would have an imperceptible effect on future temperatures -- one-twentieth of a degree by 2050. " Dr. S. Fred Singer, atmospheric physicist Professor Emeritus of Environmental Sciences at the University of Virginia, and former director of the US Weather Satellite Service; in a Sept. 10, 2001 Letter to Editor, Wall Street Journal
    0 0
  35. I should have prefaced the previous comment. I am currently debating a number of people (who are probably smarter than I am) on a message board and I was asked to respond to Dr. Singer's claim. I have searched for an answer and have come up empty. I truly don't know the answer and any help would be appreciated. Thanks, Smitty
    0 0
  36. Which board, Smitty? The answer helps determine whether it's worth devoting any effort to an attempt. Meanwhile, it might help to put Singer's quote into context.
    0 0
  37. Uh-oh. Dr. S. Fred Singer in his own words, in the PBS interview that is the source of Smitty's quotation. I'd heard of this guy but now I understand why he's notorious. The interview is worth an entire article in its own right. A sample of internal consistency and accuracy: "But since 1979, our best measurements show that the climate has been cooling just slightly. Certainly, it has not been warming." Followed later by: "Since aerosols are mostly emitted in the northern hemisphere, where industrial activities are rampant, we would expect the northern hemisphere to be warming less quickly than the southern hemisphere. In fact, we would expect the northern hemisphere to be cooling. But the data show the opposite. Both the surface data and the satellite data agree that, in the last 20 years, the northern hemisphere has warmed more quickly than the southern hemisphere." Completely incoherent but Singer ironically goes on to say this is very embarrassing to the "modelists."
    0 0
  38. Singer is the worst of the worst. Cigarettes are not harmful. Asbestos is good for you. Acid rain does not exist. There is no ozone hole. Name a just plain crazy wrong 'scientific' position of the last thirty years and chances are he has been one of its prime proponents. That said, the statement quoted above is classic Singer. Pretty much everything he says takes some minor element of 'truth' and uses it as the foundation for a complete lie. In this case, "one-twentieth of a degree by 2050" is an extremely low, but not completely impossible, estimate while "imperceptible effect on future temperatures" is an outright lie. This is because most of the warming between now and 2050 is already 'locked in'. Complying with the Kyoto benchmark (1990 emissions levels by 2012) and sticking to that level would very likely have more than a 0.05 C impact on the 2050 global temp anomaly, but it would also mean at least 1 C difference in 2100 and even more further out.
    0 0

You need to be logged in to post a comment. Login via the left margin or if you're new, register here.


The Consensus Project Website

THE ESCALATOR

(free to republish)


© Copyright 2024 John Cook
Home | Translations | About Us | Privacy | Contact Us