Climate Science Glossary

Term Lookup

Enter a term in the search box to find its definition.

Settings

Use the controls in the far right panel to increase or decrease the number of terms automatically displayed (or to completely turn that feature off).

Term Lookup

Settings


All IPCC definitions taken from Climate Change 2007: The Physical Science Basis. Working Group I Contribution to the Fourth Assessment Report of the Intergovernmental Panel on Climate Change, Annex I, Glossary, pp. 941-954. Cambridge University Press.

Home Arguments Software Resources Comments The Consensus Project Translations About Support

Bluesky Facebook LinkedIn Mastodon MeWe

Twitter YouTube RSS Posts RSS Comments Email Subscribe


Climate's changed before
It's the sun
It's not bad
There is no consensus
It's cooling
Models are unreliable
Temp record is unreliable
Animals and plants can adapt
It hasn't warmed since 1998
Antarctica is gaining ice
View All Arguments...


Username
Password
New? Register here
Forgot your password?

Latest Posts

Archives

So, you think that learning about climate change needs to be tedious?

Posted on 9 February 2011 by BaerbelW

Actually, that isn’t necessarily so if the information is gift-wrapped or disguised as a fun but not trivial climate-quiz! In the course of working as a voluntary zoo-docent, I have helped to put together several quizzes to pique visitors’ interest about specific topics like tigers, rhinos, the rainforests or right now apes. All of these quizzes contain general questions about the animals and areas but don’t shirk away from the hard themes like the dire straits these species and regions are in. Questions which come with striking visuals or comparisons work best to get people thinking. We’ve been using the quizzes as one element of various materials – some of it “hands-on” – on our touch-tables. If the visitors are interested to learn more, some of the questions and answers can then be explained in more detail.

As I was preparing to give a talk about climate change last year, I started to put together a climate-quiz which can simply be printed out, put into a file-folder and put on a desk for people to leaf through on their own. A "quiz-master" can also be at hand to give some assistance or to provide additional explanations to go with the answers. In addition, the quiz can also be used at the start of an otherwise perhaps dry lecture about climate change, or some of the questions and answers can be scattered throughout the presentation to engage the audience (or to keep them alert!).

Here is an example:
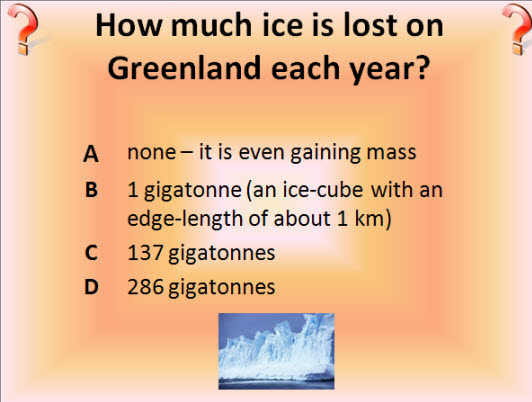
Example-01-Question

Example-01-Answer

The complete quiz is currently available for download as either a PDF-file or as a  Powerpoint-version. The latter allows adding suitable animations for online-presentations or creating a “run-it-yourself” interactive version where clicking on the correct answer jumps to the next slide and clicking on a wrong answer just gives a beep. There are other options as well: each slide can be created as a graphics-file (eg. jpg or gif) and these pictures can then be uploaded into an online photo-album – the only caveat for this version is, that there needs to be an option to view the pictures large enough to actually read the text (Note: Kodakgallery lets you switch to "full screen" via a link at the bottom of the screen)!

That's Baerbel's beautiful, visitor-friendly quiz.  For a quiz overlapping Baerbel's but with a lower-tech presentation, Anna Haynes has posted the questions on the Warming101 blog  and the quiz is also available as two sets of flash cards: one with multiple choice answers and the other with open answers. All the answers come with links to further information.

These quizzes have another purpose: they can help us learn whether Dunning&Kruger's most encouraging finding - that given feedback, even those students who didn't know that they didn't know, could improve - holds true in the realm of climate awareness.

Suggestions?  How should we accumulate further quiz questions?  What's a good format to store & display them?  

Updated February 11: Thanks for all the feedback! The links to the downloads now lead to new versions of the files where suggestions from the comments have been included. A "bonus question" has also been added.

0 0

Printable Version  |  Link to this page

Comments

Comments 1 to 15:

  1. This is really a great resource. Thank you!
    0 0
  2. This is a really good tool for public communication...fantastic job. I am wondering if a dynamic online format, similar to your PowerPoint animation idea, would be good. People could go to SkS and take the quiz without having to download anything. I think an online form of the quiz would be fun, and not too hard to code.
    0 0
  3. I should clarify that the quiz over at the Warming101 post (link) has a lot of Qs different from Baerbel's quiz (though they do overlap). Baerbel's is much more beautiful, with the images...
    0 0
  4. Also, Michael Tobis has had some good puzzlers, on In It; though I'm not sure how to find them again though. And Yulsman's What are you looking at? "mystery image"
    0 0
  5. This is great. I would note: you mispelled "decade" on page 17. Also, I would have another question introducing the issue of CO2 acidification, as it is not a problem many are aware of and I suspect many would be confused by the question or find it ridiculous. Also, and this is just my feeling, but I think the 350 question is kind of subjective for a quiz to teach people the facts (that isn't to say it's not correct), and also given the following question may give people the impression that the damage is already done and there's not much point in trying to fix it now.
    0 0
  6. To further help inform people you could try a question of this form: What percentage of its ice was lost by Greenland last year? A) 5% B) 1% C) 0.1% D) 0.01% Answer: 286 Gigatonne or 0.01% of ice was lost by Greenland last year. _____________________ http://en.wikipedia.org/wiki/Greenland_ice_sheet Total Greenland ice (ice sheet plus glaciers) ~= 2.85 megagigatonnes (2.85 E15 tonnes) 2.86 E9 / 2.85 E15 ~= 0.01% If all ice melt was considered to be land based ice, consequent sealevel rise would have been about 0.7 mm. Not a trivial amount in absolute terms. IF melting from this source continued at this rate for 100 years it would cause about 70mm (almost 3 inches) sea level rise. SME
    0 0
    Moderator Response: [Daniel Bailey] A couple of points: 286 Gigatons was the 2009 amount. The corresponding 2010 value was 600 Gigatons. The latest research suggests future Greenland and Antarctic ice losses will be anything but linear, with multiple-meter rises in sea level possible in decadal timescales.
  7. @Eric L Thanks for your feedback (and finding yet another typo!). I'll collect suggestions and will then re-upload the modified files. The quiz originated in connection with a 350.org activity which is why I included a question about 350 ppm. The individual questions are not numbered so any print-outs can obviously select suitable questions and/or re-arrange them as needed. @Daniel Bailey Thanks for the pointer about Greenland ice in 2010! A general "problem" with questions like the one about the Greenland ice is that they are moving targets. Ideally, these types of questions should be updated whenever new data (plus the corresponding graphics!) become available.
    0 0
    Moderator Response: [Daniel Bailey] You're very welcome. A graphic expressing the Greenland mass-loss growing quadratically (which it is) would be nice, if achievable. A 3D version of this graph, but showing the loss growing instead of the mass declining, if you will.
  8. I have been interested in climate change for nearly a year now. It seems it's paying off with all correct answers in the quiz :D Thanks to Real Climate and Sceptic Science. :)
    0 0
  9. I printed the PDF to put in the Kitchen at my workplace but printing double sided means that the answers are on the front and the questions on the back of the previous page ! I printed out pages 2-25 and then 1 and 26 separately. It would be nice to include the Skeptical Science URL in it too
    0 0
  10. Moderator #6 One point. From the graph 2010 seems to start at -700 and end at -1150, that's more like 450 Gigatons. I think what you mean is that 600 Gigatons was lost during the melt season, some weight was put on either side of this period.
    0 0
    Moderator Response: [Daniel Bailey] Fair point. Net losses vs peak losses in a noisy time series (thank you for pointing that out). But the system is displaying signs of increasing de-linearity and needs further monitoring.
  11. These are terrific slides. I think your point about disguising information as fun especially good. I would change the volcanoes question to: How much more CO2 is due to human activity than volcanoes? I find your wording hard to read. I would change the sea level rise question to emphasize the cost more. $25,000 billion doesn't mean much to me. Perhaps 25-28 Trillion dollars would work. The cost is so phenominal that it is difficult to convey properly.
    0 0
  12. Some corrections: Slide 11 says "on save side" when I think what was meant was "on the safe side" (unless "save side" is some sort of weird Aussie colloquialism). Slide 13 explains how CO2 drops in spring/summer, but not how it rises so precipitously again in the fall/winter. I think the gap will lead the ignorant to believe that plant CO2 uptake is a mitigating factor (contrary to the clear evidence of the graph). Slide 24... I agree with Michael Sweet. The wording of the question is confusing, and hence the answers are ambiguous. Then unless one looks closely at the words on the answer slide, one can assume that "10 times as much" means that volcanic is 10 times human, rather than vice versa. You might also add a slight emphasizing the actual cost of doing something about it... that economist compute it as 1% of GDP, with worst case ("alarmist") levels of 3% of GDP.
    0 0
  13. I agree with SME (#6) in re using percentages. The absolute numbers are meaningful only in the context of the total ice volume. If you are going to use absolute numbers you should also indicate the total world volume of ice (both poles), which is about 33 x 10^6 cubic kilometers. An even more interesting question is how much heat it would take to melt a proportion of the ice (say 0.01%) compared to the world-wide solar radiation over the course of a year...
    0 0
  14. Thanks for the feedback! @Sphaerica "save side" on slide 11 was just me not finding another typo (thanks for spotting it) Slide 13 - I'm going to reword the explanation for an updated version of the quiz to make this clearer Slide 24 - I changed the question to Michael Sweet's suggestion (this was somewhat "lost in translation" as I had first created the quiz in German) @Michael Sweet Sea level rise question: I used the numbers as they were shown in the WWF/Allianz-report (I didn't want to get caught in the differences between German and British/US billions) @Phil Sorry about the double-sided printing issue - I can add one more slide as page #2 so that this works better. Thanks for your suggestion to add a link to SkepticalScience - I changed the last slide to do just that. @SME and Peter Offenhartz I see your points about using percentages. On the other hand, they aren't quite as visually intruiging as the graphics of the icecubes currently included. Also, as 0.01% is a very small number it would most likely just cause a reaction of "so what?" which in the case of the Greenland icesheet isn't really warranted. I'll wait until tomorrow in case more suggestions show up in the comments and will then upload modified versions of the PDF- and PPT-files.
    0 0
  15. Baerbelw: I think the main issue with the sea level problem is that the problem is so huge it is difficult to summarize. I cannot think of anything that really describes the problem well. Your choice is good. Millions, billions, trillions eventually it adds up to real money.
    0 0

You need to be logged in to post a comment. Login via the left margin or if you're new, register here.


The Consensus Project Website

THE ESCALATOR

(free to republish)


© Copyright 2024 John Cook
Home | Translations | About Us | Privacy | Contact Us