Climate half-truths turn out to be whole lies
Posted on 28 June 2011 by John Cook
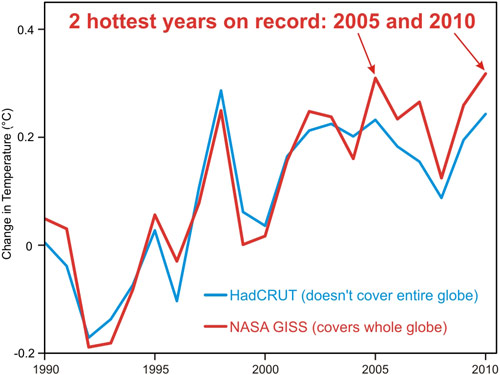
The Age have published an opinion piece I wrote in response to Bob Carter's An Inconvenient Fallacy. My response is Half the truth on emissions and explores how Carter uses half-truths and cherry picked data to mislead and distort climate science. I also included a graph that wasn't included in the article (either due to space or because it was just too geeky for a broadsheet). So I've included an excerpt plus the graph below:
To understand what's happening to the global climate, we need to look at temperature change over the entire planet. Two scientific teams - NASA Goddard Institute for Space Studies and the European Centre for Medium Range Weather Forecast - have constructed temperature records spanning the whole globe. Both find consistent results, using independent methods, with the two hottest years on record being 2010 and 2005. Both find the Arctic is warming faster than the rest of the planet, with melting sea ice acting as a positive feedback that amplifies the warming.
Enter Bob Carter and his deliberate brand of climate cherry-picking and false, but plausible, assertions. He has long hung his hat on the proposition the climate has been cooling since 1998. But with 2005 and 2010 being the hottest years on record, he resorts to cherry-picking which dataset to use. Rather than use temperature records that cover the entire globe, he opts for datasets that do not include the Arctic region, where warming is the strongest. These temperature records underestimate recent warming and are the darling of those who wish to deny global warming is happening.
Note: I've added the NASA comparison to HadCRUT graph to our ever growing list of Climate Graphics so a high-rez version, freely available under a Creative Commons licence, is now available for those not afraid to use geeky graphs.


 Arguments


[DB] And yet they are STILL the hottest years on record, during a period in which the anthropogenic forcing have been the dominant attribution to the rise in global temperatures.
[DB] And don't forget the copious quantities of human-caused global warming.
[DB] Pretty dated info there, Eric (data stops at 1997). Surely you can find something more contemporaneous than that?
BTW, full copy is here.