Climate Science Glossary

Term Lookup

Enter a term in the search box to find its definition.

Settings

Use the controls in the far right panel to increase or decrease the number of terms automatically displayed (or to completely turn that feature off).

Term Lookup

Settings


All IPCC definitions taken from Climate Change 2007: The Physical Science Basis. Working Group I Contribution to the Fourth Assessment Report of the Intergovernmental Panel on Climate Change, Annex I, Glossary, pp. 941-954. Cambridge University Press.

Home Arguments Software Resources Comments The Consensus Project Translations About Support

Bluesky Facebook LinkedIn Mastodon MeWe

Twitter YouTube RSS Posts RSS Comments Email Subscribe


Climate's changed before
It's the sun
It's not bad
There is no consensus
It's cooling
Models are unreliable
Temp record is unreliable
Animals and plants can adapt
It hasn't warmed since 1998
Antarctica is gaining ice
View All Arguments...


Username
Password
New? Register here
Forgot your password?

Latest Posts

Archives

Common graphical tricks and the Medieval Warm Period

Posted on 29 April 2010 by MarkR

The Hockey Stick is a climate celebrity and skeptics have their own graphs that ‘show’ it is wrong. One of the most common is from the 1990 IPCC report, showing the Medieval Warm Period or MWP.
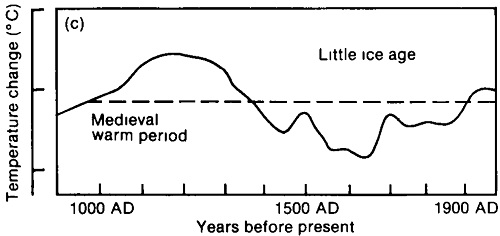

Figure 1 – IPCC First Assessment Report estimate of temperature changes in Europe from 900AD onwards.

This is how it appeared in Durkin’s The Great Global Warming Swindle:
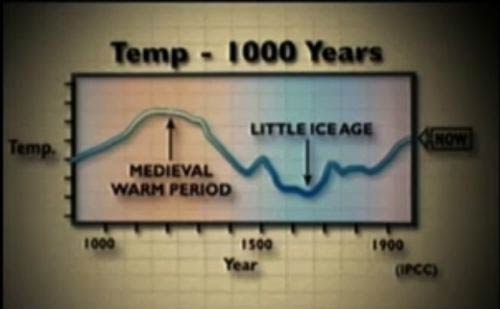
Medieval Warm Period from Great Global Warming Swindle
Figure 2 – Shot of the same IPCC graph slightly modified to be shown in The Great Global Warming Swindle

The conclusions of most recent studies are that the MWP was on average cooler than today, but The Great Global Warming Swindle, blogs and industry think tanks say otherwise, often based on graphs like this. It appears to be modified from Lamb 1965:
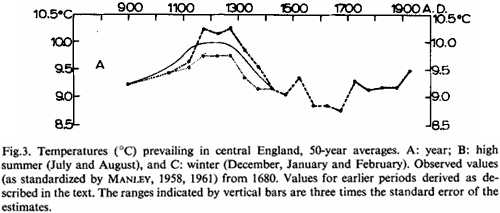
Central England Temperature 

The data is for central England and from 1680 it uses the 50 year average of the HadCET thermometer record. Thankfully, the HadCET record has carried on since that graph finishes (around 1920), so we can find where ‘NOW’ really is. In Figure 4 we have HadCET with 10 year averages (dotted line) and 50 year averages (solid line). We continue the 50yr line and find that it’s now about 0.35C warmer than Lamb’s last point. However, global warming only really kicked off around 1980, so we’ve still got 20 years of no global warming in the 50yr average and it seems pretty fair to take a look at something that would catch suspected global warming – like the 10 year average. This has risen by just over 1 °C since Lamb’s last measurement.
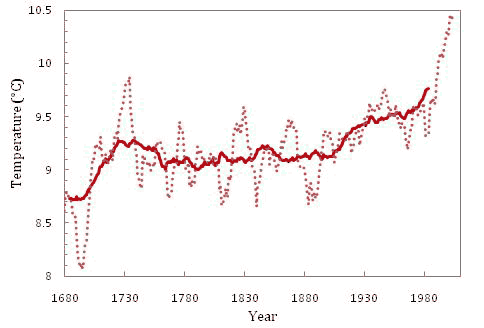
HadCET data since 1680 with 10 year and 50 year running mean
Figure 4 – HadCET data since 1680 reported as a 10 year running mean (dotted line) and as a 50 year running mean (solid line)

So when you see that graph with ‘NOW’ marked on the right hand side, they are telling you that the temperature now is the 50 year average centred on the 1920s. As someone living in the 2000s, you probably think that’s a bit silly. The temperatures of the 2000s would be the upper ‘NOW?’ on figure. The lower ‘NOW?’ is the latest 50yr average.

HadCET temperature compared to current temperature
Figure 5 – Where are we now? The lower box and line is the latest 50 year average in HadCET to be consistent with the rest of the graph. This, however, misses much of the period thought to be associated with global warming. The the latest 10 year average captures this and is just off the chart.

The Great Global Warming Swindle and every other skeptical source that shows you this graph and claims it shows that the MWP was warmer than today is not giving you the full picture. They are showing you evidence that central England was warmer around 1200AD than it was around 1920. They are showing you that the last decade was warmer than any 50 year period on the graph including the MWP.

Many similar graphs are loved by skeptical sites, but this is a useful demonstration because it contains all 3 of the common ‘tricks to hide the incline’ of global warming. Firstly they change the temperature scale and/or hide the values. Next they pick a single region, and finally they either cut off or ignore instrumental evidence showing recent warming.

There appears to be plenty of evidence for some places being warmer than today in the MWP, and whilst most studies say that globally it wasn’t warmer it seems that scientists still want more data to be sure (and if it was warmer, that might suggest higher climate sensitivity). The important thing is being able to properly interpret the evidence that arrives – which involves spotting the misleading half-truths by the likes of Martin Durkin.

0 0

Printable Version  |  Link to this page

Comments

1  2  Next

Comments 1 to 50 out of 60:

  1. If anyone can pick holes in my approach, please let me know. I added the lines to the graph using pixel counting and may have made a mistake there so I'll double check later but if you notice a mistake, do shout out!
    0 0
  2. CO2science do a similar dodgy job with their analysis of the various studies into temperature reconstruction of the MWP. They classify each localised study by whether it (MWP) was warmer than the current period (CWP) or not. But for each study they vary the time period they call the MWP. They pick out the highest part of the data near the MWP and then label that as the MWP even if it's a few hundred years away from other studies. Sometimes they label the MWP as being centered around 1300AD, sometimes at 800AD. Good description with examples in Whirlpool thread
    0 0
  3. A very clear and useful article, Mark. I think that Durkin, Plimer, Monckton et al are extended an undeserved courtesy by being called 'skeptics', however. These people are not within a bull's roar of real skepticism. It is appropriate to call them deniers. Yikes, it seems the trouble with 'skeptics' these days, is they'll believe anything!
    0 0
  4. Brendon, your link denied me access! 'tis a shame, I'd very much like to check that stuff out. Perhaps a different pathway into the thread? CO2 Science is a slippery example, isn't it? Not as blatant as the example in Mark's article - it looks like a duck, walks like a duck, only when you listen closely it's saying "woof".
    0 0
  5. mautilus_mr, here's the main part. Note this is part of an argument about MWP. -------------------------------------------- CO2Science is pretending to be thorough and systematic by listing a lot of research and categorising them by wether they are warmer than today or not. And thus they prove MWP was warmer ... but do they really? Well it's not hard to debunk them. It's taking me far longer to write this up than it did to see their errors. And I'll also point out how some of the graphs are trying to Not only that, there's some examples of misleading graphs that are obscuring the fact that the data for their MWP is not warmer than today. Temperature reconstructions are done using a lot of studies from around the world. Each one contributes a small picture of what it was like in that part of the world, depending on the geography this can be a very localised effect, or it can be representative of a much larger area. What CO2Science are doing is looking for any warm part in each of localised data, then labelling that as the MWP, regardless of the dates involved. Firstly take notice of what is commonly regarded as the MWP period, a time from AD 950–1250, that's 300 years centered around AD 1100. Now lets examine a few of the examples from CO2Science that I listed earlier. Sicre-2008 notice that their label for the MWP sits over the AD 1000-1300 and avoids the lower temps in the 950-1000 period. Take that into account and the average temps are below CWP. Look at the smoothed red line (running average) and it sits below modern day temps for almost the entire MWP. Paulsen-2003 – they have the MWP centered around AD1300. For the actual MWP, 950-1250 the average is well below todays temp (shown on the left). Althoug even if you did take their proposed relocation of the MWP, it still would be cooler than today. Kitagawa-1995 – (note graph is inverted here – warming is downwards). On initial viewing this show mostly good warming but some radical cooling amongst it too. So what's up with that? Well firstly have a look at the number of samples used to construct this graph. It contains very few samples and hence you can't get good confidence from it. The graph only goes to 1950 so it doesn't include more recent decades of warming. It also has a baseline (horizontal line) that is well below (temp-wise) the CWP, but this baseline is not the CWP. The average person might be fooled ito thinking the basline was "normal" temps, but if you look closely you'll see todays temps are higher than the average for the MWP. Zhang-2003 – the label for MWP is again off by a couple of hundred years in order to make the reader think it includes the higher parts of the graph rather than one high and one low. Abcde would also probably point out that this is tree-ring data, hence the large variation would also attract large error bars. Loso 2008 sadly for you this one completely fails to provide evidence that the MWP was warmer than today. Even though they did their best to move the MWP away from AD950, the warming it shows doesn't compete against the decade upon decade of recent warming.
    0 0
  6. What they will usually propose as a counter argument is that 1) the proxy dating can be off somewhat, 2) the proxy data is a >50 year average, so you have to compare it with the >50 year average now, which is (not yet?) the highest. If the temperature keeps on rising it will be a waiting game until the latest 50 year average will be above those of the previous 1000 years. They should include the resolution of the proxy data in the graph so that you can find out if the "peaks" are for example 5 year, or 50 year "averages".
    0 0
  7. Oh well. 1950 y - proxies finished? Let me quote (one of the most recent - 2009.) 2 publications that I was able to quickly find: 1. von Gunten, L. et al. 2009. A quantitative high-resolution summer temperature reconstruction based on sedimentary pigments from Laguna Aculeo, central Chile, back to AD 850. The Holocene 19 : 873-881. „Von Gunten et al. developed a continuous high-resolution (1-3 years sampling interval, 5-year filtered reconstruction) austral summer (December to February) temperature reconstruction based on chloropigments derived from algae and phototrophic bacteria found in sediment cores retrieved from Central Chile's Laguna Aculeo (33°50'S, 70°54'W) in 2005 that extended back in time to AD 850.” "... quantitative evidence for the presence of a Medieval Climate Anomaly (in this case, warm summers between AD 1150 and 1350; ΔT = +0.27 to +0.37°C with respect to (wrt) twentieth century) and a very cool period synchronous to the 'Little Ice Age' starting with a sharp drop between AD 1350 and AD 1400 (-0.3°C/10 years, decadal trend) followed by constantly cool (ΔT = -0.70 to -0.90°C wrt twentieth century) summers until AD 1750." It is obvious here, that max. warmth of the MWP is about 0.5°C higher than that recorded for the past two decades (!!!) of the 20th century ... 2. Oppo, DW, Rosenthal, Y. and Linsley, BK 2009. 2,000-year-long temperature and hydrology reconstructions from the Indo-Pacific warm pool. Nature 460 : 1113-1116. Here MWP was about 0.4°C warmer than the Current Warm Period. Well, it is worth mentioning: Grudd H, (2008): Torneträsk tree-ring width and density AD 500 – 2004 [!!!]: A test of climatic sensitivity and a new 1500-year reconstruction of north Fennoscandian summers. Climate Dynamics, 31: 843-857. “The new data show generally higher temperature estimates than previous reconstructions based on Tornetra¨sk tree-ring data. The late-twentieth century, however, is not exceptionally warm in the new record: On decadal-to-centennial timescales, periods around AD 750, 1000, 1400, and 1750 were EQUALLY WARM, OR WARMER.” These are just some "cherry picking" from my references. Which is interesting: the recent - later works - the MWP warmer ...
    0 0
  8. Nicely done Brendon. This thread goes straight into my "saved" list. A quick comment on the Sicre-2008 link: I'm not sure I agree with you that the Labeling of MWP on the chart is misleading. CO2 Science do use the actual SST chart, including labels, from Sicre et al. They have altered it though, by adding their own green "modern temperature line". They put the line at 9°C -a modern day "average' of their own selection to be sure. I couldn't find a modern day SST average for the seas around Iceland, but This paper by Jiang et al demonstrates on page 2 that the peak warmth of the medieval period was a good 2-3°C lower than recent peaks. I am not in a position to calculate averages from this data, but I would suggest CO2 Science's 'thin green line' deserves some skepticism.
    0 0
  9. I assume "They are showing you that the last decade was warmer than any 50 year period on the graph including the MWP." is meant to read: "They are not showing you that the last decade was warmer than any 50 year period on the graph including the MWP.
    0 0
  10. Arkadiusz #7 What happens when you put all those in a statistical, comprehensive reconstruction (global or at least hemispheric)? To cite local reconstructions is like cherry picking 100 Chinese companies that are having bad results to "prove" that Chinese economy is not growing.
    0 0
  11. The core issue is the validity of methodologies based on a temperature reconstruction derived from multiple and variously selected proxies statistically homogenised and spliced onto a modern instrumental record. Perhaps you could invite a guest post from Steve McIntyre - that would warm things up :).
    0 0
  12. Oh, and let's not forget the underlying skeptic argument here: "If the MWP was warmer for whatever reason, then the CWP is due to the same reason" That's like arguing "John was responsible for 1957's murders, therefore he killed those people yesterday". There are forcings responsible for the MWP as well as the Little Ice Age. The climate does not change out of sheer bad mood. It would be necessary to show that the forcings active in the MWP are active now as well. Even if Lamb's graph proved to be accurate for global temperatures, and even if temperatures "now" were those indicated by the infamous Global Warming Swindle, CO2 would not stop obstructing longwave radiation because of that.
    0 0
  13. Arkadiusz, I could not read Oppo et al, but am interested that they use coral growth rates as a proxy. I found the Grudd paper very interesting. One cannot draw too long a bow from it, as it's focus is only on the region of Fennoscandia. Grudd's method of combining tree growth ring width and maximum ring density raises interesting questions about the appropriate use of tree ring data as a proxy for temperature. I would be particularly interested to know if Grudd has applied this analysis to the same tree datasets used by Manne et al. I am still getting through von Gunten! I note it is a very recent paper and stands out as one of the uncommon studies set in the southern hemisphere. There are two general points I would make: First, paleoclimate always involves proxies for temperature. Given that there are so many kinds of proxy, be it tree rings, ice cores, sediment analysis or whatever else, a general position can only be formed by synthesising a diverse selection. Therefore no individual study trumps the others. Second, as new studies circulate and new proxy methods are developed, we may well find the majority of studies indicate a medieval warm period comparable to the current period. Personally, I wouldn't be too fussed. I'm not terribly attached to the "hockey stick". It is a supplementary analysis, not a critical one - Alexandre's point. The hockey stick happens to be memorable and therefore was placed in a spotlight during the political vetting of the IPCC report.
    0 0
  14. #6 Arjan: I've tried to cover that, the most recent 50 year average is not above the Lamb MWP 50yr average. In order for the 50 year average to _not_ go above Lamb's MWP peak then HadCET will have to cool more quickly over the next 20 years than it has warmed for the past 20. Possible, but seems unlikely unless something special happens (perhaps a collapse in solar activity which may be linked to cool European winters). I thought of including that in the post, but I didn't want to make it any longer!
    0 0
  15. "They are showing you that the last decade was warmer than any 50 year period on the graph including the MWP"
    Well, but (for the sake of argument, because the graph is probably obsolete) such a comparison might be tricky, might not? Given that this graph doesn't provide us with the decadal averages prior to 1920 and given that the last 50-year average is similar to that in the MWP, it would be conceivable that, similarly, a single decade had reached similar values in the MWP, wouldn't it? (let's say, for example, with temparature rising from 1100 to 1200 similarly to the 20th Century, and falling in a similar way from 1200 to 1300).
    0 0
  16. There is an updated version of the Lamb graph that use a 50 years gaussian smooth: Jones et al. 2009
    0 0
  17. Jesús Rosino, in principle, you're right. But you need to be carefull. Immagine that 1000 years ago the temperature varied slowly exactly as shown in the figure. You could easily find the "right" degree of smoothing to "prove" that the temperature was higher than today. Anyway, we luckly have decadally (or even better) resolved proxies going back 1000 years and more. Noisy data, though, so one still needs to smooth them somewhat to make graphs; but we can exclude the possibility of large short term temperature swings. Here, for example, you'll find northern emisphere 40 years smoothed data, including instrumental period.
    0 0
  18. I'm a bit skeptical towards all sorts of proxies, as long as we don't know the full picture. Just look at this NH winter: Close to record-breaking many places, but still high UAH measurements. And rather small changes in key parameters, like the NAO for Europe, can produce large and significant local effects, often without NH or global averages being affected at all. Therefore, you can produce a wide range of "reconstructions", and the main problem is, that because you always use some theories when reconstructing, you are always doing some kind of cherry-picking. Also, when comparing things like vegetation or wildlife, we must take ecological succession time lags into account. Because of all those uncertainties, I think that using expressions like "unprecedented warming" is just asking for trouble. Unprecedented forcing, yes, but I can't see why we should be so sure about the warming. And just face it: The hockey stick is probably one of the worst things that has happened to climate politics. Some simplifications are useful, that one is not. It's much easier (and wiser) to lay the burden of proof on the "skeptics": Show that _global_ mean temperature in any century of the past was, say, 0.6 deg above last 15 year average. If you discard or weigh down some data, explain why. That would be a way to show that the MWP really was a warm period, contrary to the present. Why require the MWP to be so much warmer than now, they would probably ask. Because now we are experiencing a rather large radiation imbalance. If we were in a similar situation then, forcing conditions must have changed drastically in order to produce the LIA only a couple of centuries afterwards. With ca 0.15 degC warming/decade, it will just take a few decades for us to leave MWP territory altogether.
    0 0
  19. Mark, We skeptics usually add vikings to the IPCC diagram. This was done perfectly here: http://friendsofginandtonic.org/page4/page9/page9.html Please add at least a Robin Hood.
    0 0
  20. SNRatio #18 I´m not sure about the possibility of a "wide range of reconstructions" (as in a wide range of different results). All the reconstructions are very coherent with one another. This consistence suggests it´s not as arbitrary as you seem to imply. You think there wouldn´t be people and funding available to issue a paper showing the current warming has nothing special? Yes, the burden of proof is now with the skeptics, after all there are already a handful of published studies largely supporting the "hockey stick´s" findings. Having said that, past surface temperature does not really deserve all the attention it´s got. But we don´t have a "total planetary heat content proxy", so we have to do the best we can with what we´vc got... PS: cold NH winter is not inconsistent with a warm planet in the same period. Check this and this.
    0 0
  21. The MWP may be of interest to many, but the real interest should the temperatures reached during the interglacial periods, and what forcings or feedbacks turned the planets warming phase into a cooling phase.
    0 0
  22. I have recently blogged on how co2science has misrepresented a recent study of proxy data from the Indo Pacific Warm Pool. You can read about it and its implications for the medieval warm period: Misrepresentation of Climate Scientists
    0 0
  23. By the way, the study referred to by Oxford Kevin is the second link given in #7 of this thread, in which Arkadiusz claims the paper shows "Here MWP was about 0.4°C warmer than the Current Warm Period." The study's lead author, on the other hand, says "Our figure does not lead one to conclude that past sea surface temperatures were warmer than today as is suggested on these websites."
    0 0
  24. A quick and lazy google search didn't bring me anything good on Medieval sea levels. It seems if it was anomalously warm for such a long period, there should have been a rise. But this figure, at least, doesn't show much evidence of a high point at the right time. Anyone else have something better?
    0 0
  25. I feel ignorant about this, as about so many other subjects. I've got three questions for those who know more. I do understand that the "other side" of the discussion cares a lot about the possibility that there was a period sometimes during the middle ages when the climate was warmer than today. The facts seem to be against this (see the argument on MWP), but there are certainly also some evidence contradicting this and suggesting a medieval global warm period. (Arkadiusz Semczyszak lists some of those). Now, suppose for the sake if the argument that this assumption is actually true, and that there was a medieval global warm period. This would make some people instantly happy, for the simple reason that it would invalidate the hockey stick. But we should look beyond the hockey stick. What is the theory about the medieval warm period over on the "other side"? One possibility is that they assume that it was caused by some particular forcing. If they do, they should explain why the same forcing is at work now. Except for AGW there seems to be only one possible alternative candidate for this contemporary forcing, some version of the solar theory. One should expect some arguments about similar but stronger solar forcing in the middle ages. (Q1) Has anyone tried to carry this out? But if the argument is that some period in the middle ages was warmer than today, the most likely theoretical underpinning would be that the climate has a huge internal variation, and that the medieval warm period, the little ice age and the present warming are all caused by this internal variation. I don't know how we can be sure that there is no internal, unforced variation which could be responsible for climate changes on the scale of centuries. (Q2) Is there a way to do rule out such internal variation? If the "other side" honestly belives in this scenario, those people should now be working hard on characterizing and describing this internal variation. Which variables (besides temperature) change, how do they influence each other etc. (Q3) Is anyone aware of such work?
    0 0
  26. Alexandre @ 12 Oh, and let's not forget the underlying skeptic argument here: "If the MWP was warmer for whatever reason, then the CWP is due to the same reason" Actually, this is not central to a skeptical argument. McIntyre for example eschews any position on AGW. SNRatio @ 18 puts it well" Therefore, you can produce a wide range of "reconstructions", and the main problem is, that because you always use some theories when reconstructing, you are always doing some kind of cherry-picking. The issue remains - are our reconstructions valid? If not, no hypotheses can flow from them. If they are, then AGW is a prime suspect and our world faces major decisions with very wide ranging impacts.
    0 0
  27. "There appears to be plenty of evidence for some places being warmer than today in the MWP, and whilst most studies say that globally it wasn’t warmer it seems that scientists still want more data to be sure (and if it was warmer, that might suggest higher climate sensitivity). " I don't think that most pro AGW advocates really understand the skeptic position on the MWP and climate sensitivity. The skeptic position about the MWP goes somthing like this: The climate can be very sensitive to solar variation/clouds/1500 solar cycles etc to produce someything like a strong MWP, but NOT be sensitive, or act in a linear fashion, to any changes in C02. Skeptics don't see why one has to raise all variables when one raises overall climate sensitivity, or that they operate in tandem when one or the other changes. Depending on the way various climate factors interact, some climate variables (eg water vapour/clouds, c02, solar cycles) can act in a non-linear fashion-ie when one goes up the other goes down. There can be negative feedbacks. Evidence for this is eg provided in the relationship between C02 and temperature in the 20th century, and also in the early 21st. Volcanoes also act in this matter, small eruptions produce overall cooling, very extended events produce overall warming. Another common position of skeptics is that the earth buffers various climate variations/forcings, by eg absorbing radiation imbalances in the deep oceans, by microbiological changes in soils, by lesser and greater amounts of cloud cover-especially in the tropics, and so on. There is no need for climate to act in a linear fashion to all these sort of changes, and yet all the IPCC models assume such. So there is no basis in arguing that if the MWP was strong, this necassarily means climate sensitiviy is high with respect to C02, which is the common argument on this website.
    0 0
  28. Given your main criticism of sceptics is they end their graphs too early I'll point you to a couple of 2010 paleoclimate reconstructions in Greenland ,Indonesia and Multiple SH sites that put the MWP as warm as present day. (The following bit is just my opinion; I have no references for it, hopefully it won’t get removed.) Whether the MWP was warmer, as warm as or cooler than the present period seems to only be of political interest. It allows the following political statement "Today’s temperature is unprecedented in the past 2000 years". I recognise that much of the rightwing opposition to AGW also takes a general anti-science, anti-rationalism stance (so you have to pick your sceptics carefully). But this, for me, is one of the issues where climate science itself seems to have strayed from a purely scientific approach into the area of politics and it’s need for certainty. There is a whole raft of data that questions the ‘hockey stick' theory and other data that supports it. It strikes me as a question that is still firmly under debate. This post seems to focus on sceptics as the villains here, clouding the issue with misleading graphs. I'd like to see some criticism of the IPCC for forcing certainty onto this issue.
    0 0
  29. thingadonta - ultimately, climate sensitivity is not really a "per doubling of CO2," even though it's usually described that way. Instead, climate sensitivity is really a measurement of temperature rise per unit of energy imbalance. In electrical engineering/feedback terms (my profession), climate sensitivity is the gain in the system. By definition, the gain term operates equally on positive feedbacks, negative feedbacks, and inputs. And that means that the climate sensitivity/gain must respond to a change in energy imbalance caused by solar energy input equally to a change in energy imbalance caused by CO2 to a change in energy imbalance caused by volcanic sulfur dioxide to a change in energy imbalance caused by clouds. The mechanisms of each of them may be different, but the mathematical equations require that the gain affect each identically. This is true even if the different aspects of climate operate on different time scales. The only difference is that climate sensitivity/gain becomes a function of time (or frequency), but every forcing that operates over the scale of 1 year must be treated identically just as every forcing that operates over the scale of 10 years must, and so on.
    0 0
  30. "The issue remains - are our reconstructions valid? If not, no hypotheses can flow from them. If they are, then AGW is a prime suspect and our world faces major decisions with very wide ranging impacts." But hypotheses about AGW DONT come out of paleoclimate. This is the important point. AGW is byproduct of a theory of climate which comes out of physics. In turn, if it is valid, then it should be able to reproduce past climate given past forcing, (obviously within the uncertainties to which you can measure both past global climate and forcings). Its a test of a model, not the progenitor of a model.
    0 0
  31. #28, HumanityRules, it is a bit misleading to say the main criticism is that they end the graphs too early. Ending the graphs too early in order to make a misleading or false impression using those graphs seems more like it. What you describe as a "political statement" can be rephrased slightly as a legitimate scientific question: "Is today’s global average temperature, averaged over a few decades, higher than any such time period in the past 2000 years?" Once you specify the averaging time and the total time span, that is a question that has a yes/no answer. Our best estimate of the answer may or may not be yes/no at this time, but the question is objective and not political. Mann made the claim in 1998 that it was, with an averaging time of a decade, and this was the only scientific conclusion of his 1998 paper that has not stood up. He was wrong not because of any error specifically in his work, but because the uncertainty in radiometric dating is more than a decade, so you can't connect records from different parts of the world to a single decade in time. His error was in failing to recognize this uncertainty in time. So the test for "unprecedentedness" has to be done over a longer timescale, like perhaps 50 years, and the total interval might need to be only 1000 or 1500 years rather than 2000 because of limitations in the older data. But in the end this is only one small part of the story, and in the end what matters far more than the size of past temperature changes is the ability to explain them based on fundamental physics.
    0 0
  32. #26 chriscanaris, in your comment you seem to be mixing up a couple of very different things. The data may permit a wide range of reconstructions, but that does not mean "anything goes", and does not mean that picking the average or most likely reconstruction is "cherry-picking". Maybe you need to look up the term! In any case, if you look at the reconstructions in scientific papers (and the recent IPCC reports) they come with error bars or shaded error regions, which show you how precise the estimates are. Presenting the best estimate, with a description of how you got it and its error bars, is very, very far from cherry-picking.
    0 0
  33. I believe that you are missing the word "not" in this sentence. They are showing you that the last decade was warmer than any 50 year period on the graph including the MWP. You need not post my comment, after correcting your sentence. Excellent, clear, informative post.
    0 0
  34. Even if the contrarians could prove-definitively-that the absolute temperature anomaly was higher in the MWP than today, there are still other issues to consider-namely the *rate* of change & the presence or absence of forcings to explain the previous warming events. Take a look at all the MWP reconstructions-even those produced by contrarians-& you see that it was a multi-century event (300-600 years from trough to peak, depending on which graph you look at). By contrast, we're seeing an almost identical magnitude of warming in the 20th century in the space of merely 50 years-a massive difference! The other point is that a look at proxies for Total Solar Irradiance during the MWP show a strong upward trend during that period, wheras the TSI for the last 30 years has been on a slight downward trend. So over the last 60 years we've seen an unprecedented *rate* of warming, without the forcings that characterised past warming events!
    0 0
  35. 34.Marcus Would "the contrarians" include Phil Jones (of CRU fame) who co-authored two of the papers I linked to in #28? 31.Jeff Freymueller I agree with what you say except I still think you can't ignore the political interference in this subject on both sides of the argument. It's what takes it from an interesting scientific problem to a controversy. Given you recognise the limitations and problems with the science why do you think Mann et al are so defensive about critisism? I'm aware of egos but a drive should be to improve the science and that partly comes through critical analysis.
    0 0
  36. It is a challenge to stay clear-eyed about the Hockey Stick, because it has been such an iconic image and therefore of tremendous political importance. It has been used by the IPCC, Al Gore and others, precisely because it is so much more effective a communication tool than virtually any other illustration. It is certainly the image that got me tuned into the global warming problem -and I bet that is also true of many readers of this site. It is also no accident that the earliest attacks from AGW deniers were against the hockey stick and often Manne personally. The focus of AGW deniers is to score political wins; they use the language of science, because in this culture it adds gravitas, but their main targets are always the stuff laypeople can easily understand. People reasonably acquainted with the science know the various studies that comprise the hockey stick are only a small part of our overall understanding of climate change. Politically, however, it would be a massive coup for the deniers' camp if they could tear it down. The hockey stick has been given a political importance far beyond its scientific importance. So far as I can humbly tell, it has also yet to be proven wrong. But that could change, and we must always take care not to argue for a scientific theory because of the political consequences of it being incorrect-leave that to the Moncktons and Plimers of this world.
    0 0
  37. "... like cherry picking 100 Chinese companies that are having bad results to "prove" that Chinese economy is not growing. ..." - Is sophistry The existence of these "100 Chinese companies" however, proves that the "Chinese economy ..." not everything" is in order ... Incorrect interpretation - the use of cherry picking theory; is "a nightmare" discussion about climate ... "... the *rate* of change & the presence or absence of forcings to explain the previous warming events ..." Small "* rate * of change" in the earlier research (MWP) showed (in large part) of using a wavelet "old style" - excessive "smoothing" reconstructions (especially multi-proxies). About this repeatedly, even by Tamino. "... forcings ..." Polish climatologist of the our greatest University (Cracow), Professor Boryczka, forecasting solar activity and the NAO, believes that awaits us, in the XXI century (circa 2070-2100), a strong natural warming (the imposition of the cycles of 100 and 180 years - I would add Millennium x 3) - greater than in the MWP - MWA and CWP-CWA.
    0 0
  38. Semczyszak, even if Professor Boryczka is right it would not be smart to lower our chances of a safe landing after the pending climate crises. I mean, if there will be a natural trend of, say, 2 °C for the next century it surely won't help to add 3 more degrees ourselves. Or should we be so nihilist to say we're doomed anyways and we should not even try to fight?
    0 0
  39. thingadonta> OK, so according to you, the (a?) skeptic position is that there is some external forcing that caused both the medieval warm period and the present warm period. Can this be made more precise? I would like to know what mechanism is supposed to be responsible. The linearity probably comes from the assumption that effects are differentiable functions of causes. This is a very common assumption, and by definition it means that if the cause is "sufficiently small", then the effect depends linearily on the cause. Your example with the volcanoes is not relevant here, because you are talking about large effects. There is a catch of course, namely whether the causes really are "sufficiently small". As for climate sensitivity varying with the forcing, I think that we first have to agree on the definition on "climate sensitivity". The IPCC is guilty of confusing this issue, as discussed in the first 15 lines of wikipedia's article on climate sensitivity . But lets go with their latest definition. According to this, climate sensitivity is the reaction of the system of an increase in temperature. That is, suppose that a forcing would cause a temperature rise of RF if there were no feedbacks. We would like to know how big the increase would be if we include the feedbacks. The climate sensitivity provided by the feedbacks would conspire to give a temnperature rise of l * RF, where the number l is the climate sensitivity. So in this definition of climate sensitivity, it does not depend on any particular forcing. It is determined by the reaction of the system to an increase in temperature. Maybe I'm missing some point here.
    0 0
  40. #28 HumanityRules: My main criticisms of using graphs like that (there were many examples on CO2science, I might put them up in another post) are that they often concentrate on one region or that they cut off post 1950. Now, that isn't necessarily a problem with the science. Sometimes proxies don't go after 1950 for whatever reason. But to claim that this shows the MWP was warmer is just wrong. You need alternative evidence to do that & so far I'm not aware of any reconstructions of hemispheric or global means from significant #s of proxies that show that.
    0 0
  41. Just how many studies would be enough to satisfy the so-called skeptics ? NOAA have published the data for nearly 100 reconstructions, and shown them individually here, along with visualisations, using lots of proxy data types Will any number of studies satisfy those who want to keep believing in a 'broken' hockey-stick or a 'lying, cheating, etc.' Mann ? I don't think so.
    0 0
  42. I don't think it's valid to compare the 10yr average now with the 50yr average from 800yrs ago, you need to plot the 10yr averages for the whole graph or, inconvenient as it may be, stick with the current 50yr average.
    0 0
  43. 40.MarkR Mann in 2009 produced a paper that purported to show that the MWP was a regional occurence (essentially NH). You can read John's post about it here. Was there a Medieval Warm Period? That paper uses 6 SH series that stretch back to the MWP that show a lack of warming in the SH. The papers I link to in #28 include 5 SH series that show greater temperature variability than Mann and show the MWP as warm as the present. The Mann 2009 paper was uncritically presented on this website as proof of a regional MWP. So is 6 a "significant #s of proxies" while 5 is insignificant?
    0 0
  44. Thingadonta @ post 27. The "skeptic" position as you define it seems to be total nonsense. Why would the climate be more sensitive to a radiative forcing than another? How could the Earth/atmosphere system react differently to an energy imbalance according to the origin of that imbalance? How does the Earth "know" to react little from the extra w/sq.m coming from GHG but lots to that of solar irradiance? It makes no sense. What possioble physical processes could be at work in such discrimination? Where does the extra energy go for "low sensitivity" forcings? Are you sure that this is what "skeptics" argue? Is that what you believe?
    0 0
  45. #35 Humanity Rules, I think it would be a surprise if Mann was NOT defensive, given the politically motivated assault that has been made on him personally and on his work. I think nautilus_mr has it right in #36 about the intuitive power of the hockey stick graph, which is why so much is made in many skeptical camps about that one result. Hint: he's not being attacked because he reacts defensively, but because some don't like the conclusions of his work. Whether ego or other personality factors contribute to his reaction to criticism, I really don't know because I've never met him and only had one second-hand interaction with him. I have my own guesses but it's just speculation. I haven't read all of the relevant papers on the paleoreconstruction topic, but the papers I have read demonstrate exactly what you call for: a drive to improve the science. Criticisms are made and countered in the literature, on this topic as well as many others. What is different on this topic is that there is a firestorm of criticism (and noise and distortion) outside of science because of the political implications of the results. I'm not saying that there isn't or can't be legitimate criticism as well, but my assessment is that most of the "skeptic" criticisms of Mann are based on nonsense (or character assassination) or on nitpicking that has had little impact on any conclusion (the decade claim I mentioned before being the one conclusion that didn't hold up). Otherwise, more than a decade of subsequent work and a lot more data has not altered the fundamental conclusions. The last paragraph of #36 is also on the money as far using science to address issues that are also politically important. On issues of political importance, we know and expect that people with financial interests will hire lobbyists and mouthpieces whose job is to say anything, regardless of facts, to advance the interests of their clients. Scientists have to be careful to stick to presenting the results and implications of their scientific work, but if we don't say what our results are and what our science tells us about potential options and consequences, then I think we would be doing a disservice to the people who ultimately pay the bills for research.
    0 0
  46. I have also recently blogged on why i think the Hockey Stick isn't broken: The Hockey Stick is Accurate
    0 0
  47. HumanityRules> New data on the middle age climate arrive all the time, and I don't think that this case is closed yet. But the paper by Mann etc. seems to be a strong paper, even if it does not seem to take all available published proxies into account. I can't see that the paper about South America by Neukom et al. that you linked to contradicts the Mann paper, they claim that the summers in SA were "mostly above the 1901–1995 climatology". They do not claim that they were as warm as now. The paper by Oppo et al. is about the tropical waters around Indonesia, so it's not really southern hemisphere. It also has temperatures around 1200 well below present temperatures, and also estimated temperatures below the estimated North Hemisphere average (figure 3). So I can't see that paper as contradicting Mann's paper either. I'm sure you have read those two papers closer than I have. If I'm missing something, please explain.
    0 0
  48. JMurphy "Just how many studies would be enough to satisfy the so-called skeptics ?" JMurphy, you seem to fundamentally misunderstand the sceptical position. To answer your point, may I ask you how many times a politician has to tell you they saved the planet from global economic collapse for you to believe them? Repetition of the same assertions which are not believed do not and should not increase belief in those assertions. Moreover, science is on the side of the sceptic, because science is inherently sceptical and requires those making assertions to prove what the say; it does not require the sceptic to disprove it! But at a more systemic level, the climate community have systematically failed to address many of the concerns raised by the scientifically sceptical. Rather than accepting reasonable criticisms of the problems of the modelling, "unknown unknowns" and most importantly the abysmal temperature record (my speciality) there has instead been a nasty smear campaign against anyone who dared to be scientifically sceptical. Far from making us believe you are “scientists” this smear campaign smacks of blatant political propaganda and unfortunately anyone no matter how political they are in the subject, is tarred with the same brush. Moreover, the climate community have hardly done themselves any favours by their response to the behaviour revealed in the climategate emails. As some have said such things can go on in any academic field, but whilst a firm rebuke from the discipline would have given us some confidence that the behaviour in the emails was not deemed acceptable, the silence and (from our view) a whitewash of inquiries has shown to the sceptics what we now see as a community of academics with absolutely no willingness to bring the standards of their discipline up to the standards the sceptics believe is appropriate for such a high profile world-wide important and hugely costly area of research. So, much of the sceptical response to the climate community is self inflicted by that community. Most sceptics are not heartless animals. We are mostly people with real life experience or real life situations, where we have seen how people can be misled by statistics and a "bee in their bonnet" to come to the wrong conclusion. It is not the number of reports that matter, it is the quality and impartiality of those reports and so long as we continue to read reports that are clearly biased in that they fail to acknowledge simple things like urban heating, the poor siting of sensors or simple statistical facts like the cooling this century or that if there were warming it would have considerable benefits by reducing the number of cold related deaths in Norther latitudes.... basically so long as we can see the reports are obviously biased, it won't matter how many are produced because our training tells us that it is not scientifically appropriate to “believe” them.
    0 0
  49. Mike, that was 6 paragraphs and 470 words without a single specific complaint about science or for that matter data visualizations. Not that anybody's counting, but you may have set a record... ;-)
    0 0
  50. #45 Jeff Freymueller "I'm not saying that there isn't or can't be legitimate criticism as well, but my assessment is that most of the "skeptic" criticisms of Mann are based on nonsense (or character assassination)" Well said. Focusing on Mann's reaction to criticism, as some skeptics are wont to do, amounts to little more than ad hominem. How he responds to attacks on his work really has no bearing on the quality or reproducibility of that work.
    0 0

1  2  Next

You need to be logged in to post a comment. Login via the left margin or if you're new, register here.


The Consensus Project Website

THE ESCALATOR

(free to republish)


© Copyright 2024 John Cook
Home | Translations | About Us | Privacy | Contact Us