Climate Science Glossary

Term Lookup

Enter a term in the search box to find its definition.

Settings

Use the controls in the far right panel to increase or decrease the number of terms automatically displayed (or to completely turn that feature off).

Term Lookup

Settings


All IPCC definitions taken from Climate Change 2007: The Physical Science Basis. Working Group I Contribution to the Fourth Assessment Report of the Intergovernmental Panel on Climate Change, Annex I, Glossary, pp. 941-954. Cambridge University Press.

Home Arguments Software Resources Comments The Consensus Project Translations About Support

Bluesky Facebook LinkedIn Mastodon MeWe

Twitter YouTube RSS Posts RSS Comments Email Subscribe


Climate's changed before
It's the sun
It's not bad
There is no consensus
It's cooling
Models are unreliable
Temp record is unreliable
Animals and plants can adapt
It hasn't warmed since 1998
Antarctica is gaining ice
View All Arguments...


Username
Password
New? Register here
Forgot your password?

Latest Posts

Archives

Could global brightening be causing global warming?

Posted on 31 May 2010 by John Cook

One skeptic argument, employed by Christopher Monckton in his testimony to US Congress, is that global brightening is the cause of global warming. From 1983 to 2001, the amount of sunlight hitting the Earth's surface has increased by 1.9 W/m2. Monckton compares this to the radiative forcing from manmade influence since pre-industrial times, estimated at 1.6 W/m2 (IPCC AR4). Monckton argues that these numbers prove global brightening is responsible for recent global warming. But is this the full picture?

Monckton's numbers come from Do Satellites Detect Trends in Surface Solar Radiation? (Pinker et al 2005). This study analyses satellite measurements of solar radiation, upward radiation from the Earth and cloud cover fraction to model the amount of sunlight reaching the Earth's surface. They calculate an overall increase in surface solar radiation of 0.16 W/m2 per year. Once the satellite data is corrected to remove an orbital decay bias (ERBE 2005), Monckton calculates a net increase in surface radiative flux of 1.9 W/m2.
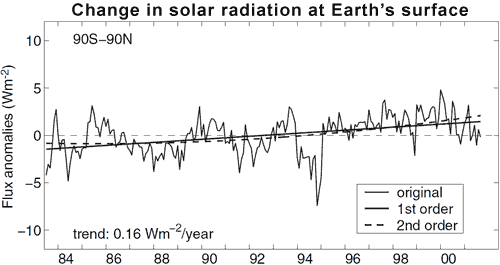

Figure 1: Changes in solar radiation at the Earth's surface from 1983 to 2001. Solid line is linear fit, dotted line is quadratic fit. The linear slope (solid line) is positive at 0.16 W/m2 per year (Pinker et al 2005).

Is it valid to compare changes in surface solar radiation to radiative forcing? A good person to answer this is Rachel Pinker herself who in responding to Monckton's argument, said the following:

'The CO2 "radiative forcing" value that Mr. Christopher Monckton is quoting refers to the impact on the Earth’s Radiative balance as described above. The numbers that we quote in our paper represent the change in surface SW due to changes in the atmosphere (clouds, water vapor, aerosols). These two numbers cannot be compared at their face value.'

Why can't you compare the two numbers? Radiative forcing refers to a disturbance in the planet's energy balance. Forcings change the balance between incoming sunlight and outgoing radiation at the top of the atmosphere, causing the planet to lose or gain energy. Global temperatures will only respond to surface brightening if the total amount of solar energy absorbed by our climate system changes. To determine this, we need to understand what's causing global brightening.

There are three major contributors: a reduction in cloud cover, a reduction in scattering aerosols such as sulfates and a reduction in absorbing aerosols like soot (Wild 2009). Scattering aerosols reflect incoming sunlight, preventing it from reaching the Earth's surface. As the amount of sulfate pollution in the atmosphere lessens, more sunlight reaches the surface. If this was the sole cause of global brightening, then the increase in surface solar radiation would equal the extra energy absorbed by our climate (eg - the radiative forcing).

However, changes in cloud cover and absorbing aerosols also contribute to global brightening. As well as reflect sunlight, clouds trap infrared radiation coming up from the surface. So while less clouds allow more sunlight to reach the surface which has a warming effect, they also let more infrared radiation escape to space which has a cooling effect.

Similarly, a decline in absorbing aerosols like soot means more sunlight reaches the Earth which has a warming effect. But they also absorb sunlight which warms the atmosphere so a decline in absorbing aerosols also has a cooling effect. Absorbing aerosols like black carbon have shown a large decreasing trend since the 1980s (Wild 2009).

To focus solely on the amount of sunlight hitting the Earth doesn't give you the full picture of global brightening. As absorbing aerosols and clouds are contributing factors,  the change in surface solar radiation is expected to be much more than the net radiative forcing from global brightening. To gain a fuller understanding of climate, we need to consider all the various forcings together rather than take one small piece in isolation. These include the direct effect from reflective aerosols, the indirect effect of aerosols on cloud cover and the effect of absorbing aerosols (black carbon) to name just a few.
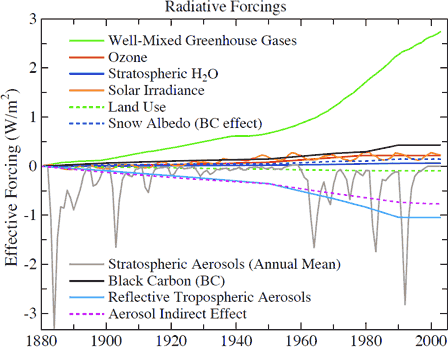

Figure 2: Separate global climate forcings relative to their 1880 values (
GISS).

Figure 2 demonstrates that CO2 is not the only driver of climate. Nevertheless, it's clear that man-made greenhouse gases (of which CO2 is the greatest contributor) is currently the most dominant forcing and  increasing faster than any other forcing.

0 0

Printable Version  |  Link to this page

Comments

Comments 1 to 21:

  1. Did not Lord Monckton make an argument once for Global Cooling? You know, the one based on a falsified version of an UAH globally averaged satellite based temperature chart, conveniently cut off at 1998 to show an artefactual drop in temperature? Pray tell, Lord Monckton, which is it? Global Cooling or Global Warming through whatever means?
    0 0
  2. Interesting to see Fig 2 showing that GHG forcing has tripled in the last century when GHG concentration has only increased by a factor of 1.5.
    0 0
  3. RSVP: the 1900 GHG value in Fig 2 is ~0.2, while the 2000 value is ~2.7 or so. That seems like much more than a tripling to me! It's rather scary to see the GHG forcing was growing exponentially from ~1940 through to the late 1980s or so, where it seems to have tapered off dramatically. Does anyone have any idea why the sudden drop in the rate of increase c.1990? Is it to do with changing patterns of energy use, or something else?
    0 0
  4. So what does figure 1 tell us? How much of the sun's energy is reaching the surface? This must be of some importance to temperature change? 3.Bern I think it's reduced methane.
    0 0
  5. Bern I was talking about 250 ppm vs 380 ppm... a factor of 1.5 roughly. The units in Figure 2 depict energy per square meter, not concentration. In terms of the relationship between concentration and energy, concentration is the independent variable, while energy is the dependent variable. Energy normally increases as the square root of a linear change in the independent variable.
    0 0
  6. "Interesting to see Fig 2 showing that GHG forcing has tripled in the last century when GHG concentration has only increased by a factor of 1.5." Given that the zero point of this graph is, rather obviously, the effective forcings in 1880 don't you think it's an imaginative leap, to put it mildly, to say that the GHG forcing has tripled?
    0 0
  7. Either way, Ed Davies, what RSVP hasn't factored in is that we're *not* just talking about CO2-it represents *all* GHG emissions-& CH4 is a more potent GHG gas, & has risen at a sharper rate than CO2. It could also explain why it leveled off modestly around 1980-the leveling off of methane emissions (but they've started to climb again!)
    0 0
  8. Consider this though HR. Sunspot numbers have been dropping marginally since 1979-so the amount of radiative energy-in W/Square meter, have been dropping over that time period. So for there to have been even a small rise in radiation at the earth's surface means that there must have been a change in Earth's albedo (reduced aerosols, reduced cloud cover etc etc.) However, as John pointed out-all these things also contribute to the retention of IR radiation as it heads out to the upper atmosphere. So a reduction in clouds & aerosols should-if I understand it correctly-have little effect on the *net* radiation balance-because they mostly offset each-other. The fact that the amount of IR radiation detected in the stratosphere has dropped-in *spite* of the reduction in heat retaining clouds & aerosols gives even greater credence to the idea that it must be increasing GHG emissions which are trapping the heat in the lower atmosphere. Now, I accept that I could have the total wrong end of the stick, but it makes sense to me. What say you, John?
    0 0
  9. @RSVP You cannot compare the increase in forcing to the increase in GHG's. After all, at equilibrium the effective forcing would be 0, regardless of the concentration of GHG's.
    0 0
  10. Think CO2e, RSVP. CH4 has gone up by 150%, N2O by 15%. CFCs and other purely engineered chemicals did not even exist.
    0 0
  11. Here's my analogy of Monckton's logic: We can think of Monckton's attempt to calculate climate sensitivity from Pinker's 1983-2001 data (http://www.youtube.com/watch?v=og_Bu2zO61g&feature=related) as similar to trying to calculate an automobile's average speed over an entire trip. The problems are that (1) Monckton is estimating the average speed only from the tiny amount of time in which the car actually passes him by (the 1983-2001 period) instead of looking at a longer portion of the trip, and (2) he is forgetting that he too is also in a moving car (not including other opposing radiative effects of clouds and aerosols)! So how much can you say about the average speed of a car from point A to point B by watching it briefly pass you by and forgetting that you are also moving too? Zippity Dooda! Nothing! As Tamino so nicely put it, "if you can't convince them with logic, dazzle them with BS."
    0 0
  12. I did not follow the point. Shouldn't the increase shown in Figure 1 somehow appear in the aerosol lines of Figure 2? Where did I understand it wrong?
    0 0
  13. Now that four people :-) have combined for a thoughough answer to RSVP, let's think about Alexandre's question. Ah, I see part of the answer. Figure 1 shows the combined effect of (apparently mostly aerosol) changes to incoming shortwave at the Surface. Figure 2 shows how each component affects the total (incoming & outgoing, all wavelengths) radiation budget at the Top-of-Atmosphere. So they aren't directly comparable. Nonetheless, Alexandre has a point because I don't see in figure 2 evidence for an actual *decline* in aerosols that would explain figure 1. Anyone?
    0 0
  14. Figure 1 is solar at the surface. The text describes how some of this increased solar at the surface is due to reduced absorbed solar in the atmosphere (soot), and just moving the point of absorption from the atmosphere to the surface doesn't constitute 'global warming'. Also, some of this increased solar at the surface is due to a mechanism (clouds) that also increases the amount of infrared radiation leaving the earth. That is, the same mechanism cools as well as heats. Its the net effect, not merely the surface solar effect, that we should be measuring. Bottom line, just looking at the surface solar absorption is incomplete. Its cherry picking, which is probably why Monckton is doing it. Monckton is asking his listeners to, in effect, calculate the water level in a wooden tub by only considering the rate of water entering the tub, and ignoring the various holes in the tubs bottom.
    0 0
  15. GFW #13 Well, you´re right, Figure 2 encompasses even shortwave reflection from albedo variation. Even so, the aerosol lines show their forcing becoming more intense (and negative) over the period 1983-2001. That´s not what I see in Figure 1, and I´d like to understand the apparent discrepancy. My first thought would be that I´m missing some relevant detail... ubrew12 #14 I´ve enough BS from Lord Monckton and I don´t even bother following the reasoning why he´s wrong. My goal here is to learn and understand John´s point, mainly. You said "moving the point of absorption from the atmosphere to the surface". Isn´t the aerosol effect mainly reflection of SW, instead of absorption of any kind? (as confirmed by the overall negative effect in Figure 2) What else is included in the net effect calculation that is missed by Figure 1? (regarding aerosol effect) And you mentioned "[clouds] also increases the amount of infrared radiation leaving the earth". Isn´t it the opposite? Besides the albedo effect, it prevents some IR moving up the atmosphere?
    0 0
  16. Alexandre, you're quite correct. Just as increased clouds reflect incoming short-wave radiation, they're also good at trapping outgoing long-wave radiation. This is why the net radiative forcing of clouds is actually very low (at least as far as I understand it). This was the basis of Lindzen's Iris Hypothesis-the idea that global warming will lead to a reduction in cloud cover over the tropics, thus allowing more IR radiation to escape to the outer atmosphere-thus acting as a net negative forcing on future climate change. Unfortunately, evidence from CERES showed that, for the tropics at least, that when you accounted for the increase in short-wave radiation getting in, the Iris effect had a very small, net positive impact on warming.
    0 0
  17. Oh, which brings me to another point. What's causing global brightening in this instance? Lindzen rightly pointed out that global warming could lead to a reduction in certain kinds of cloud cover (I've forgotten which kind, can someone help with that?) So isn't it possible that at least some of the global brightening seen in figure 1 is-in fact-the *result* of CO2 induced global warming-not the cause as Monckton claims?
    0 0
  18. Marcus #17 Indeed, there´s this study pointing to that cloud positive feedback. Some of figure 1 could be consequence, and not cause, as you suggest...
    0 0
  19. It's interesting, and completely logical that at some point clouds feature at some point in debates of the various aspects of climate change. Spencer is one researcher who believes that it is here that cause and effect have been confused, and as noted above by Marcus of an opinion that global warming leads to a reduction in certain types of cloud cover, may turn out to be such a case, and instead the opposite, the reversal of cause and effect, the reduction in certain types of cloud cover, in particular boundary layer clouds, may lead to global warming. Lindzen may have been referring to high level clouds. This is one aspect where the layman after digesting the theories and formulas being bandied around, is in a position to judge for himself, in a limited way, if those theories and formulas correlate with what is being exhibited in the physical space he occupies on the surface of the planet. Granted he may not be in a position to quantify it as it applies globally, or extrapolated into the future, but if it does work in his limited space and time, then it cannot be discounted as being wrong in the extended more sosphisicated equations.
    0 0
  20. Actually, I think global brightening *is* currently at work, although not at all in the way that Monckton means. Allow me to explain. Besides the now waning El Nino and the start of solar cycle 24, there is another factor in play this year that no one seems to acknowledge: In the wake of the prolonged global recession industrial aerosols have undoubtedly been reduced globally through normal attrition and reduced replacement emissions, resulting in lower levels of sulfuric acid aerosols. As we know, these aerosols reflect a portion of incoming sunlight back out to space, thus acting as a negative forcing, or cooling, that has been masking part of the existing enhanced greenhouse effect from elevated greenhouse gas concentrations. In other words, the blue Reflective Tropospheric Aerosols trend line in the above chart has risen so that it now offsets less of the green Well-Mixed Greenhouse Gases trend line. Of course, at the same time there is also likely a decline in the Black Carbon warming trend, but it is no where near as large as the Reflective Aerosol forcing. Thoughts?
    0 0
  21. Possible typo. The paragraph beginning: “However, changes in cloud cover and absorbing aerosols also contribute to global brightening. …” would make more sense if was this instead: “However, changes in cloud cover and absorbing aerosols also contribute to global warming. …”
    0 0

You need to be logged in to post a comment. Login via the left margin or if you're new, register here.


The Consensus Project Website

THE ESCALATOR

(free to republish)


© Copyright 2024 John Cook
Home | Translations | About Us | Privacy | Contact Us