Climate Science Glossary

Term Lookup

Enter a term in the search box to find its definition.

Settings

Use the controls in the far right panel to increase or decrease the number of terms automatically displayed (or to completely turn that feature off).

Term Lookup

Settings


All IPCC definitions taken from Climate Change 2007: The Physical Science Basis. Working Group I Contribution to the Fourth Assessment Report of the Intergovernmental Panel on Climate Change, Annex I, Glossary, pp. 941-954. Cambridge University Press.

Home Arguments Software Resources Comments The Consensus Project Translations About Support

Bluesky Facebook LinkedIn Mastodon MeWe

Twitter YouTube RSS Posts RSS Comments Email Subscribe


Climate's changed before
It's the sun
It's not bad
There is no consensus
It's cooling
Models are unreliable
Temp record is unreliable
Animals and plants can adapt
It hasn't warmed since 1998
Antarctica is gaining ice
View All Arguments...


Username
Password
New? Register here
Forgot your password?

Latest Posts

Archives

Global cooling: the new kid on the block

Posted on 4 March 2008 by John Cook

A new argument is hurtling up the Skeptic Leaderboard, leaving old stalwarts like mid-century cooling and water vapor in its wake. The argument is that global warming has reversed and we're now undergoing global cooling. No, it's not the old chestnut global warming stopped in 1998. The new contention is that global warming stopped in January 2007.

The argument originated from Anthony Watts who plotted data from 4 sources (HadCRUT, GISS, RSS and UAH), all of which show sharp cooling of around 0.6°C from January 2007 to January 2008. The most common interpretation around the blogosphere is that the long term global warming trend has reversed. Daily Tech goes so far as to say 2007 "wipes out a century of warming".

hadcrut-jan08
Figure 1: global temperature anomaly from HadCRUT (graph courtesy Anthony Watts).

The flaw in this interpretation is in drawing conclusions about long term climate change over a relatively short period of 13 months. Particularly when a large portion of that cooling occured over one month (January 2008). Only over a period of years to decades can you confidently discern climate trends. Otherwise, you run the danger of mistaking weather for climate.

Nevertheless, several important questions remain - what's causing this sudden cooling and is it the start of a long term trend?

Is the sun driving global cooling?

The general consensus among skeptic blogs is that diminished solar activity is the cause. The sun is currently at solar minimum - cycle 23 just ended and cycle 24 is having trouble kicking along. It's as cool as it gets in the solar cycle.

However, a temperature drop of 0.6°C would require a dramatic reduction in Total Solar Irradiance (TSI). According to theoretical calculations at Atmoz, TSI would need to fall to 1347.65 W/m2 to produce a global cooling of 0.6°C. In other words, 13 W/m2 less than current levels. This is ludicrously large considering the solar cycle varies only around 1.3 W/m2.

Alternatively, Camp 2007 adopts an empirical approach to calculate solar influence on global temperature. He determines the solar cycle contributes 0.18°C cooling to global temperatures as the sun moves from maximum to minimum. Note - this includes any influence due to cosmic rays as TSI closely correlates with the solar magnetic field which modulates cosmic radiation. Employing back of a napkin calculations, TSI would need to fall roughly 4.3 W/m2 to provide 0.6°C of cooling.

Either way, TSI needs to drop considerably to be considered the driver of 2007 cooling. So what has the sun been doing over the last few years?
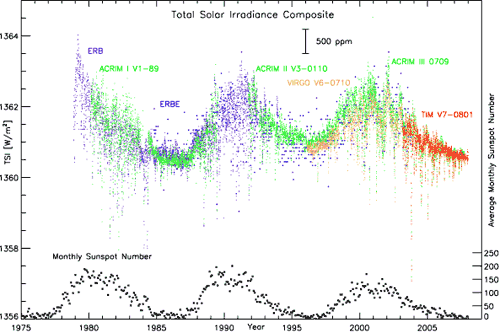

Figure 2: TSI Composite and Sunspot Numbers (graph courtesy Greg Kopp).

Satellite measurements show no dramatic drop in TSI over the past several years. Instead, the solar cycle is following its usual 11 year cycle, flattening out as it reaches solar minimum. So if not the sun, what's causing the cooling?

La Niña - the likely culprit

Currently, the Pacific Ocean is in a La Niña phase. During La Niña, cold waters upwell to cool large areas of the equatorial Pacific Ocean. This has the effect of cooling the atmosphere. During the La Niña episode of 1999, global temperatures dropped around 0.5°C.

The Southern Oscillation Index (SOI) is a measure of La Niña. Positive SOI corresponds to a La Niña phase. In 2006, the Pacific Ocean was in El Niño phase (negative SOI). However, in late 2006, El Niño subsided and in mid 2007, crossed into La Niña phase. La Niña peaked around January 2008 and is the strongest La Niña since 1999. In the Eastern Pacific, sea-surface temperatures are about two degrees colder than normal over an area the size of the United States.
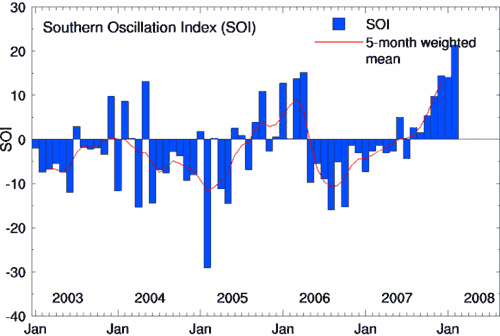

Figure 3: Southern Oscillation Index (graph courtesy bom.giv.au).

Future predictions for global cooling

The UK Met Office predict the cooling effect of La Niña will be slightly greater in 2008 than it was during 2007. According to NOAA’s Climate Prediction Center, the current La Niña episode is expected to start weakening in February 2008. The moral of the story - don't use short term weather patterns to draw conclusions about long term climate trends. My prediction is the current global cooling trend will reverse around mid-2008 when La Niña subsides. That's a bit vague though - feel free to go out on a limb and post a comment with your own prediction of the following months.

Meanwhile, solar cycle 24 is expected to crank up later this year so over the next 5 years, the global warming trend will accelerate as increasing solar activity adds to CO2 warming. So enjoy the cold while it lasts. Personally, I'm strongly considering a skiing holiday.

Update 13 March 2008: NASA GISS have updated the Land Ocean Temperature Index. February 2008 shows a global temperature increase of 0.14°C from January 2008. Not as much as John Cross predicted but more than I expected - I thought La Nina cooling might continue for at least a few more months. Probably a bit early to say La Nina cooling has reversed though - will be interesting to see March's figures.
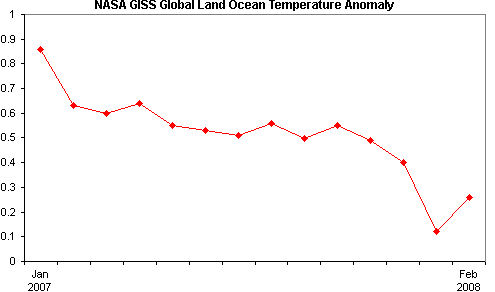
UPDATE 9 April 2008: I've updated the monthly temperature with March's data at La Nina watch: March update (also busied up the graph with Southern Oscillation Index data).

0 0

Printable Version  |  Link to this page

Comments

1  2  Next

Comments 1 to 50 out of 70:

  1. I'm a bit concerned that you miss a very basic thing. First. The effect from the sun controlling the temperature according to the number of sunspots is cooling when many sunspots. That's the effect which for example IPCC AR4 gives a few tenth of a degree cooling when there is many sunspots in the 11 years cycle. This is only the TSI effect, not involving a cosmic ray connection. (This description I guess also quite well fits in to the "reversed" covariance that Locwood/Frohlish noticed, but I think they missed a delay factor.) According to this TSI effect only we shall have a warmer world now, not a cooler. A bigger problem with this post is however that you try to debunk those who believe the sun's controlling climate through the cosmic ray link, but you not even involve that controlling function in your text. You can't debunk the strong cosmic ray and cloud force with another weak TSI effect (which I'm not even sure you're use the right way around). Also the La Nina argument. In a post late 2007, you refused that El Nino didn't forced heat through an increased amount of water vapor in the air, thus increasing the greenhouse. Instead you claimed that this was not at all the case. How can you claim the opposite about La Nina and still think you that will be taken seriously? Of course there are redistribution of heat as well as implications of increase or decrease in water vapor on a global scale in both phenomenon! http://www.skepticalscience.com/ocean-and-global-warming.htm
    0 0
    Response: I'm not denying cosmic ray influence. Cosmic rays are modulated by the solar magnetic field which correlates closely with TSI. Hence its difficult to distinguish between direct TSI warming and indirect cosmic ray influence on cloud cover.

    So Camp 2007 empirically compares the solar cycle to global temperatures. The cosmic radiation cycle is the same as the solar cycle.  He doesn't do any modelling on solar warming or cloud albedo - it's purely a statistical analysis to see whether there's a statistically significant pattern in global temperature that matches the solar cycle. And he finds a strong solar signal in global temperature - 0.18 degrees worth.

    So basically, when Camp calculates the solar influence on global temperature, he includes the whole kit and kaboodle - TSI, UV, cosmic rays - it's all bundled in one big solar package. Note - I've never said cosmic rays don't affect climate but that the cosmic ray trend doesn't correlate with global temperatures.

    Re my post on ocean warming, I wasn't denying the El Nino warming influence. Of course El Nino warms the atmosphere as the spike in 1998 shows. In fact, I say the opposite - that phenomena like El Nino demonstrate how oceans transfer heat into the atmosphere.
  2. I agree that this sudden downward spike in temperature is probably meaningless. I would disagree that Watts claimed anything else, as I read the post when it was originally posted. He does not draw the conclusion you suggest but he does poke fun at the over reaction of the warmers to every bump and wiggle in the record like the 2005 hurricane season. I haven't read Daily Tech but I expect if I go there I will find the same thing. Wasn't the reason for the post by Watts that the GISS record was finally showing what the other 3 main records, like the HadCRUT you show here, had been showing for a year already, a dramatic cooling related to La Nina. I also disagree on your idea that this is seperate from the claim that warming stopped in 1998. It is clearly part of the same argument. The world is cooler than 1998. Quite a bit in fact. This fact is also irrelevent to the entire argument about long term trends and is them making fun of people who pretend 1998 was some dramatic human caused thing. Natural variability is clearly a big factor and the warming signal over a short term is relatively small next to it. Overly dramatic statements on either side are likely wrong and are certainly not science. I am not sure if I understand what the first commentor is saying about the solar effect, but I believe the idea is low sunspots are a proxy for high amounts of cosmic rays reaching the earth. High cosmic ray incidence means more cloudiness and reflective cooling. So the idea is even though TSI change is small temperature effect can be relatively large... like say a degree or so.
    0 0
    Response: You make a good point - 2007 cooling and 1998+ cooling are both arguments cut from the same cloth. Both choose a starting point where global temperatures are temporarily inflated by El Nino, then point to subsequent cooler temperatures as proof that long term climate warming has reversed.
  3. So you disagree with Daily Tech's argument... but you don't disagree with it either. Denialism is about hemming and hawing isn't it...
    0 0
  4. John: You said feel free to post a prediction about February so I will go ahead. I also think that January is an anomaly so, taking into account La Nina, historical records of the relation between Jan and Feb temperatures and a bit of eye of newt I will predict that February will come in at between 35 and 45 on the GISS Land/Ocean. Any other brave climate watchers out there? John
    0 0
    Response: GISS post their monthly global temperature anomalies here so will be checking it regularly to see how your prediction pans out.  :-)
  5. Speaking of heat transfer between the ocean and atmosphere... Any idea of a good place to learn about the debate on the timeline involved? I have seen some claims that it is fairly short others that it is fairly long. The ocean is such a huge heat sink it could hide things for a long time. John, I predict February was cold and March will be cold and April will be cold, and if you lived where I do you would too. Around here if the groundhog predicts 6 more weeks of winter on Feb 2, we celebrate an early spring. We are all somewhat products of our environment. Wasn't the last La Nina a double dip kind of a pattern with a weakening in the middle? If so than either Feb or March could show a recovery followed in a few months by another nasty dip. At the end of which, global averages will be farther down... and it still won't mean temperatures are really falling long term. I think that is the way I'm guessing for 2008. But a guess is all it is, based on the last La Nina.
    0 0
  6. Wondering: I am very familiar with your area since I am a Canadian and for a while lived very near Wiarton Willie. However if you look at other areas of the world you see significant warming (e.g. the Central England). Anyway, my numbers are out there for all to see. Regards, John
    0 0
  7. I believe you John, some areas are warming some areas apparently aren't, why do I always have to be stuck in the aren't warming areas, both here and abroad. I got sick and missed my Antarctica opportunity a few years ago or I'd have another place to complain about. I do wonder how much is regional, how much is land use, and how much is GHG or some natural variation we don't understand yet. That's why I keep questioning and reading. My best Canada story was running my car into a snowbank near Orangeville. I managed to bury my car to the firewall without ever leaving my lane. I would think you would want warming almost as much as I do. Seriously, I guess my prediction is out there too. I think we'll know a lot more one way or another in about 4 years especially if the solar cycle is weak, but the waiting is tough and while I don't believe we'll see significant cooling I do fear it a bit.
    0 0
  8. W.A., I think that 4 years is still a little too short. And really, you don't have to go far to find warmth. Here in the Pacific Northwest we had a tornado in January hardly a mile from my place and february has seen almost a full week of temps in the hi 50's lo 60's with (yes!) sunshine. Funnily enough, earlier we had record daily snowfalls in the Mt Hood area, although the lower elevations did not get as much as last year. No snowman for my daughter this year, but lots of rainy afternoons.
    0 0
  9. See Hansen, Nazarenko, et al, "Earth's Energy Imblance: Confimration and Implications", Science, 2005. http://pubs.giss.nasa.gov/docs/2005/2005_Hansen_etal_1.pdf When incoming energy is larger than outgoing energy, the energy / temperature rises, i.e., First Law of Thermodynamics. Due to increasing Greenhouse gasses like water vapor, CO2, CH4, etc, the temperature of the Earth *as a whole* is rising. So, why do we see such jiggles in the Earth’s surface temperature, which is what NASA GISS, Hadley, etc report? Why doesn’t the energy difference just show up as a smooth rise in temperature? A: most of the energy goes into the oceans, which have 1000X the heat capacity of the atmosphere. The ocean-atmosphere system has all sorts of jiggles that *move heat around*, but do not create or destroy energy. We care about surface temperature because we live here, and we have the longest temperature series, but the surface is a miniscule slice of the whole thing, and surface temperatures in any one place jiggle daily (day and night, far more than any long-term trend), yearly, and from decadal-scale oscillations. Likewise, the surface temperature as whole jiggles, from things like El Ninos that move energy from ocean to atmosphere, and La Ninas that do the reverse. Analogy: A bathtub is being filled [sun], slightly faster than it is being drained [heat radiation]. You have a few floats, measuring the depth of the water. The depth would go up smoothly, except there’s a kid splashing around in the bath. Sometimes the kid lies back in the water, in which case the overall water level goes up [El Nino], but with waves, so that some floats go down. Sometimes the kid sits up, in which case the overall water level temporarily goes down [La Nina], but with waves, so a few of the floats go up. The kid splashes around the whole time, jiggling all floats second by second. At any point in time, there is a certain amount of water, but the average as measured by 1% of the floats is subject to lots of jiggles. Still, the water *is* going up, as long as more as coming in than draining out, and the physics of GHGs say that we’re slowly plugging the drain. The Earth as a whole is gaining energy, and all that some cold spell means is that some oscillation transfers energy from atmosphere/sea surface deeper into the ocean … but that energy doesn’t magically disappear, and the next time it comes back to the surface.
    0 0
  10. Anthony Watts has now posted that Daily Tech got it wrong and that he sent them an immediate note telling them so. Also a good post there by John Cristy on the subject.
    0 0
  11. Watts is a little confused and not nearly as conversant with all this as he would like to suggest. Or he has anterior motives. See this post: http://tamino.wordpress.com/2008/03/02/whats-up-with-that/ IMHO, Watts has got much more attention than he deserves.
    0 0
  12. There's no need to argue inferences at all. This is something very easily testable, if the sun cooperates. Let's hope that the maximum doesn't show up, let's have no sunspots for, say five years. That way, if the sunspots do not come, and, we get past La Nina, and other "weather" effects, and, the earth's temperature continues to drop, then, we need to refine GCMs to account for some as of yet undiscovered mechanism linking solar output to the earth's climate. On the other hand, if the temperature does go up, then, well, obviously, that would argue in favor of existing GCM models, so long as the temperature increases were as predicted.
    0 0
  13. In fact, the more I think about it, the more I'm rooting for a sunspotless ice age. Global warming tells us that we are increasingly the masters of the earth, which is nice and all, but, an ice age just reduces us to utter despairing powerlessness. What better to depress a humanity that so pathologically feels like it needs to matter than to have to shake its fist in futility at the sun as the earth freezes and billions of people go hungry. The best is that, we know the sun is a big ball of hydrogen and helium, and therefor, even praying to it is utterly pointless. May as well stand in front of the tide and try it hold it back with your hand.
    0 0
    Response: Even if the sun didn't show sunspots for the next few years (or decades), the forcing from CO2 overpowers the forcing from a cooling sun. However, I too am hoping for a cooler solar cycle. Another Maunder Minimum would be even better. It will mitigate the CO2 warming at least a little.
  14. Burr. Don't even say that in jest John! You might hope CO2 forcing would overpower a cooling sun but looking at the magnitude of the event in the case on the Maunder, I sure wouldn't bet on it.
    0 0
    Response: It's worth pointing out that the Little Ice Age was a combination both of lower solar activity (the Maunder Minimum) and increased volcanic activity. It wasn't all the sun. In fact, one paper (Robock 1979) goes so far as to suggest volcanic activity is the dominant forcing. That's an old paper though - would be interesting to track down mopre recent research. A good topic for a future post (thanks for the extra homework, WA!)
  15. W.A., John is not hoping, he is quoting Wang (2005), Krivova (2007) and IPCC AR4. There is not so much in all this that's only a matter of opinion or preference, Physics still apply. And if you want to talk about weather, I just had a picnic today by the waterfall, was gorgeous and quite comfortable.
    0 0
  16. Okay, got a bee in my bonnet about the Little Ice Age now (j'accuse, WA). Tracked down another interesting paper Causes of Climate Change Over the Past 1000 Years (Crowley 2000) (requires free registration to Science to view the full paper). He concludes "There is increasing evidence that pulses of volcanism significantly contributed to decadal-scale climate variability in the Little Ice Age". Lots of other interesting goodies in that paper too.
    0 0
  17. Phillipe he said he was hoping! (Response in 13) There is nothing simple about the physics involved here, indeed physics and astronomy are where a lot of very credible disagreement is coming from. It seems the better I understand a specific portion of the issue the less convincing it becomes. Hmm... it said that paper was ppv I'll have to try again. However if vulcanism is the big driver here how about the driver of the ice ages? Unless vulcanism has a 100,000 year cycle I think this is going to be a hard sell. Because now we are talking about two different mechanisms between IA and LIA. Not impossible but ...
    0 0
    Response: Science magazine has free registration - sign up and you get access to certain papers. Not the most recent or really old papers but stuff a few years old are fair game. The 100,000 year ice ages and the Little Ice Age are two completely different phenomena. The 100,000 year ice ages are driven by Milankovitch cycles (and amplified by CO2 feedback) while the Little Ice Age was a short and mild (relatively speaking) cooler period just over the last few centuries. The major driving forces behind the LIA were the sun and increased volcanic activity.
  18. To get back on topic, I recall this from Hadley: http://www.scienceonline.org/cgi/content/abstract/317/5839/796 In my recollection they suggested a short term stabilization or slight cooling until 2009 and more warming afterwards. Who knows? They may be right.
    0 0
  19. Wondering Aloud: Just to echo John Cook's statement on the ice ages. The timing of them seem to match the timing of orbital mechanics very well (as shown in the Milankovitch cycles). The really interesting thing is that there is almost no difference in the amount of energy that the earth receives from the sun during these cycles but how it is distributed is important. Thus there are feedback mechanisms required to explain ice ages. In fact, the idea of a constant sun but different earth processes changing climate seems to be a common theme that I have seen in paleoclimate. Another way to say it is that internal processes of the earth are more variable than solar output. There is speculation that the development of the isthmus of Panama - which took place about 2 million years ago - was the trigger that caused the current cycle of ice ages. I don't know how it fits into the idea of skeptical science, but there may be a very interesting post in there John. On the other hand you may not want my advice right now. The preliminary numbers are looking like February will be about the same as January (temperature anomaly wise). Thus my prediction is looking high! I am game for making a prediction for next month if anyone wishes to join me! John
    0 0
    Response: What, you're giving me more homework?! How about a guest blog post on the isthmus of Panama? :-)
  20. In recent news (the past few months) we have discovered 1} volcanic activity under the melting ice sheets in both Greenland and Antarctica that "may be contributing to their melting". 2) El Nino and La Nina are a part of one cycle driven by vulcanism at the South American subduction zone off the coast of Peru. 3) The atmosphere has had less particulates in the past 100 years due to decreased volcanic ejecta (not reduced vulcanism however). 4) The planetary alignment of 1976, while not having any immediate catastrophic effects, did intensify vulcanism all over the Earth. 5) The sudden increase in temperature slope begins in 1976. Please tell me that this is all coincidental.
    0 0
  21. Philippe Chantreau; Dr. Rhodes Fairbridge had a hypothesis about planetary gravitation controling climate. He had predicted that when solar cycle 24 started we would see a cooling trend to peak in 2012. Since he passed away 2 years ago his hypothesis never saw a lot of attention. I think he may have been onto something, only time will tell.
    0 0
  22. For those unfamiliar with Dr. Fairbridge's work or credentials, his paper is on http://www.crawfordperspectives.com/Fairbridge...
    0 0
    Response: I haven't done a post on Fairbridge's work but the general gist is that the alignment of the planets affects the sun's angular velocity which affects solar output. I'm not sure about the whole planet alignment thing but the question of whether solar output is driving global warming has been thoroughly analysed.
  23. re: LIA And don't forget what William Ruddiman says in "Plows, Plagues, and Petroleum" about temperature dips possibly being contributed to by major pandemics (Chapter 13), i.e., with the causal mechanism being: - humans die - previously-forested farmland goes back to forest, sequestering CO2 That's still a hypothesis, but I have seen at least one paper somewhere that seemed to support it: Abandonment of farmland and vegetation succession following the Eurasian plague pandemic of ad 1347–52. In particular, the later LIA coincided with the biggest die-off in human history, the deaths of native Americans from smallpox, etc. See 2007 conversation. One part I can verify personally: I grew up on a small farm in Pennyslvania farmed for 140 years. I have a drawing from the 1840s that shows a big pasture in front of the barn, and it was there when I grew up. My parents sold the place for development, they built nothing on the pasture, and 15-20 years' later, there was a forest there indistinguishable from that on the next property.
    0 0
  24. Solar cycle 24: 2007-2011 are the "test" years for "The solar inertial motion hypothesis" which predicts that the period from about 2010 to 2040 will be one of relatively severe cold throughout the world. - Richard Mackey, Journal of Coastal Research SI 50 955 - 968 ICS2007 (Proceedings) Australia ISSN 0749.0208
    0 0
  25. OK, just to clue things up - the land / ocean index is finally up and sure enough I am off by about 0.09C . The January figure was 12, I predicted February to be between 35 and 45 and it actually came in at 26! Let the unseemly gloating begin!! John
    0 0
    Response: Thanks for the heads-up, I've grabbed the February data and updated the post.
  26. He he he (evil chuckle) and I am still right... the trick is be less specific. If this keeps up I can have a job at the psychic hotline.
    0 0
  27. Re: "question of whether solar output is driving global warming has been thoroughly analysed" - I did follow the link but saw no new data, only the same IPCC answer. In the paper by Richard Mackey (2007) he states: "The IPCC dismissed any significant link between solar variability and climate on the grounds that changes in irradiance were too small." ... "Short wavelength radiation (UV and Xrays) ionises the upper atmosphere and heats the middle atmosphere. As a result, atmospheric temperature varies in a nonlinear manner with the amount and type of solar radiation. The sun ejects enormous quantities of matter continuously in the form of the solar wind, or periodically as either a mix of high energy protons and electrons (Coronal Mass Ejections, (CMEs)), or as mostly high energy protons (Solar Proton Events (SPEs)). The earth’s atmosphere is more sensitive, and more reactive, to the CMEs and SPEs than to the sun’s short wavelength radiation, to which it is, in any case, highly reactive. The effect of the solar wind, CMEs and SPEs is to reduce the amount of ozone and as a result, warm the middle atmosphere. The overall effect on climate is more turbulence: stronger winds, more storms and greater precipitation." Your blog on solar cycles did not mention this.
    0 0
    Response: The sun's effect on climate isn't insignificant. Camp 2007 looks for a solar signal in global temperatures and finds the solar cycle contributes 0.18 degrees C from solar maximum to minimum (and vica versa). This is a significant effect. And this isn't isolating one particular aspect of solar activity - it's an empirical look at global temperatures for an 11 year signal. In other words, as cosmic radiation, TSI, UV, X-rays all correlate in an 11 year signal, the 0.18 degree effect encompasses all these effects. More on solar cycles...

    But more importantly, the long term, decadal trend of solar activity does not correlate with global temperatures. This applies to Total Solar Irradiance, Cosmic Radiation, UV and X-Rays. However, I haven't looked at data on CMEs and SPEs - I imagine as they correlate with other indices of solar activity, they would show a similar lack of correlation with climate.
  28. Don't get too confident the correlation is still better for TSI than it is for CO2.
    0 0
    Response: Here's a graph demonstrating the correlation between TSI and temperature which speaks for itself:

    The most striking feature is that sun has correlated so closely with temperature over the past 1,500 years and yet just in the last 3 decades has diverged so sharply (Usoskin 2005).
  29. Interestingly this graph you have now used on like 3 different threads does not seem to be at the location you have linked to. (Usoskin 2005) There appear to be a couple of graphs there that rather refute it. Specifically showing huge increases in sunspot numbers during the 20th century. What gives? Did you put the wrong link? Where is this from? Is it proxy data Be10 they mention? If so why would we use proxy data for a time interval where direct measurement is available and cited on other threads? Would you expect there to be no time lag? This graph doesnt support TSI temp link even starting in 1900. It has a dandy cause effect reversal dominating the middle of the graph.
    0 0
    Response: I created the graph myself from TSI data emailed to me from Sami Solanki (co-author of Usoskin 2005). Solanki used a physical model that reconstructs solar total and open magnetic flux using observed sunspot numbers from 1611. The reconstruction is confirmed in comparisons with satellite measurements of TSI as well as several other solar indices observed over the last few decades. The process is documented in Krivova 2007. As far as I know, his is the best TSI reconstruction going around (others such as Judith Lean's and Peter Foukal's have been shown to contain flaws). Re time lag, I've never said there was no time lag - in fact, Usoskin 2005 concludes historically there is a 10 year time lag between decadal TSI trends and temperature, due to ocean thermal inertia. I allude to this at the bottom of the sun page.
  30. That could be important, I've been wondering how people quantify the time lag as I've seen assumptions from 3 years to several hundred years.
    0 0
  31. If there is lag, it does not apear to be consistent. In fact, the period 1915-1930 shows an inverse correlation that does not square very well with the hypothesis of TSI having a major influence. Why are the temps increasing in the 1920's while TSI is decreasing? The 1975 period shows a simultaneous increase, no lag, but soon turns into a total lack of correlation. As remarked before, what is appearent overall is a reverse correlation, i.e. the temp trend changing first and TSI following (up until 1975). I do not see a 10 years lag clearly emerging either. Even if you imagine a 30-35 years lag, to explain the 1975 upward trending temp by the 1940's TSI peak, then you're out of an explanation for the 1940 temp spike. All in all, the TSI to temp idea is a really difficult case to make with this data.
    0 0
  32. Well I don't know what this graph is really saying, it sure doesn't seem to fit anything I can find elsewhere. Perhaps this link woulod be a nice contrast. http://icecap.us/images/uploads/Solar_Changes_and_the_Climate.pdf
    0 0
    Response: I'm not sure when that icecap article was written. At best, it's quite old and the data they use is outdated. At worst, it was written recently and they're being intentionally misleading by using outdated, defunct data. They use a graph for TSI from a 1997 book by Hoyt Schatten. I'm not sure where the book gets their data from but it contradicts sunspot numbers and satellite measurements. At a guess, it looks reminiscent of Foukal's TSI reconstruction which made errors when merging different sunspot records.

    Even worse is their use of Lassen's 1991 solar cycle length graph. In 1999, Lassen updated his data concluding "since around 1990 the type of Solar forcing that is described by the solar cycle length model no longer dominates the long-term variation of the Northern hemisphere land air temperature". The 1991 data is erroneous and to use it when even the author has debunked his earlier work is misleading or at best, ignorant.
  33. Solanki works the Max Planck Institute and I find him, a priori, very trustworthy; so I would definitely trust info obtained directly from him. He is a very respected authority on the Sun. His reconstruction used to be popular with skeptics, until they figured it did not really support that much of a case for them. The Hoyt and Schatten's data used by icecap was part of the topic of a thread at Tamino's, in which Joe D'Aleo did not have much to say that was convincing. Dr. Svalgaard mentioned there that the authors themselves have acknowledged the weakness of their reconstruction, which is not used anymore since much better ones have been done (including Solanki's). http://tamino.wordpress.com/2008/02/03/exclamation-points/#comments The dubious mathematical methods used by D'Aleo in the paper that is the subject of the thread are very nicely dissected by Tamino and provide an interesting insight into the reliability of Icecap, in which I believe D'Aleo to be a major contributor.
    0 0
  34. You might want to read this article: "Earth’s Orbit Creates More Than A Leap Year: Orbital Behaviors Also Drive Climate Changes, Ice Ages" ScienceDaily (Feb. 18, 2008) The Earth’s orbital behaviors are responsible for more than just presenting us with a leap year every four years. According to Michael E. Wysession, Ph.D., associate professor of earth and planetary sciences in Arts & Sciences at Washington University in St. Louis, parameters such as planetary gravitational attractions, the Earth’s elliptical orbit around the sun and the degree of tilt of our planet’s axis with respect to its path around the sun, have implications for climate change and the advent of ice ages.
    0 0
  35. Re: "La Nina" see my comments to "Solar activity & climate: is the sun causing global warming?"
    0 0
  36. WHAT? Are you aware that your own citation linked Krivova 2007 clearly disagrees with your entire premise of some big drop in solar activity in 1975 and since! So Icecap is debunked? Maybe,I haven't checked that out. It does appear that your own reference completely destroys the graph and claim you made in your response in 28. Either Krivova is totally wrong or this graph is. Krivova does not show declines in either magnetic activity or the less important TSI that started somehow in 1975 or apparetnly at all.
    0 0
    Response: I've never said there's been a big drop in solar activity since 1975. To clarify, there's been a breakdown in the correlation between sun and climate since 1975. While climate has shown decadal warming, the sun has shown very little long term trend. There's either a slight warming trend or slight cooling trend depending on which TSI composite you adopt. Incidentally, the data I use is Krivova's TSI reconstruction - she co-wrote that paper with Sami Solanki who emailed me the data in late 2007.
  37. Looking at Usoskin and at Krivova it still looks to me like your graph is wrong. Certainly from 1985 to 2000 where you have a big dip that is not reflected in either place.
    0 0
  38. So why should I believe this as opposed to... http://en.wikipedia.org/wiki/Solar_variation
    0 0
    Response: WA, you're like my own private Steve McIntyre. So I decided to download the PMOD satellite data and compare it to Solanki/Krivova's TSI reconstruction (monthly values). Here's the result:


    It's a pretty good match (which isn't surprising, Krivova 2007 does make a point of checking their reconstruction against the satellite data). Last year, I did ask Solanki if he could upload their TSI data to his website (so I could provide a link to it). He said he'd run the idea by Krivova but I'm guessing they never got around to it. I'd be happy to email you the Solanki data if you're interested.
  39. Yeah thats what Im looking at, now it's TSI and not one of the likely important parameters but this shows that your 1985 drop off isn't there. (red line from graph in 28) Which is what I've been complaining about all along. This could suggest warming throughout the last century was solar related. dram a trend line on this graph and you'll see it. Add a reasonable time lag and you could have the sun inducing warming out to about 2030 based on this data alone. Now just to be naughty I'll admit I think this is a coincidence
    0 0
  40. The PMOD reconstruction above is different from the Max Planck data WA refers to because the Max Planck data is the 11 year average computed yearly. I don't think you can directly compare these 2 graphs, especially because the 11 year cycle is not always exactly 11 years. Furthermore, the 11 year average graph does not show a drop in 1985, the decrease is late 80's early 90's.
    0 0
  41. Yeah, Phillippe I noticed that and it certainly is part of the issue. The technique used in the Max Planck graph appears to show a drop in irradience when the raw data doesn't have one. The 11 year averaging is creating at least part of the disconnect in the timing. Just for fun assume the timelag for a solar affect on the Earth is about 35-40 years, probably not true but you see the result would fit interestingly. It also seems to fit somewhat with the PDO.
    0 0
    Response: There is a time lag between the sun and climate but historically, it's been about 10 years. Eg - Usoskin 2005 compared 1150 years worth of TSI and temperature and found the correlation was highest when temperature lagged TSI changes by 10 years.
  42. Wondering Aloud I believe that the half cycle average is 11.1 and full cycle average is 22.3, but I can't remember where I read that.
    0 0
  43. "Just for fun assume the timelag for a solar affect on the Earth is about 35-40 years, probably not true but you see the result would fit interestingly" Disagreed, as I pointed in post #31.
    0 0
  44. I dont think you understood me Phillippe I wasn't saying it was true but looking at the TSI graph, not this goofy one here with the 11 year averages etc I am asking if the increase in the TSI from the first half of the century could be part of the cause of late century warming.
    0 0
  45. The dip your talking about around 1920 (in post 31)would than be part of the cause of the mid century cooling.
    0 0
  46. This "goofy" data happens to be compiled by Dr. Solanki. Since you're calling it goofy, perhaps you'd care to explain exactly what makes it so. You having difficulty to use it is not necessarily enough. I find it more plesant to look at than the graph in 38 with all the noise, and it's done with the same data, what's not to like? "The dip your talking about around 1920 (in post 31)would than be part of the cause of the mid century cooling." But then you would have no temp response to the increase of the 1890's. And the 1965 dip does not have a response either. No matter how you cut and slice it, it's hard to fit, to the point of being impossible. Especially when considering how small these variations actually are when you translate them in terms of energy received per square meter and what's reflected by albedo (roughly divide by 4, the multiply by 0.49). Sorry, but I don't find it convincing at all. Imagine you're applying your skeptical outlook to that hypothesis. How well is it truly defended? Being a real skeptic means you're equally skeptic of all hypotheses and HOLD THEM ALL TO THE SAME STANDARD OF SCUTINY (that which you're aplying to CO2). You can't cut slacks to the solar idea just because it's not CO2. I find that true skeptic attitutde profoundly lacking with all skeptics but very few (counted on one hand's fingers) whose writings I have read on blogs. Ironically, those show much greater intellectual integrity than "skeptic scientists" like Baliunas, Pielke Sr. and others.
    0 0
  47. Actually I think the graph in 28 was done by John Cook. It is a derived graph of a "corrected" value rather than a raw data graph and as a result tends to magnify trends, if any, near the end of the time line. It is very easy in that case to get suckered into seeing trends even if they aren't there. I don't have any idea what the time lag for any of this stuff is. I am trying to suggest that the instant response idea is wrong and unlikely because of the heat capacity of the system. There are a lot more than one or two interactiong variables here and how much of a factor the ocean plays and how long it takes to respond to a change are big factors. For example the 1890s increase could play a roll in the 1930s being warming. The correlation isn't that great. It just happens to be a bit better than CO2 temp one or the TSI temp one. I am just playing with the numbers, it seems obvious to me that simple answers to complicated questions are usually wrong. Which is why current cooling does not disprove AGW, however the warming of the late 20th century doesn't prove it either. Being a skeptic is usually what science is all about. Just because I posed another unllikely hypothesis doesn't meen I suddenly believe it's right. The way science works is the correct hypothesis has to take on and defeat all competing hypothesis. If it ever fails it's done. What you may not see is that people cut the CO2-warming idea a lot of slack, as you say, while holding all other ideas to tight scrutiny. Perhaps you are also dealing with people who have been around for the last 50 or more years and have been bitten by the distortion, dishonesty and alarmism that has been characteristic of every big environmental crusade I can think of. This has in the past led to policy that is in fact harmful to the environment. If you want a dandy example take a look at the story of DDT. Every thing used to replace it was more environmentally harmful more expensive less effective. Here we are 35 years since the ban, National Geographic still telling us it was killing the eagles, all long ago disproven and millions still paying for the lie with their lives. Or would you like to think about acid rain, logging, the new ice age, nuclear power dangers, alar, asbestos or how about compact florescent bulbs ?... the list goes on and on. Here is my question on this rant, how many times does it take for the same people to lie to you before being a skeptic becomes your knee jerk reaction? Maybe you should cut the skeptics a little slack, they are doing their job. The fact that anyone is even willing to listen to claims of global warming, or any impending environmental disaster, is a miracle. We better not be wrong this time, especially not for inciting another overblown panic, or we may never regain the influence to get anyone to believe us if we have a real warning.
    0 0
  48. Your take on DDT comes from propaganda. The manufacturers of DDT ruined themselves. They pushed public health managers for insane amounts of the product to be used so that they would sell more of it. As a result, insane amounts of the stuff accumulated in the environment and affected numerous species. This last point is not to be argued, it has been well documented in multiple studies. N.G is not telling lies about this. You'd die too, if exposed to the appropriate dose of the chemical. This would never have happened if the greedy idiots doing a business of selling DDT had not tried to make more money out of it than what the real need called for. When the backlash happened, they tried to get back to reason by showing that, at the proper doses, the product was safe. It's too bad they could not bring themselves to sell only what was necessary for proper dosage in the first place. Before regurgitating propaganda, why don't you look at how much DDT was used per square meter of beach for instance, vs. what was necessary to achieve the desired result. DDT did kill birds because it ended up in the doses needed to kill birds' eggs, instead of the much lower doses needed to kill mosquito eggs and larvae. Of course, once something is legislated, it's hard to track back. The DDT backlash was not created by environmentalists but by businessmen. Since we're talking about lies, why don't we examine the lies of the lead industry about the neurological effects of lead containing paints on children. Or we could also examine the lies of the tobacco industry. There are plenty of lies to go around, really. Acid rain is real, I've seen the effects of it. Take a trip to China, yuo'll see plenty for yourself. While you're there, reflect on how you would like to live in such a place. The new ice age is media created bunk. Asbestos does cause lung disease, I have not met a pulmonologist who'd deny that. It's easy to see where your list comes from. For each and any of those items, how closely have you looked at the "alternate" side of the story that you were presented? "Being a skeptic is usually what science is all about." This claim is often heard, along with the suggestion that all the climate scientists doing research full time are not exercising the proper amount of skepticism. What's funny is that most of the time, that half veiled accusation comes from people who are not scientists and would be hard pressed to distinguish between what warrants great skepticism and what's more likely to be truly interesting. Quietman's recent interest in the miserable Gerlich "paper" is a case in point. I'm not going to cut skeptics any slack if they are not aware of the all story and rely on sources that are worthless. GRL is a good source. Energy and Environment is not. Heartland is a miserable source. NOAA and NASA are good ones. There are objective criteria for this. If you decide to ignore them, your skepticism is nothing more than well dressed bias. Skepticism cuts both ways. How much skepticism did you direct toward the version of the DDT story that you were told?
    0 0
  49. Version? Go ahead and find research that shows that DDT harmed Raptor birds. I can save you time it doesn't exist. Audobon and hawk mountain bird counts clearly showed increased populations at the height of DDT use. Something I experienced first hand. The bird egg thing had already been disproven 30 years ago. Tests with real birds at even wildlly elevated levels ranged from inconclusive to downright favorable. Long term persistence in the environment was exaggerated. In fact the test they were using to detect it at the time required that it break down readily in the environment. I went to a professional conference 25 years ago where this precise issue was used as an example of bad scientific ethics. Not to be argued? You are aware of the huge residue levels of DDT found in elephants? Yes Siberian elephants found in permafrost and the resulting discovery that the supposed marker for DDT building up in living tissue was in fact not a marker for DDT at all. Then you hit me with that old saw about the manufacturers wanting to sell too much when in fact since it was long out of patent and they made the patented replacements they were quiet supporters of the ban. It was used foolishly and broadly and had an effect of messing up local food chains from misuse; but you'll have a tough time finding a replacement that wasn't worse on every particular. Or perhaps a quote from Ruckelshaus at the time of the ban "We admit there is no scientific evidence to support the ban of DDT never the less we are banning it." Sorry, I tried very hard my first year in grad school environmental chemistry to try to prove the DDT issue wasn't a politically motivated fraud, I failed completely. It is the only project in hundreds of grad hours I never managed to complete, and the professors involved admitted at the end that they couldn't do it either. It is probably why I switched to surface chemistry and later into physics. The one "Real" and "not to be argued" thing in the DDT issue is the bodies of the innocent children who have died as a result of the ban. On acid rain, being "real" doesn't make it a crisis, which I suspect you well know. As in Canada blaming emissions from Sudbury on Gary Indiana. The perpose of that scare was to reduce fossil fuel use. When it faded in the mid to late 1980s it was replaced by another scare. As I recall the lead paint thing was basically "they'd have to actually eat the paint for it to be a problem." Which is exactly the issue. Which part of NASA is such a good source? or NOAA for that matter as there are public figures on both extremes in both agencies. Several of AGW's best known skeptics are NASA scientists or retired NASA scientists.
    0 0
  50. On asbestos... amphibole or crysotile? Most asbestos actually used in buildings was made much more dangerous by the process of removing it. We wound up with a panic that caused far more problems with the fix than was present unfixed. Sorry for my immoderate tone there phillippe it isn't your fault. But when ones youthful idealism is squashed he tends to remember it. Especially when the entire chemistry department in a major university system considers the issue an open joke.
    0 0

1  2  Next

You need to be logged in to post a comment. Login via the left margin or if you're new, register here.


The Consensus Project Website

THE ESCALATOR

(free to republish)


© Copyright 2024 John Cook
Home | Translations | About Us | Privacy | Contact Us