Greenland ice loss continues to accelerate
Posted on 11 October 2011 by John Cook
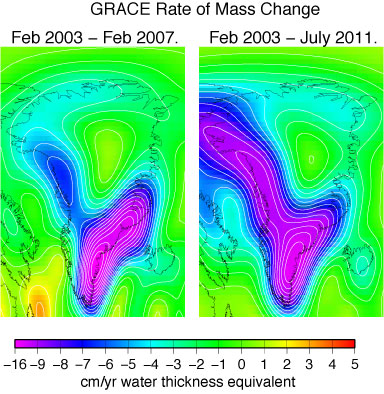
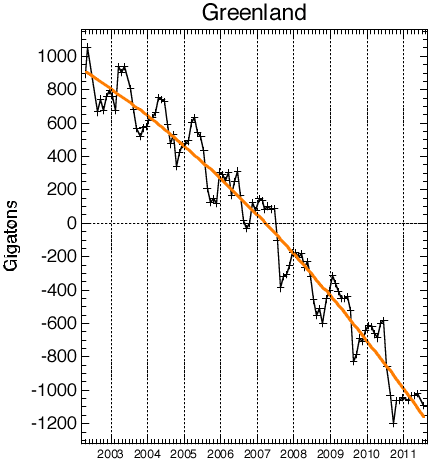
The latest measurements continue to measure accelerating mass loss from the Greenland ice sheet. The latest data from the GRACE satellites (noting that it doesn’t include the full 2011 summer season, ending in July 2011) shows that Greenland mass loss has been steadily increasing since satellites began measurements in 2002. The mass loss started spreading up the northwest margin a few years ago.

Figure 1: rate of mass change from Greenland over 2003-2007 and 2003-2011 periods.
The average mass loss from Greenland over 2002 to 2011 is 225 billion tonnes per year. This rate of mass loss has been increasing over the last decade. There was also an unusually large amount of mass loss during the 2010 summer due to extensive melting of snow and ice.

Figure 2: Greenland ice mass anomaly - deviation from the average ice mass over the 2002 to 2011 period. NOTE: this doesn't mean the ice sheet was gaining ice before 2006 but that ice mass was above the 2002 to 2010 average.
Many thanks to John Wahr for sharing the images and Tenney Naumer from Climate Change: The Next Generation for passing it onto SkS.


 Arguments


[DB] See Tom's response to you below.
[DB] Fixed image.
[DB] I would suggest reading the full paper, not just the abstract. Sundal et al 2011 is fully consistent with other work in the area (as the authors note), including Schoof et al 2010, for example. This is essentially stating that an enhanced Zwally Effect will not be the primary driver for the expected mass loss of the 21st Century (which Sundal et al note is still expected).
It is through an enhanced Jakobshavn Effect (calving at the marine-terminating glacial fronts) that the mass-loss is expected to occur.
See Greenland Ice Sheet outlet glaciers ice loss: an overview and
Zebras? In Greenland? Really? for more background.
[DB] "The ice loss of the ice cap is accelerating, we are being told every year."
You refer to the ongoing loss of the Arctic Sea Ice cap, which is indeed ongoing, but floating (and thus adds nothing to the sea level budget).
The GIS is indeed losing mass, in a greater-than-linear fashion. The ongoing SLR is indeed ongoing, when measured at periods long enough to be considered staitically significant. See one of the many threads here on that subject.
[DB] "Hasn't anyone looked at sea level rise for the last 3 years? It is not happening."
Adrian, 3 years is far, far too short of a period in time to be meaningful. On such a short scale of time the noise in the data series drowns out the underlying signal. Typically about 17 years of data is the minimum needed to deduce even a linear trend.
[Source]
For further reading, I suggest Tamino's excellent piece on sea level trends, So What?
"This is not cherry picking folks"
Yes, I'm afraid it is. Unless you're looking at a long enough record, say the whole record, your short period has no meaning:
[Church & White, 2011]
Yup, still happening...