Greenland rising faster as ice loss accelerates
Posted on 24 May 2010 by John Cook
We have several independent lines of evidence that Greenland is losing ice at an accelerating rate. Satellite altimetry find glaciers are sliding faster downhill and dumping more ice into the ocean. Altimetry data also find the ice sheet is thinning. An overall picture is obtained by satellites measuring the gravity around the ice sheet. Another line of evidence has now been added to this picture with GPS measurements finding that Greenland is losing ice so quickly, the land is now rising up at an accelerating rate.
These results are published in Accelerating uplift in the North Atlantic region as an indicator of ice loss (Jiang 2010). The study looks at high-precision global positioning system (GPS) data that measure the vertical motion of the rocky margins around Greenland, Iceland and Svalbard. The weight of ice sheets push down on the bedrock it rests on. As the ice sheets lose mass, the bedrock rises. This process, known as Glacial Isostatic Adjustment (GIA), has been happening since the planet came out of an ice age around 17,000 years ago. How do we know whether current uplift might be a delayed response to glacial retreats from thousands of years ago? To avoid the effect of past events, this study focuses on vertical acceleration rather than velocities. The results are therefore insensitive to GIA-related motions from past ice mass changes.
What they find is crustal uplift in Greenland, Iceland and Svalbard is accelerating. Extrapolating the acceleration backwards in time finds the acceleration began after 1990. The acceleration of uplift over the past decade represents an essentially instantaneous, elastic response to recent accelerated melting of ice throughout the North Atlantic region.

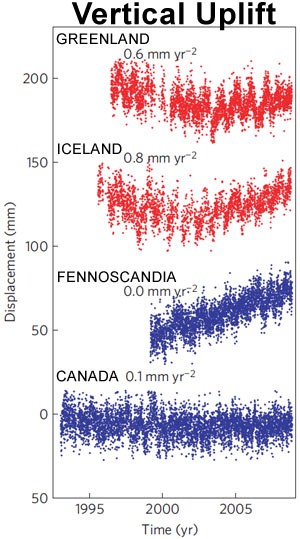
Figure 1: GPS measurements for the North Atlantic region. The numbers (eg - 0.6 mm/yr2) show the amount of acceleration. The red (upper) time series (Greenland, Iceland) show positive acceleration and the blue (lower) time series (Fennoscandia, Canada) show no significant acceleration.
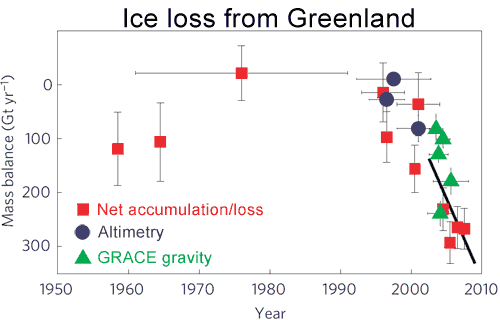
From the rates of uplift around Greenland, they estimate ice loss is accelerating at 21.2 gigatonnes/yr2. This agrees well with other estimates of ice loss accelerating at around 21 gigatonnes/yr2. The following shows estimates of the rate of Greenland ice loss measured from satellite altimetry, GRACE gravity data and net accumulation/loss measurements.

Figure 2: Rate of ice loss from Greenland. Vertical lines indicate uncertainty, horizontal lines indicate averaging time. Blue circles are from altimetry, red squares are from net accumulation/loss and green triangles are from GRACE. The black line is a straight-line (constant acceleration) fit through the mass balance data for the period 1996–2008 with a slope of 21 gigatonnes/yr2.
So combining altimetry, net accumulation/loss, GRACE gravity data and GPS measurements, we find multiple lines of evidence converging on a single answer: Greenland is losing ice mass at an accelerating rate. If this acceleration continues, Greenland could soon become the largest contributor to global sea level rise
Lastly, one interesting point. The amount of uplift in Greenland varies from location to location, from 1.4 mm per year in northwest Greenland to over 10 mm per year in other places. In some locations, this exceeds the current rate of global sea level rise which is around 3.2 mm per year. Greenland's uplift rate is predicted to double by 2025. Sadly, this doesn't mean we can now relax about sea level rise - unless you have a huge melting ice sheet in your neighbourhood, you're unlikely to see uplift rates like those seen in Greenland.


 Arguments


Re Figure 1, I confess I did have to stare at it for a while before the truth emerged. Take Iceland for example. What the graph shows is essentially the height of the base (or more technically precise, the anomaly of the height). At the beginning of the measurement period, Iceland is subsiding. But this subsiding is slowing down, stopping, then rising. The acceleration rate is fairly constant through this whole period.
The car stops rolling downhill. If you keep pushing, the car will then start to roll up the hill. If you push at the same rate, the car will then accelerate at a rate of 1 metre per second per second. So the car's "acceleration" is constant over the whole time - it's always going in the same direction (uphill).
Not sure if I'm explaining this right - someone else want to have a go?
The evidence that Greenland is highly sensitive to sustained warmer temperatures comes from the past. In the last interglacial, around 125,000 years ago, sea levels were at least 6 metres higher than current with global temperatures around 1 to 2 degrees warmer. Ice melt from Greenland and Antarctica were the main contributors to this sea level rise.
The past can tell us a lot about our future.