Can you make a hockey stick without tree rings?
Posted on 2 December 2009 by John Cook
When "Climategate" first broke, I noted the skeptic preoccupation with one tiny piece of climate science while neglecting the full weight of direct observations of current global warming. That tiny piece is paleoclimatology: the reconstruction of past temperature. However, upon reflection, I may have oversold the skeptic position. The focus is on one particular method of that tiny piece: tree ring proxies. In the field of paleoclimatology, there are a variety of independent methods to determine past temperature changes: tree rings, ice cores, lake sediments, boreholes, stalagmites, etc. What do these independent methods find?
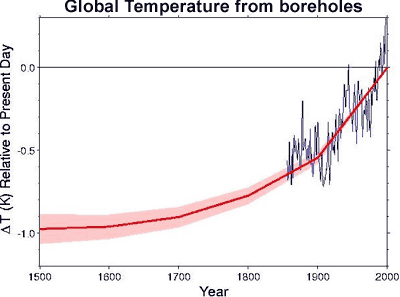
Surface temperature changes send thermal waves underground, cooling or warming the subterranean rock. Boreholes can be used to measure these changes. In Huang 2000, underground temperature measurements were examined from over 350 bore holes in North America, Europe, Southern Africa and Australia. Borehole reconstructions aren't able to give annual or even decadal variation, yielding only century-scale trends. What they find is that the 20th century is the warmest of the past five centuries. This provides independent confirmation that the Earth is warming dramatically (the blue line is the instrumental record).

Figure 1: Global surface temperature change over the last five centuries from boreholes (thick red line). Shading represents uncertainty. Blue line is a five year running average of HadCRUT global surface air temperature (Huang 2000).
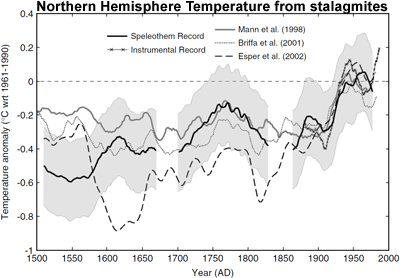
Stalagmites (or speleothems) are formed from groundwater within underground caverns. As they're annually banded, the thickness of the layers are used as climate proxies. Figure 2 shows a Northern Hemisphere temperature reconstruction from stalagmites. While the uncertainty band (grey area) is significant, the temperature in the latter 20th Century exceeds the maximum estimate over the past 500 years.

Figure 2: Northern Hemisphere annual temperature reconstruction from speleothem reconstructions shown with 2 standard error (shaded area) (Smith 2006).
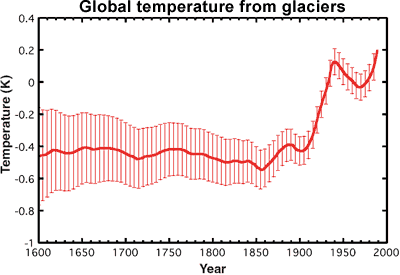
Oerlemans 2005 used historical records of glacier length as a proxy for temperature. As the number of monitored glaciers diminishes in the past, the uncertainty grows accordingly. Nevertheless, temperatures in recent decades exceed the uncertainty range over the past 400 years.

Figure 3: Global mean temperature calculated form glaciers. The red vertical lines indicate uncertainty.
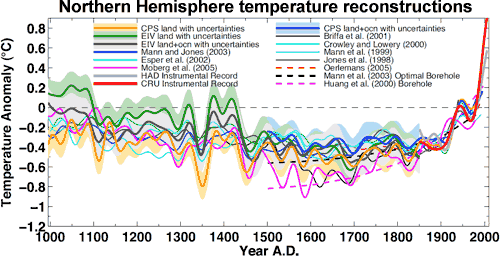
Of course, these examples only go back as far as 500 years - this doesn't even cover the Medieval Warm Period. When you combine all the various proxies, including ice cores, coral, lake sediments, glaciers, boreholes & stalagmites, it's possible to reconstruct Northern Hemisphere temperatures without tree-ring proxies going back 1,300 years (Mann 2008). The result is that temperatures in recent decades exceed the maximum proxy estimate (including uncertainty) for the past 1,300 years. When you include tree-ring data, you find the same result for the past 1,700 years.

Figure 4: Composite Northern Hemisphere land and land plus ocean temperature reconstructions and estimated 95% confidence intervals. Shown for comparison are published Northern Hemisphere reconstructions (Mann 2008).
Paleoclimatology draws upon a range of proxies and methodologies to calculate past temperatures. This allows independent confirmation of the basic hockey stick result: that the past few decades are the hottest in the past 1,300 years.


 Arguments


I do recommend if you do post links to Skeptical Science that you take the time to read the page you're linking to and describe the page you're linking to in your own words. One of my pet peeves is comments that merely post a link without any explanation - a lazy way to discuss climate science. You show more respect for the people you're discussing with and provide more useful, enlightening discussion if you can at least give a brief description of the science you're linking to.
Figure 4: The long-term cooling trend in the Arctic was reversed during recent decades. The blue line shows the estimated Arctic average summer temperature over the last 2000 years, based on proxy records from lake sediments, ice cores, and tree rings. The shaded area represents variability among the 23 sites use for the reconstruction. The green line shows the long-term cooling trend. The red line shows the recent warming based on instrumental temperatures (Kaufman 2009).
Re "abandon the LIA", there seems to be a common notion kicking around that climate scientists are trying to talk down past climate change. This is decidedly not the case. On the contrary, as Dana Royer puts it: "the geologic record contains a treasure trove of 'alternative Earths' that allow scientists to study how the various components of the Earth system respond to a range of climatic forcings." For this reason, periods of dramatic climate change like coming out of the Last Glacial Maximum are of strong interest to climate scientists. These periods indicate that the climate is sensitive to radiative forcing which in turn tells us that the climate is sensitive to the current very strong radiative forcing from CO2.
This is because proxy records tell us what temperature has been in the past, not what's causing the temperature changes. But as you say, attribution is indeed the central issue of global warming - I would go so far as to say the hockey stick controversy serves as a distraction from the more crucial observations that rising CO2 levels are causing an enhanced greenhouse effect which is the main contributor to global warming.
The issue of relaxation time is also an important point that is rarely discussed. In an earlier post, we examined the whole concept of climate time lag and "warming in the pipeline".
There is also a detailed examination of the argument that CO2 has been higher in the past.