How Jo Nova doesn't get past climate change
Posted on 23 June 2010 by David Grocott
Guest post by David Grocott
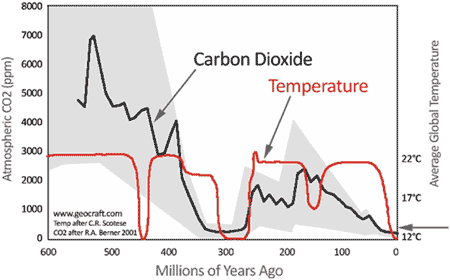
In the ‘Skeptic’s Handbook II’ Jo Nova argues that because carbon dioxide levels have been higher in the past, and because this hasn’t necessarily correlated with higher temperatures, the ‘greenhouse effect’ theory is flawed. She says “Carbon levels have risen and fallen 2000 ppm and the temperature doesn’t care less… Indeed the Earth slipped into an ice age while CO2 was far higher than today’s levels”.

Figure 1: Jo Nova’s graph showing atmospheric CO2 and global temperatures through the Phanerozoic. The graph has been adapted from the original here, which in turn draws upon the Geocarb III model for it’s presentation of atmospheric CO2, and the ‘PALEOMAP Project’ for its temperature reconstruction (Skeptics Handbook II).
In order to understand the apparent disparity between past temperature and levels of atmospheric CO2 we must appreciate that CO2 is not the only driver of climate. Other drivers of past climate change include variations in solar output, continental drift, orbital variations (known as Milankovitch cycles), volcanism, and ocean variability. Any conclusions that we draw from a perceived lack of correlation in the climate record between atmospheric CO2 and global temperatures must take into account these factors.
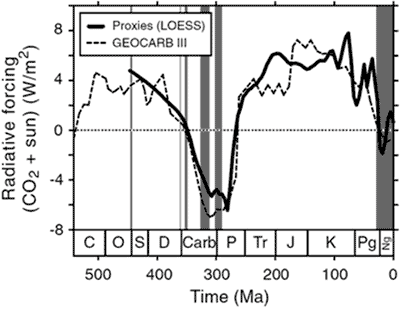
Looking at Jo Nova’s graph (Figure 1), we can see that the further back we go, the higher CO2 levels rise. However, as we go back in time solar activity also falls and in the early Phanerozoic the solar constant was about 4% less than current levels. Royer (2006) combined the radiative forcing from CO2 and solar variations to find their net effect on climate. The result is shown in Figure 2 (cooler climate is indicated by shaded areas which are periods of geographically widespread ice).

Figure 2: Combined radiative forcing from CO2 and sun through the Phanerozoic. Values are expressed relative to pre-industrial conditions (CO2 = 280 ppm; solar luminosity = 342 W/m2); a reference line of zero is given for clarity. The dark shaded bands correspond to periods with strong evidence for geographically widespread ice (Royer 2006).
As we can see from the graph, Royer found that when solar variations are taken into account, the “total radiative forcing” correlates excellently with past temperature reconstructions. In layman’s terms, this means that when the sun is less active, the CO2 level required to initiate a glaciation is much higher. For example, if the CO2-ice threshold for present-day Earth is 500 ppm, the equivalent threshold during the Late Ordovician (450 million years ago) would be 3000 ppm, making it perfectly possible to have widespread glaciation accompanied by comparatively high levels of atmospheric CO2. This understanding of the correlation between past levels of atmospheric CO2 and global temperature is widely accepted and led the author of the paper which accompanies Jo Nova’s model of past CO2 to conclude: “over the long term there is indeed a correlation between CO2 and paleotemperature, as manifested by the atmospheric greenhouse effect”.
According to Royer’s graph however, the Late Ordovician provides an awkward anomaly. Eagle-eyed readers will have noticed that there is a brief glacial period at the end of the Ordovician period (approx. 450 million years ago) which coincides with a relatively high net radiative forcing. Given that solar output at the time was around 4% lower than current levels, CO2 would need to fall to 3000 ppm to permit glacial conditions. According to the model Nova’s graph relies upon CO2 levels at the time were nearer to 5000 ppm (although it should be noted that the 3000 ppm mark lies well within the model’s ‘estimate of errors’ - the large, unlabelled, shaded area on Nova’s graph). A recent paper by Young (2009) has added weight to the argument that the model over-estimates the level of CO2 present in the atmosphere during the Late Ordovician glaciation. Young’s study of strontium isotopes suggests that large scale volcanic activity prior to the Late Ordovician glaciation drove up atmospheric CO2 levels, triggering an increase in the rate of chemical weathering – the process whereby CO2-laced acid rain reacts with carbonate rocks, locking away large quantities of atmospheric CO2. This weathering then continued after the volcanic activity subsided, thinning atmospheric CO2 to levels consistent with the expected radiative forcing necessary to match the temperature reconstruction for the period.
While it’s all very well appreciating that it is perfectly possible for high levels of CO2 to accompany relatively low global temperatures (and equally for low levels of CO2 to accompany relatively high global temperatures), skeptics might well say: “I thought CO2 was supposed to be a climate feedback? Shouldn’t CO2 levels have been mirroring global temperatures?”
The answer is that, in the same way that CO2 is not the only natural driver of climate, climate is not the only natural driver of CO2. We know that changing ocean temperatures alter the ability of the oceans to absorb CO2, thus creating a feeback effect, but, as Young’s work attests, both volcanic activity and chemical weathering can act as CO2 level forcings, entirely independent of climate. In addition, natural changes in plant and animal life have a measurable impact on levels of atmospheric CO2 and Crowley and Berner (2001) suggest that changes in ocean circulation may also play a part in CO2 variability.
Due to these various forcings, levels of atmospheric CO2 and global temperature have not always happily correlated, however, contrary to Jo Nova’s claims, high levels of CO2 have in the past been responsible for a dramatic rise in global temperatures. The K-T boundary event is an excellent example of one such occasion.
The K-T boundary is a thin layer of rocks which documents the impact of a huge meteorite 65 million years ago (the same one that supposedly wiped out the dinosaurs). When the meteorite struck, it released vast amounts of CO2 from vaporising carbonate-rich rocks, leading to a massive increase in atmospheric CO2. According to Beerling et al (2002) the impact pushed atmospheric CO2 levels up from 350-500 ppm to approx 2,300 ppm, which would have been sufficient to warm the Earth’s surface by »7.5°C in the absence of counter forcing by sulfate aerosols.
This sudden jump in atmospheric CO2 is only partially represented by the model upon which Nova’s graph relies. The paper accompanying the model (Berner and Kothavala 2001) explains that “This type of modelling is incapable of delimiting shorter term CO2 fluctuations because of the nature of the input data which is added to the model as 10 million year or longer averages”. In other words the brief jump in CO2 which marks the K-T boundary (covering a period of approx. 10 thousand years) is averaged out over a minimum of 10 million years, leading to the relatively modest rise we witness in atmospheric CO2 at the 65 million year mark on Nova’s graph.
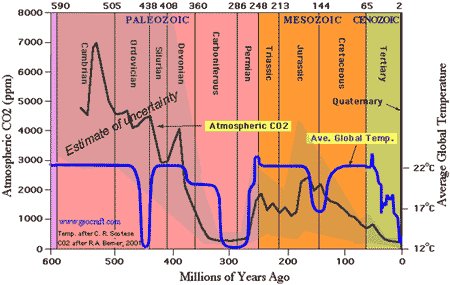
You might also be wondering about the absence of any temperature rise to mark the K-T boundary on Nova’s graph. Well, when I followed the source marked on Nova’s graph (www.geocraft.com), and saw the original graph (Figure 3), it became clear that Nova had conveniently deleted the temperature increase which marked the K-T boundary (at the start of the ‘Tertiary period’).

Figure 3: Graph showing atmospheric CO2 and global temperatures through the Phanerozoic. CO2 levels taken from Geocarb III model; temperature reconstruction taken from ‘PALEOMAP Project’. Source: http://geocraft.com/WVFossils/Carboniferous_climate.html
Interestingly Nova’s source had in turn also misrepresented its own sources, as the temperature reconstruction which the graph at Figure 3 draws upon (see here) shows temperature as increasing from approx. 25°C to approx. 28°C at the K-T boundary, as opposed to the 22°C to 25°C jump shown in the graph. This 3°C increase is consistent with the predictions of Beerling et al’s paper when the counter forcing of aerosols is taken into account.
The paleoclimate record in fact provides excellent evidence that CO2 can have a marked effect on global temperatures, both as a forcing and a feedback. When other natural climate drivers are taken into account, levels of atmospheric CO2 are shown to be consistent with the expected radiative forcing necessary to match past temperature reconstructions.


 Arguments


"What is clear is that it has now taken me 1,739 words, at least four peer-reviewed scientific studies, the IPCC's Fourth Assessment Report, various blogs and websites, and several days, to tell precisely no-one (congratulations if you're still reading), why they should partially refute what Jo Nova has told 200,000 people in 7 words. Those 7 precious words being: "Paltridge found that humidity levels have fallen.""
This is of course the great problem associated with climate "skepticism", but until a law is introduced prohibiting criminal ignorance, we must persevere.
The 'glaciers' could be more accurately described as the south-polar ice cap.
Jo Nova's four arguments from The Skeptic's Handbook are:
1) CO2 isn't causing the observed warming;
2) CO2 doesn't cause warming;
3) The observed warming that CO2 isn't causing isn't happening, and;
3) The CO2 that doesn't cause warming is already causing as much of the observed warming that isn't happening as it can.
Fascinating stuff.
As stated, CO2 has a number of forcings independent of climate (the obvious one being the burning of fossil fuels). The fact that during these last 30 years the solar total irradiance, solar UV irradiance and cosmic ray flux has not shown any significant secular trend, while CO2 in the atmosphere is rising by 15 gigatonnes per year, demonstrates the impact of human activity on atmospheric CO2.
The study you quoted strengthens this argument.
I don't have graphs, but if you click the links down the left hand side you can see maps of continental distribution.
CO2 is not the only driver of climate
CO2 has been higher in the past
High CO2 in the past, Part 2
CO2 was higher in the late Ordovician
On temperature and CO2 in the past
I don't think there's a 'skeptic' argument that John hasn't already covered at some point, but sadly the same misinformation is still being propagated by some individuals and needs to be corrected again and again.
John asked me to do this post partly because Jo Nova is currently travelling around Australia as part of the 'Watts up with the climate' tour. I've pulled together the specific claims she makes in her 'Skeptic's Handbook II' regarding past climate and CO2, and drawn attention to the manipulation of the temperature reconstruction she relies upon, i.e. the deletion of the K-T boundary event.
"My use of the term was taken from the article itself..."
Hence the reinstatement. The comments policy here is based on behaviour, not whether the majority of readers agree with the comment, and generally works pretty well - I rarely have to overrule any action by the moderators and the discussion is IMHO of a high quality.