Climate Science Glossary

Term Lookup

Enter a term in the search box to find its definition.

Settings

Use the controls in the far right panel to increase or decrease the number of terms automatically displayed (or to completely turn that feature off).

Term Lookup

Settings


All IPCC definitions taken from Climate Change 2007: The Physical Science Basis. Working Group I Contribution to the Fourth Assessment Report of the Intergovernmental Panel on Climate Change, Annex I, Glossary, pp. 941-954. Cambridge University Press.

Home Arguments Software Resources Comments The Consensus Project Translations About Support

Bluesky Facebook LinkedIn Mastodon MeWe

Twitter YouTube RSS Posts RSS Comments Email Subscribe


Climate's changed before
It's the sun
It's not bad
There is no consensus
It's cooling
Models are unreliable
Temp record is unreliable
Animals and plants can adapt
It hasn't warmed since 1998
Antarctica is gaining ice
View All Arguments...


Username
Password
New? Register here
Forgot your password?

Latest Posts

Archives

Increase Of Extreme Events With Global Warming (Basic Version)

Posted on 11 November 2011 by Rob Painting

For a more technical version of this post, see here

It seems common sense  that as the Earth warms we will see more record-breaking warm extremes, and less cold ones.  What the authors of a recent study, Rahmstorf & Coumou (2011), sought to find out is how much of these extreme events can we put down to the slowly evolving change in climate, and how much is due to random variations in weather.

The authors developed a statistical approach to evaluate record-breaking events. They found that long-term warming increased the odds of record warm events in global temperature, and when applied to the 2010 monster summer heatwave in Moscow, Russia, they calculated an 80% probability the record-breaking heatwave would not have happened without climate warming.  

Analogy time - if it floats your boat

Before going any further, a useful analogy here is to consider a boat moored in a marina. The incoming tide is our slowly changing component (warming climate), and waves are our rapidly fluctuating short-term component (weather). Over a period of time we measure the height of the boats mast, from the top of the jetty to which it is tied. Was the incoming tide responsible for the greatest recorded height?, or was it because of random wave action alone?  

Rolling the dice   

In order to find out how much each process (weather/climate warming) contributed to record-breaking extremes, the authors turned to Monte Carlo simulations. These are calculations in a computer program, where random numbers are run over and over again. The best way to think of this is rolling a dice. Rolling the dice once tells us nothing about the probability of rolling a six, but roll it 100,000 times (as in the experiment) and you can calculate the probability of a six turning up.

Using the actual data from both the NASA GISS global and July Moscow temperature observations (see figure 1) the authors carefully applied statistical analysis to strip out the weather component from the long-term nonlinear climate trend (see figure 2). The remaining long-term climate trend then gave them a template upon which they could run Monte Carlo simulations of the weather (this is comparable to stripping out the waves, in our analogy, and using the rising tide as a template, or backbone for wave simulations).
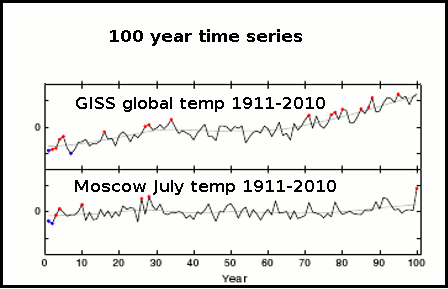
Figure 1 -GISS global, and Moscow July temperature time series 1911-2010. Both data sets have been normalized (i.e. scaled into a common refererence frame so comparison can be made). NB:  Normalization (scaling) has the effect of making the change at Moscow look smaller than it actually is, due to very large annual fluctuations in temp. The long-term increase over the 100 year period is 1.8°C, more than twice the global average.  Adapted from Rahmstorf & Coumou (2011).
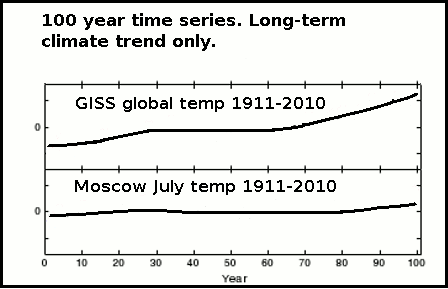
 

Figure 2 - long-term trend only extracted from the GISS global, and the Moscow July temperature time series from 1911-2010 . Again, both data sets have been normalized. From Rahmstorf & Coumou (2011).

Planet Earth only rolls the weather dice once, but with the Monte Carlo simulation the authors were able to see what might happen if the Earth was able to do this over and over. By running the simulations with the added long-term climate trend, and without, the study authors were able to see how many times a record-breaking event pops up, and calculate probabilities.

And that other Russian Heatwave study? 

The work of Rahmstorf & Coumou (2011) directly contradicts that of an earlier study on the 2010 Moscow heatwave (Dole [2011]). But it turns out that Dole (2011) failed to account for a glitch in the Moscow July station temperature data, which saw an urban heat island (UHI) correction erroneously applied. This was confirmed by checking with satellite temperature data. This over-correction  mistakenly wiped out the warming trend and replaced it with a slight cooling trend. In our analogy that would be like assuming the tide fell, rather than rose. So it is little wonder that Dole (2011) came a different conclusion.

What are the odds?

Based on their statistical/analytical model, Rahmstorf & Coumou (2011) calculated that the climate warming of the last 100 years has increased the probability of record-breaking warm events in global temperatures, and in Moscow during July. In regard to the freak 2010 Moscow heatwave, (excluding 2010 temperatures) the authors estimated an 80% probability that the record would not have happened without the warming climate.

0 0

Printable Version  |  Link to this page

Comments

Comments 1 to 25:

  1. I have just been reading this article communicating the science of climate change in physicstoday regarding the way scientists communicate with the public about climate science. When do you think scientists will be able to say accurately things like - there is a ...% chance that this event was due to climate change- on a regular basis rather, than the 'sceptic' friendly 'It is impossible to attribute any specific event to AGW'? Weather forecasters use similar phrases regularly and it would convey a more realistic scenario to the unenlightened. Wouldn't it?
    0 0
  2. 1 - invicta I guess this is off topic for this thread but thinking that accurate predictions will have any impact is deluded. Google words like "YU55, NASA, coverup" and see what turns up. AFAIK the presence of the comment was well known, none of the lunatic bridgade have any "evidence" beyond what scientists provide - yet NADA scientist are "liers"!! Don't over estimate the intelligence of those we're up against.
    0 0
  3. 2-les Spending too long here or similar sites can make you (me) think that the lunatic brigade are what is important. In truth I think the important people are the great majority who couldn't care less either way. (in my experience) Until the message gets through that what's going to happen will or is affecting them (us) directly they will continue to care less and bother their politicians not at all. In which case we are all simply using all this electricity for our own amusement.
    0 0
  4. 3 - Invicta You've hit the nail on the head there. Many climate hawks (ie those who want strong action on dealing with climate change; blame Joe Romm for that one..) spend a lot of time trying to argue to point with the denialist fringe. Pointless. Such people have invested emotionally in the denialist-narrative, that suits them very nicely, for various personal reasons; they won't be shifted - it's a faith. Of course plenty on the 'climate hawk' side are somewhat intractable and faith-based too.. But the others outside this schism - the great apathetic wedge in the middle - won't form an opinion on CC until CC intrudes rudely on them. It is already doing so, of course, but it's too nebulously attributed. Putting probability numbers such as "80% this extreme weather event that flooded your house/ dried your reservoir/ flattened your crops/.. was down to climate change" changes the picture dramatically. If the attribution is valid, and reported consistently, CC stops being a wishy-washy creep of the 'global average thermometer over a decade' (which that no-one directly experiences anyway) Much more of this sort of research/reporting please!
    0 0
  5. I'm thinking that the work on the probability of the Moscow heat wave/drought could be extended to multiple locales. For instance, one might ask the question, "What are the odds that X regions of Australia, the US, China, Russia, and possibly others, have occurred within Y years of each other?" You could might have to look at the historical records to see how much concurrence, if any, has existed for droughts in the same regions. If the number of such events occurring in close proximity to each other is common in history, but not associated with global warm periods, then it means less. If they have been mostly uncorrelated in the past, and are becoming more correlated, or if common occurrences are associated with warm periods, then it means more. I'm going to throw out a guess that you would find an association between the frequency of these events and warm periods, and you might find the regions just poleward of Hadley cells were the most likely to be unusually warm and dry. Otherwise, yeah, at best you can attempt to keep the undecideds from being swayed by misinformation. If the undecideds really cared, they would not be undecided; there is plenty of information available. Maybe the trick is to catch them at the moment they start to care. Maybe attributions of crop damage, food prices, and social unrest will work better than appeals to preserve the habitat of what most people consider exotic species. On the other hand, appeals to preserve their own children do not work on those who have convinced themselves that nothing bad will happen to them.
    0 0
    Response: [DB] Dr. James Hansen has a pertinent new article out on his website: Climate Variability and Climate Change: The New Climate Dice
  6. **** correction "..., have experienced unusual or record warm/dry events within Y years..."
    0 0
  7. DB inline#5: That is a beautiful paper. No doubt he will be denounced by the usual denouncers for it. People who deny the global warming cause of these extreme events usually offer instead a meteorological "explanation". For example, it is said that the Moscow heat wave was caused by an atmospheric "blocking" situation, or the Texas heat wave was caused by La Nina ocean temperature patterns. Of course the locations of the extreme anomalies in any given season are determined by the specific weather patterns. However, blocking patterns and La Ninas have always been common, yet the large areas of extreme warming have come into existence only with large global warming. Today's extreme anomalies occur because of simultaneous contributions of specific weather patterns and global warming. Too bad he didn't use the phrase 'rolling thirteens.'
    0 0
  8. DB, I think one would have to have a moderate understanding of statistics to understand just how chillingly dead-on that paper is to what I really did not want to hear. I don't know how to convey what an increase from 0.1-0.2% to 6-13% coverage of 3 sigma (or greater) anomalies means to a person who doesn't know what a Gaussian distribution is. Dr Hansen's saying that "...there is no need to equivocate..." is perhaps an understatement. I was hoping that recent events would remain anomalous for some decades; the data would indicate that is unlikely. It's all there in figure 6, Europe 2003, Australia 2009, the Amazon, Russia and the Middle East 2010, and Texas 2011. The area with 3 sigma warming sometimes pops in different places in different years, it waxes and wanes, but it is growing inexorably. Thanks, I think.
    0 0
    Response:

    [DB] The graphic that Chris refers to is this one:

    Click to enlarge

    Figure 6. Jun-Jul-Aug surface temperature anomalies over land in 1955, 1965, 1975 and 2003-2011 relative to 1951-1980 mean temperature in units of the local standard deviation of temperature.

  9. That figure (Hansen's Fig 6) is a very elegant way of expressing how extreme events (the 2-3 sigma reds and browns) are on the rise due to AGW, but not uniformly everywhere every year. The next time somebody suggests Texas wasn't extreme, or that Australia / Europe / Russia / Amazon has had such events before therefore there's no problem, they should be referred to that graphic. Roll the dice each year, fancy being under a red or brown in your local summer? It's getting more and more likely...
    0 0
  10. Skywatcher @9, Too true. Who will be this austral summer's drought/heat wave victim, or next boreal summer's drought/heat wave victim? Southern Africa is currently enduring a heat wave, with temperatures between 35 C and 45 C. Also see here. Is it now their turn for a 2 or 3 sigma event?
    0 0
  11. Invicta@1 Assigning probabilities to single events should be possible now. A probability doesn't assign a direct cause to an event, it just states the likelihood of an event being caused by one of two possibilities. So even if it had a high probability of being caused by AGW, it doesn't actually mean that event was caused by AGW. Really what you are asking scientists to do isn't much different to what is already being done.
    0 0
  12. PaulD@11 How important is getting the message across to the disinterested public. I suggest that even your clear and not technically difficult comment would leave a lot of them yawning. How scientist talk to the public must be a factor in the equation. If eg Dr Phil Jones had said something like "No, I would say that the warming trend of 0.12deg C since 1995 does not quite achieve statistical significance....." a great many lurid headlines might have been avoided. But probably going OT
    0 0
  13. What I would put in the basic version is an explanation of the types of events that are more likely to occur: heat waves, extreme drought, and extreme rainfall; and those that are more ambiguous like hurricane: probably stronger but fewer; or events like 11/11/11: http://cafnrnews.com/2011/10/midwests-perfect-storm/ triggered by cold/warm contrast (may decrease over time).
    0 0
  14. 13, Eric, Here is a bar chart of Atlantic storms from the Wikipedia List of Atlantic Hurricane Records. I added the horizontal lines for easy visual comparison to previous years. Notice anything (click the image to see it larger)?
    0 0
  15. Spharica, those numbers require some explanation of how hurricanes were and are now detected. Here are some interesting graphics: 1921-1980 and 1981-2000
    0 0
  16. 15, Eric, The graph is of both named storms and hurricanes, the vast majority of which never reach landfall. Is the implication that no one was able to properly notice tropical storms which grew so large they required names -- without the advent of modern technology? Do you have a citation of a source that explicitly makes the case that hurricanes were under-reported prior to some selected date?
    0 0
  17. Sphaerica, There was a discussion on that last winter and muoncounter's conclusion was " this particular aspect of the science isn't settled". I brought it up again here and muoncounter pointed out in the next post that there are some studies showing an increase, some showing no increase, but no studies showing a decrease. So still somewhat unsettled ATM.
    0 0
  18. 17, Eric, No argument on what is settled. It is so early that it's hard to prove a climate change attribution for any extreme weather event, simply because the period is too short and the net change is too small. This is what has been discussed a lot, but is changing day by day as extreme events become more common and more extreme. Picking the signal out of the noise gets easier every year. And it will continue to get a lot worse. I am merely addressing your specific statement of expectation of what is likely to occur. You list heat waves, extreme drought and extreme rainfall as events that are more likely to occur. You suggest that hurricanes will probably be stronger but fewer. I am simply pointing out that evidence to date is to the contrary. It is far from settled, but it also appears that the "stronger but fewer" hypothesis is not, at least for now, supported by observations. In fact, it is strongly refuted by observations of Atlantic storms. Specifically, in the past 16 years, 10 of those years have had 15 named tropical storms or more. The previous 102 years only had 4 such years. 6 of the 10 most intense Atlantic hurricanes in the past 100 years occurred in the past 13 years, 5 of those in the past decade. Using data going back to 1851 (i.e. a span of 160 years) the 9 largest storms by diameter all occurred in the last 15 years. Even if you want to dismiss data prior to the satellite era as unreliable... 9 of the largest in whatever period you want to choose occurred in the last 15 years! Is older data suspect and less accurate, prior to globalization, modern instruments and satellites? It always is. This is an ongoing impediment to climate science. Is the science settled? No. Do observations support the idea that stroms will be stronger but fewer? No. Current observations (over a short period in a world that has not warmed nearly to the point that we have already committed with current CO2 levels) strongly support the idea that at least in the Atlantic we will see both more numerous storms and more powerful storms.
    0 0
  19. 17, Eric, I will concede from the data offered that it makes no statement as to total number of storms. If you wish to take the position that an increase in named storms, hurricane strength storms and hurricane size and intensity all represent an increase in strength, while the total frequency of storms (including those that do not become strong enough to earn names) remains the same, then I will concede that point. Note that I am also well aware that much of the literature argues for the point you are making (an increase in intensity, not frequency) based on simulations. I am simply pointing out that the most recent data appears to contradict this, and I look forward to future attribution studies which will have a larger data pool from which to draw conclusions.
    0 0
  20. Eric #17: "muoncounter's conclusion..." I'm flattered, but I am also hardly a reputable source. One of the more telling points, after considerable back and forth over which metric to use (!), was this graphic: -- source This was an attempt to analyze ACE (accum cyclonic energy), which is purely a wind speed - duration metric, by its components. In addition, there was some discussion of the fact that ACE ignores the large rainfall events like tropical depressions and gives more weight to slow-moving storms. So the context of 'the science isn't settled' was an argument over interpretations of fewer landfalling storms/more named storms and lower ACE/more precipitation. We can now add another datapoint/bone of contention: Of the 25 'above normal' Atlantic seasons (including 2011) shown here, 15 occurred since 1970; of the 13 'hyperactive' seasons, 8 occurred since 1995.
    0 0
  21. Sphaerica and muoncounter, thanks for the feedback. The 10-15 years of stronger and more frequent storms is still a bit short to draw strong conclusions. My impression from the landfalling storms (links in #15) is that decades were heavily clustered and almost every decade will bring forth a new pattern. But that may be more applicable to landfall than all tropical storms. My view on the frequency vs strength is that increasing strength seems like a no-brainer, but frequency requires both warmth and dynamics, warmth alone is not enough to spawn tropical storms. "Hyperactive" ACE trends (last link in #20) seem to reflect that increase in strength which could still use a little more evidence (8/13 is still too close to 50/50 IMO).
    0 0
  22. Eric#21: "(8/13 is still too close to 50/50 IMO)." That's 62% of the hyperactives in the last 16 years. The remaining 38% are spread over 1950-1995 or 45 years. Even if the ratio was 50/50, that would still be a very asymmetric distribution.
    0 0
  23. Additional evidence of increasing Euro heat. “The reduction in days of extreme cold is due to an increase in the average minimum temperature from 0.5ºC to 1ºC during the analysis period, while for days of extreme heat, the increases in the average maximum temperature were from 0.5ºC to 2ºC” And evidence of more frequent Euro drought. "The magnitude and frequency of the drying that has occurred is too great to be explained by natural variability alone," said Martin Hoerling, Ph.D. of NOAA's Earth System Research Laboratory ... "This is not encouraging news for a region that already experiences water stress, because it implies natural variability alone is unlikely to return the region's climate to normal." These are connected: Dry Winters In North Mediterranean Stoke Hot European Summers From an analysis of meteorological records spanning the past 58 years, Vautard et al. determine that parched conditions around the northern Mediterranean create a mass of anomalously warm, dry air that spreads northward in early summer.
    0 0
  24. Muoncounter, that's a assuming that 1995 cutoff date is meaningful. I could set the cutoff date to 1980 (half way back to 1950) and the ratio is still 62/38. The most accurate description is that there was a lull from 1970 to 1995.
    0 0
  25. "Following up on my post earlier today about how climate change equals more extreme weather, here’s is a full repost of an excellent Skeptical Science article I’ve been wanting to share. Great content and well-presented:" Source: "Increase of Extreme Weather Events & Global Warming," Zachary Shahan, Planetsave, Nov 18, 2011 To access the article, click here.
    0 0

You need to be logged in to post a comment. Login via the left margin or if you're new, register here.


The Consensus Project Website

THE ESCALATOR

(free to republish)


© Copyright 2024 John Cook
Home | Translations | About Us | Privacy | Contact Us