Climate Science Glossary

Term Lookup

Enter a term in the search box to find its definition.

Settings

Use the controls in the far right panel to increase or decrease the number of terms automatically displayed (or to completely turn that feature off).

Term Lookup

Settings


All IPCC definitions taken from Climate Change 2007: The Physical Science Basis. Working Group I Contribution to the Fourth Assessment Report of the Intergovernmental Panel on Climate Change, Annex I, Glossary, pp. 941-954. Cambridge University Press.

Home Arguments Software Resources Comments The Consensus Project Translations About Support

Bluesky Facebook LinkedIn Mastodon MeWe

Twitter YouTube RSS Posts RSS Comments Email Subscribe


Climate's changed before
It's the sun
It's not bad
There is no consensus
It's cooling
Models are unreliable
Temp record is unreliable
Animals and plants can adapt
It hasn't warmed since 1998
Antarctica is gaining ice
View All Arguments...


Username
Password
New? Register here
Forgot your password?

Latest Posts

Archives

Is the airborne fraction of anthropogenic CO2 emissions increasing?

Posted on 31 December 2009 by John Cook

The 'airborne fraction' refers to the amount of human CO2 emissions remaining in the atmosphere. Approximately 43% of our CO2 emissions stay in the atmosphere with the rest being absorbed by carbon sinks. But is the airborne fraction increasing? A paper published in November 2009 found no statistically significant trend (Knorr 2009). Anthony Watts labeled this result the "Bombshell from Bristol" - A potentially devastating result for anthropogenic global warming. Was it such a shock? The 2007 IPCC verdict on the airborne fraction was "There is yet no statistically significant trend in the CO2 growth rate since 1958 .... This 'airborne fraction' has shown little variation over this period." (IPCC AR4) I'm not sure the move from "not much happening" "to "still not much happening" warrants the label "bombshell".

The airborne fraction is calculated from the rate of human CO2 emissions and changes in atmospheric CO2 concentration. The global increase in atmospheric CO2 has been directly measured since 1959 and can be calculated from ice cores for earlier periods. Primarily, CO2 emissions come from fossil fuel combustion with a lesser contribution from land use changes. Fossil fuel combustion is calculated from international energy statistics. CO2 emissions from land-use changes are more difficult to estimate and come with greater uncertainty. Land use emissions are estimated using deforestation and other land-use data, fire observations from space and carbon cycle modeling.

There have been several recent studies determining the airborne fraction. Trends in the sources and sinks of carbon dioxide (Le Quere 2009) examines the airborne fraction from 1959 to 2008. This period was chosen as we have directly measured atmospheric CO2 levels over this time. Fossil fuel emissions rose steadily in recent decades, contributing 8.7 ± 0.5 gigatonnes of carbon in 2008. This is 41% greater than fossil fuel emissions in 1990. CO2 emissions from land use was estimated at 1.2 ± 0.4 gigatonnes of carbon in 2008. Note the proportionally higher uncertainty compared to fossil fuel emissions.

Over this period, an average of 43% of each year's CO2 emissions remained in the atmosphere although there is much year-to-year variability. The noise in the airborne fraction was reduced by removing the variability associated with El Nino Southern Oscillation (ENSO) and volcanic activity. They found the airborne fraction increased by 3 ± 2% per decade. This is a slightly increasing trend although only barely statistically significant .

Knorr 2009 extends this analysis back to 1850 by combining direct CO2 measurements from Mauna Loa and the South Pole with CO2 data derived from Antarctic ice cores. This enabled Knorr to compare CO2 emissions to atmospheric CO2 levels for the past 150 years.
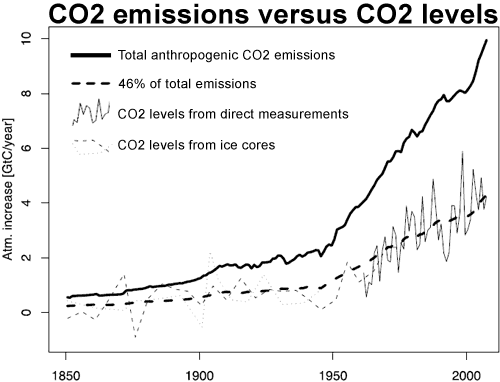

Figure 1: Observed increase atmospheric CO2 derived from direct measurements, taking the average of Mauna Loa (Hawaii) and the South Pole (thin solid line) and two ice cores: Law Dome (dashed thin line) and Siple (thin dotted line). This is compared to total anthropogenic emissions (thick solid line) and 46% of total emissions (thick dashed line). (Knorr 2009)

Knorr finds that since 1850, the airborne fraction has eemained relatively constant. When CO2emissions were low, the amount of CO2absorbed by natural carbon sinks was correspondingly low. As human CO2 emissions sharply increased in the 20th Century, the amount absorbed by nature increased correspondingly. The airborne fraction remained level at around 43%. The trend since 1850 is found to be 0.7 ± 1.4% per decade.

There are several differences in methodology between Knorr 2009 and Le Quere 2009. Knorr's result does not include the filtering for ENSO and volcanic activity employed by Le Quéré. However, when Knorr does include this filtering in his analysis, he finds a trend of 1.2 ± 0.9% per decade. This is smaller than Le Quere's result but is statistically significant.

Knorr also finds the 150 year trend while Le Quéré looks at the last 50 years. This may be significant. If the airborne fraction is increasing, it is possibly a recent phenomenon due to natural carbon sinks losing their absorption ability after becoming saturated. Several studies have found recent drops in the uptake of CO2 by oceans (Le Quere 2007, Schuster 2007, Park 2008). However, with such a noisy signal, this is one question that will require more data before being more fully resolved.

Lastly, some perspective. There are still areas of uncertainty associated with the carbon cycle. Because of this uncertainty, scientists are currently debating whether the airborne fraction is steady at 43% or slightly Increasing from 43%. Unfortunately, some skeptics use this uncertainty to hold the position that the airborne fraction is closer to 0%.

0 0

Printable Version  |  Link to this page

Comments

1  2  Next

Comments 1 to 50 out of 85:

  1. Brief comment, I got tripped up looking at the above (10 gigatonnes) and referring back to the previous post (29 gigatonnes). I'm sure this is due to carbon being weighed here versus carbon dioxide being weighed in the previous post. I was also tripped up by the quotation from AR4: "There is yet no statistically significant trend in the CO2 growth rate... since 1958." That's kind of confusing because the growth rate of CO2 is increasing. I guess all I'm trying to say is that even this relatively straightforward stuff can be confusing if one isn't careful when reading it.
    0 0
  2. It's hard for me to understand how the rate of absorption can become reduced or the system become saturated. Common sense would say if you were looking at the movement of a substance from one fluid to another (atmosphere to ocean) then the larger the gradient (in this case caused by higher CO2 conc in the atmosphere) then the faster the diffusion of material. In terms of the sinks becoming saturated. We known the biosphere is absorbing more CO2 through evidence of he greening of the planet. This may be only trivial anyway, it seems the ocean is likely the greatest store of carbon according to this quote "It [the oceans] already contains an estimated 40,000 GtC (billion tonnes of carbon) compared with only 750 GtC in the atmosphere and 2,200 GtC in the terrestrial biosphere (IPCC, 1996)." http://web.mit.edu/energylab/www/pubs/overview.PDF Again it seems unlikely that this system has been tipped over the edge by humanity insignificant input (0.025%). This analysis does assume that the natural CO2 cycle has been in perfect equilibrium over this whole period of time. The need for correction for ENSO and volcanos suggests there isn't a steady natural state but a dynamic process. Can you imagine more so far unidentified factors which might be affecting this analysis?
    0 0
  3. If half of the carbon we produce is absorbed and as I remember about half of what we produce is from burning coal does that mean that if we stop burning coal the atmospheric carbon will begin to decline? Also is it possible that any reduction of carbon uptake by the ocean is a result of higher temperatures rather than saturation?
    0 0
  4. John: Nice treatment of an easily misunderstood (cough cough) topic. I'm constantly amazed by the steps "some people" will take to leap to a conclusion (i.e. the "therefore it must be zero" thing you mentioned).
    0 0
  5. Humanity Rules @2: Again it seems unlikely that this system has been tipped over the edge by humanity insignificant input (0.025%). Cumulative human additions of C to the active carbon cycle since the pre-industrial era have been around 329Gt (C only). [CDIAC] That would be .766% of total C in the active carbon cycle, not .025%.
    0 0
  6. On a lighter note: Happy New Year to all of you. Be safe tonight.
    Remember that when driving, just as with climate, rate of change (in this case, of velocity) *does* matter.
    0 0
  7. Quote: ----- "[Fossil fuel combustion is calculated from international energy statistics. CO2 emissions from land-use changes are more difficult to estimate and come with greater uncertainty.]" Of course it should be very difficult, since CO2 molecules are identical and indistinguishable at that level of density therefore it behaves according to quantum statistics (particle indistinguishability of fermions and bosons) which deviates from classical maxwellian-boltzman particles which are distinguishable. Any claim to measure CO2 emission level from a specific source must be viewed with suspicion, since one cannot distinguish the CO2 that originated from source A or CO2 that originated from source B and so forth, since the particles are identical (statistical mechanics).
    0 0
  8. FF, have you never heard of carbon isotope ratios? This allows for identification of sources of CO2.
    0 0
  9. Yes, there is another twist to this tale. Without looking into to too much right now, C14 which is created from fossil burning. Apparently it is able to be measured. I think I remember reading an article by Roy Spencer(big, important skeptic) questioning that research too! LOL. But that should be the next topic to explore. Back to the topic above. The Knorr paper concludes with "The hypothesis of a recent or secular trend in the AF cannot be supported on the basis of the available data and its accuracy." Doesn't this mean they don't understand what is going on. It continues that they need to know more about land use, well I say what about CO2 changes in the ocean, which hold many times over the CO2 of the ocean. They can likely fairly estimate the man-made CO2, and then they just work backwards to fill n the number.
    0 0
  10. Wrong isotope, nfw, try 12C to 13C.
    0 0
  11. FF, it's not necessary to measure emissions to know how much CO2 is produced by burning fossil fuels, we only need to look at the accounting of fuel production. For example, we know that global oil production is about 31e9 bbl/year. From that we can calculate the amount of CO2, after taking into account the fraction of the oil going toward non-fuel purposes ( http://numero57.net/?p=255 ). It comes out to about 10e12 kg of CO2 per year produced by burning petroleum. Similar calculations can be made for coal and natural gas.
    0 0
  12. John, maybe you should say something about the IPCC model forecasts re fraction of CO2 in atmosphere? It would also be interesting to learn more about the reason for the different estimated trends (1.2 vs 3 %/decade). Is it only because of Knorr using a longer time series for his modeling?
    0 0
  13. Humanity rules wrote: "It's hard for me to understand how the rate of absorption can become reduced or the system become saturated. Common sense would say if you were looking at the movement of a substance from one fluid to another (atmosphere to ocean) then the larger the gradient (in this case caused by higher CO2 conc in the atmosphere) then the faster the diffusion of material." You're right about the second paragraph there but you just might be missing one important point. In order for the airborne factor to increase, the flux of CO2 to oceans etc. does not need to decrease. In order for AF to stay constant, the flux needs to increase at the same rate as emissions. Therefore, even if the flux of CO2 from atmosphere to the oceans etc. increases, but slower than the emissions, the AF will increase. Actually, mathematically a constant AF is exactly what you would expect, if you had exponentially growing emissions combined with sinks, whose rate is linearly proportional to the concentration.
    0 0
  14. sorry... Probably there are other causes of greater relevance than are being systematically ignored, not only by the scientific community, but by the IPCC, for example, rapidly growing trend of forest fires directly proportional to the exorbitant growth population in the world. Read news about a few months ago published: + http://www.cubanuestra.nu/web/article.asp?Artid=15784 More information on this site (by autor): + http://calentamientoglobalacelerado.net/alerta.htm
    0 0
  15. Could someone please extend some charity to a philosopher and tell me what assumptions are made when direct measurements of carbon dioxide concentrations in Earth's atmosphere are made? For example, is it assumed that CO2 molecules are distributed randomly throughout Earth's atmosphere including the stratosphere? Or is there some reason to believe that CO2 particles collect mostly within the first mile or the first 8 miles or whatever of the Earth's atmosphere?
    0 0
  16. Theo Goodwin: CO2 is well mixed throughout the atmosphere--horizontally and (all the way up to the stratosphere). See the Skeptic Argument CO2 Measurements are Suspect. In addition to John's original post there, read the comments by Chris, John's "Response" in the green box within comment 16, and the new comment by me.
    0 0
  17. Theo Goodwin: It is sometimes assumed by non-scientists that heavier gas molecules must be found closer to the earth's surface. However, for long-lived species such as CO2, atmospheric mixing (air motions) very effectively stirs up all the gases together so that they are not vertically separated. As one gets in the upper atmosphere (at very low pressures, approaching space), this is no longer true, but this region represents a tiny fraction of the mass of the atmosphere. This does not mean that all gases are perfectly evenly mixed, however. Obviously, near CO2 sources the concentrations will be higher, and near CO2 sinks (such as growing vegetation), the CO2 will be lower. So the end result is a patchiness to atmospheric CO2. There is a seasonality to this, since most vegetation is in the northern hemisphere. This seasonal cycle of CO2 is referred to as the "breathing" of the planet as the vegetation takes up CO2 during the growing season and gives it up during the fall and winter. The CO2 measurements report whatever the CO2 concentration is at a given place and time. Most of these measurements are extremely accurate and precise--a great deal of effort goes into assuring constant calibration standards and reproducibility. One has to average the CO2 measurements over the annual cycle and over the globe to get the global mean value. Hope this helps.
    0 0
  18. I think the idea that CO2 is diffused evenly througout the atmosphere is bogus. If that were true then all molecules of any type would be equally distributed - including clouds. And since clouds are here and there - so must be molecules. Also, the NASA CO2 map belies the idea that CO2 is evenly distributed. So the sampling for CO2 must be worldwide - not from few hundred stations.
    0 0
  19. ralphiegm, observations trump what you or anyone else "thinks." Also, you are incorrect that all kinds of molecules must be distributed to the same degree; just one example is water vapor's low concentration in the stratosphere versus lower, versus CO2's much more even concentration across those altitudes. Read the above comment by cbrock, and click the links in my above comment.
    0 0
  20. NASA CO2 graphic http://sustainablog.org/files/2008/10/nasa_co2map.jpg Tom Dayton - the graphic from NASA depicts widespread, highly varying concentrations of CO2 - if CO2 was diffused evenly the color on the globe would be just one color.
    0 0
  21. If that were true then all molecules of any type would be equally distributed - including clouds. And since clouds are here and there - so must be molecules.
    Clouds are made up of droplets of water or small bits of ice, not individual molecules of H2O, so your comment regarding clouds is irrelevant.
    Also, the NASA CO2 map belies the idea that CO2 is evenly distributed.
    and
    http://sustainablog.org/files/2008/10/nasa_co2map.jpg
    Depends on your definition of "evenly distributed". The NASA AIRS plot you reference has a scale of 376-386 PPM, or 381 +/- 5 PPM. That's 381 PPM +/- 1.3%. That's extremely close to "evenly distributed". The press release is actually a bit weird, the AIRS data quantifies the "lumpiness". It's always been *known* that it takes time for CO2 (and other gasses) to become distributed by wind etc throughout the atmosphere - if you crack a tank of pure CO2 obviously the CO2 concentration near the tank will be higher than the average in the atmosphere. But once the tank runs out, the CO2 will rapidly disperse and that's it. So this isn't new knowledge at all. It's just quantification of how close to being 100% well-mixed the atmosphere is. We can measure it now, couldn't before, that's all.
    0 0
  22. Tom Dayton - the graphic from NASA depicts widespread, highly varying concentrations of CO2
    On what did you base your "highly varying" comment? Was it because they used a full spectrum of color (blue to red) to portray the +/- 1.3% variance (with most of the globe falling into a range of < 1.3% variance), or is it because you actually think the +/- 5 PPM range is really "highly variant"? Just curious.
    0 0
  23. Tom Dayton and cbrock, thank you for answering my question, putting me to materials, and carrying on the conversation. If I may ask another, could you point me to an article on techniques of measuring airborne carbon dioxide concentrations?
    0 0
  24. There is a 3% variation in the mid-troposhpere (5 miles) and no data on CO2 close to the earth. If the atmosphere is mixed well in that layer it is surely less well mixed at lower levels. If you are seeing a rise in CO2 levels how would you really know whether you were in a density wave or not? And as for clouds which reside at about 2 miles - they are indicators that the atmosphere is not uniformly dense. It appears that real CO2 data would be needed from literally millions of sampling points at varying strata not just the 200 or 300 stations that are used.
    0 0
  25. Theo, I don't know if there is a single article describing all the methods in detail, because different methods are used by spacecraft versus aircraft versus ground stations. But a description of the collection method on Mauna Loa is on NOAA's site. And on the AIRS site, click on the two links in the section titled "Measuring CO2 from Space with AIRS."
    0 0
  26. Ralph, you are incorrect that there are "no data on CO2 close to the Earth." Just no data at that level of the atmosphere from AIRS. There are lots of data at that level from ground stations and aircraft, all over the world. The fact that CO2 is well mixed is not an assumption, nor a theoretical prediction. It is an observed fact dating back to at least the U.S. military's measurements in the 1940s. The number of observing stations, and their distribution, have been settled on as a satisfactory sampling, based on those empirical observations. Read dhogaza's comments in this thread; the variation in the mid-troposphere is tiny--less than half of the already-tiny 3% that you claimed. That variation is inconsequential to the big picture of CO2's global warming effects. Climatologists and atmospheric scientists of course got all excited about that tiny variation, because that is their narrow, microscopic specialty. Why do you persist in insisting that clouds are indicators that the atmosphere is uniformly dense? dhogaza already explained to you that clouds are not made of gas molecules, so their distribution and even existence is not evidence of gas molecules being unevenly distributed. If you want more detailed explanations, blogs are not the right place. Go look at Ray Pierrehumbert's book on planetary atmospheres, to which I pointed you earlier.
    0 0
  27. I look at it this way - the earth surface area is about 200 million square miles. That means each CO2 sensor must account for about the equivalent of one million square miles (I think there are only 200-300 long term datasets). So, this is just one dataset for all of Alaska and California and Texas combined (almost). As for clouds - I think the clouds indicate the LACK of uniformity of density in the atmosphere since they show visually how different the atmosphere can be - regardless of whether you consider water a molecule or not (it is). All I am saying is we would need millions of data sensors to get a handle on the total weight of CO2 in the atmosphere and the data we have is just too weak right now.
    0 0
  28. But Ralph, you're just wrong. Factually wrong. Empirically wrong. Seriously wrong. Go read Pierrehumbert's book. It's free. It's online so it's easy to search for key words.
    0 0
  29. I'll certainly take your advice but I will see if there is any one that agrees with my assessment.
    0 0
  30. ralphiegm @ 27: no, we don't need millions of data sensors to get a handle on the total weight of CO2 in the atmosphere. We need millions of measurements by a sensor that moves around and covers the entire globe. Like a satellite in a polar orbit. That's how that NASA map you linked was produced. AIRS returns more than three million measurements per day, according to http://airs.jpl.nasa.gov/story_archive/Measuring_CO2_from_Space/Measurement_to_Science/ There's also a comment on that page: "...carbon dioxide concentrations turn out to vary by two to four parts per million. 'Before AIRS everyone thought carbon dioxide was well mixed above the boundary layer. We found that it is not.' It can vary by nearly a percent." So to you & I, CO2 is pretty evenly distributed. To scientists, a difference of a percent is quite significant - thus the choice of a scale for the graph that *highlights* that small variation. I thought it was interesting to note the comment further down about the coal-fired power plants on the Australian east coast being one of two major CO2 sources in the southern hemisphere, the other being a coal-to-liquids plant in South Africa that is the world's biggest single source of CO2.
    0 0
  31. Bern - I don't think a satellite actually measures CO2 and certainly not throughout the column. It is more that they measure something else then calibrate those readings with ground station CO2 readings. So if the ground stations are limited so will the satellite data be limited. And the NASA map indicates only some final averaging of data - the highest CO2 values over Antarctica, Peru and Morocco me skeptical. As an Engineer I would like to see widespread, actual measurements throughout the air column around the globe before I make a judgement about the state of CO2. Satellites are cute - but I am not convinced that they are providing sufficient data to base climate models.
    0 0
  32. As for clouds - I think the clouds indicate the LACK of uniformity of density in the atmosphere since they show visually how different the atmosphere can be - regardless of whether you consider water a molecule or not (it is)
    Well, Ralph, a glass of water is not a molecule. A raindrop is not a molecule. The droplets of water or bits of ice that make up a cloud are not molecules. That's just fact, Ralph. As far as the number of sensors needed to accurately sample CO2 in the atmosphere, you flat-out don't know what you're talking about in this case, either.
    0 0
  33. Ralph, it is not necessary for satellite measurements to be calibrated against a huge number of ground stations, for the same reason that thermometers to stick under human tongues do not need to be calibrated against a huge number of human tongues. The size and type of sample needed for calibration of any instrument is properly determined by combination of observation with statistics about those observations. That's what's done with satellite measurements. An engineer should know that.
    0 0
  34. I assume clouds are water vapor - dense "clouds" of water "molecules". If the atmosphere was completely mixed then "clouds" would appear uniformly in all the sky. And the high concentration of CO2 over the Antarctica is really puzzling - it makes me skeptical when I see data that does not fit one's common sense. I thought all this CO2 was supposed to be coming from blast factories - I doubt penguins have mastered that technology.
    0 0
  35. ralphiegm wrote @18: I think the idea that CO2 is diffused evenly througout the atmosphere is bogus. If that were true then all molecules of any type would be equally distributed - including clouds. Ralph, as an engineer are you not familiar with the concept that temperature falls with altitude, thus limiting the amount of water vapour in the atmosphere as altitude increases? (Look up terms: lapse rate, moist adiabat, relative and absolute humidity, condensation) There is no such limitation on the mixing of CO2.
    0 0
  36. Jim - I am only using clouds as an "indicator" of mixing - the clouds could be made of helium filled ping-pong balls for my argument. If the atmosphere was completely mixed we would be seeing these ping pong balls (clouds) everywhere in the sky with a 3% or less variance (as is reported for CO2). But we don't see clouds everywhere - we can agree to that I hope. So why would we expect CO2 to be so evenly spread out through the atmosphere? Something is amiss and I suspect it is the actual CO2 data which comes from so few actual CO2 samples, relatively speaking. In my estimation there are undiscovered CO2 cool spots laying about which may balance out reported rises in CO2.
    0 0
  37. ralphiegm said:
    the clouds could be made of helium filled ping-pong balls for my argument. If the atmosphere was completely mixed we would be seeing these ping pong balls (clouds) everywhere in the sky.
    Have you ever filled a balloon with helium and let it go? Please tell me what your engineering experience tells you. Will it fall to the ground, remain at head height or quickly rise into the sky and disappear from sight in the heavens? Any engineer worthy of the name should understand simple density.
    0 0
  38. Ian - you avoid the point I am making, the ping pong balls are imaginary, an example - just something to indicate mixing. Assume I said pollen, or dust, or chlorine. If the atmosphere was completely mixed - there would be these indicators in equal concentrations everywhere. Clouds are an indicator of mixing in the atmosphere - and they show that the atmosphere is not well mixed.
    0 0
  39. ralphiegm, your reasoning is correct if two conditions are met: 1) no phase transitions (gas/liquid, liquid/solid etc.) 2) equally long lifetime and source/sink stength of the molecules in the atmosphere. Neither is met by water vapour; it condenses to form liquid droplets or solid crystals (clouds) and viceversa it can readly evaporate from the oceans or land; it's lifetime is quite short. If you accept that CO2 lifetime is long and that no liquid or solid CO2 can exisist in our real atmosphere, even common sense will indicate that it may be considered well mixed. One final remark, i'm sure you know that a lot of volatile substances has been found trapped in the antarctic ice even if they have been originated somewhere else in the planet. The same happens to CO2.
    0 0
  40. RE: ralphiegm Clouds are made up of frozen droplets, that is each frozen droplet contains millions of water atoms bonded together. Water molecules have a strong dipole moment and so so will form crystals quite readily if given the right conditions, and if I quote wikipedia for water... "Oxygen attracts electrons much more strongly than hydrogen, resulting in a net positive charge on the hydrogen atoms, and a net negative charge on the oxygen atom. The presence of a charge on each of these atoms gives each water molecule a net dipole moment. Electrical attraction between water molecules due to this dipole pulls individual molecules closer together, making it more difficult to separate the molecules and therefore raising the boiling point. This attraction is known as hydrogen bonding." CO2 is very different when in the atmosphere not only is in the gas phase (so you won’t get them bonding together like water) but it has a zero dipole moment . Thus you would expect that its behavior to be different from water in the atmosphere given it being in a different phase and having a distinctly different electronic structure. The 'hard sphere model' which I think you’re trying to compare it to (ping pong balls, pollen or even billiard balls) is a good model for other more simpler molecules and systems but it will not adequately represent these molecules in the atmosphere.
    0 0
  41. Ralph, clouds are not an indicator of mixing, they are an indicator of 1) a temperature low enough that water vapour will condense into water droplets and 2) the presence of sufficient nucleation particles for them to condense onto. "Assume I said pollen, or dust..." Then you would be talking about solids, not gases. CO2 is a gas.
    0 0
  42. "are you saying that Antarctica is releasing CO2 ?" Easy enough to actually look up. Hmmmm, Mount Erebus, erupted in 2008 & 2009. Date of cited ARIS CO2 plot, July, 2008. I'm just sayin.
    0 0
  43. Jim - I think a particulate can be an indicator of mixing in the atmosphere. Why not? My point being only that the data appears to be so limited on the CO2 in the atmosphere since there are only 200 or so data sets. I think I have shown that there is proof of incomplete mixing in the atmosphere by merely viewing the variability of clouds. My observation is as (in)accurate an assessment as "tree rings" are for long term temperature models. Further, the NASA global CO2 map shows no correlation between industrial land uses and the highest CO2 values. A true scientist would be worried about such problems.
    0 0
  44. ralphiegm, "Riccardo - are you saying that Antarctica is releasing CO2 ?" Actually the opposite. CO2 is NOT emitted in Antarctica but it's there at roughly the same concentration as anywhere else because it is well mixed. And it is well mixed because it is long lived and it can not condense into liquid nor evaporate from an existing liquid. The very opposite is true for water vapour which infact is NOT (at all) an indicator of the mixing of the atmosphere. Hence your supposed "proof" (sic) of incomplete mixing is faulty. "A true scientist would be worried about such problems." Please do not suppose that all the scientists are not true scientist just because they do not agree with you. And do not think you can teach people how to do their job while you're nowhere near the field.
    0 0
  45. Riccardo - not to disrespect any scientist - but do you believe there are enough data points throughout the entire shell of the atmosphere to accurately model CO2? In my estimation there is not a computer model in the world that can predict future CO2 and future global temperatures. It is difficult to model a 2 dimensional system such as a river for pollutants with any degree of accuracy. Now, we are being told that the world can be modeled for a sneaky CO2 molecule. Complicating matters infinitely is the fact that CO2 is part of the carbon-based life-cycle on our planet. I can only guess how many assumptions need to be made in such a model - which starts out with bare-boned CO2 data to begin with. I think its an impossible task - and irresponsible of scientists to imply to the public that they know firmly anything at all about the climate other than what the weather channel can give us. BTW - I have extensive computer modeling experience and a graduate degree in environmental engineering and know that models of natural systems are nothing more than curiosities. I don't like to see others touting these models as truth - cause they're not. I would listen to a model of global CO2 that had 100 years of data tied with accurate temperature data and ground CO2 data at grid points of 5 miles including the oceans and air columns. Until that data arrives I'll be skeptical. No "tree rings" for me.
    0 0
  46. @ralphiegm not to disrespect any scientist - but do you believe there are enough data points throughout the entire shell of the atmosphere to accurately model CO2. Show me one station that shows a big difference then the other and I will be more inclined to believe the CO2 needs to be measured more finely. Why does the Antarctica CO2 graphs show a similar annual increase to all the others if CO2 is not distributed relativity evenly. I think a particulate can be an indicator of mixing in the atmosphere. If you get a bunch of small neutrally buoyant pieces (Particulates),some red food dye(CO2) and water(Atmosphere) and mix them all together by stirring. The red food dye will be distributed evenly while the pieces will all collect together underneath the mixer. ground CO2 data at grid points of 5 miles Why 5 miles and not 1 mile. If you really believe that CO2 is not mixed evenly go out and buy a CO2 meter. on your daily travel look at the readings. if you find a big variation then look around for a big emitter of CO2(and make sure you are measuring the outside not the inside). If you can't find one then look up how to get a science paper published because you have found something no one has found before.
    0 0
  47. Have been following this web site for a while. I have some observations and questions. Of the CO2 we produce the northern hemisphere produces what percentage? 90%,85% or 80% It is then stated, in this thread that the CO2 then evenly mixes through the atmosphere. But on this web site it's a tale of to hemisphere's: http://www.livescience.com/environment/080930-chemical-equator.html The Chemical equator as they decribe it, where the poluted air is in the north and the south is considerably cleaner. Now I have seen CO2 readings from Cape Grim, Tasmania, Australia. http://www.esrl.noaa.gov/gmd/ccgg/carbontracker/co2timeseries.php (Go to: Site CGO_01d0) and as you can see they indicate CO2 levels at 385ppm at present time. The point is I'm finding it hard to believe that northern hemisphere CO2 is the cause of ppm levels to rise in the southern hemisphere.
    0 0
  48. Catprog - see the problem is you are assuming CO2 is well mixed. You have no way of ever proving that assumption unless you take the zillions of measurements necessary to prove such a thing or if you had a dispersion / diffusion model that explained how CO2 can populate the atmosphere on its own. It appears that climate study is based on the super smooth mixing of CO2 in the atmosphere. It appears that CO2 can range from 250 to 425 ppm looking at 5 year smoothed data. And diurnal cycles in CO2 varying by 50 ppm. And seasonal variation from 350 to 415 ppm (all nos. rounded by me from the literature for illustrative purposes). So how can anyone have such faith in the CO2 well-mixed assumption given the crazy variations in CO2. It does not make sense to take a dogmatic position on CO2 being uniformly distributed through the atmosphere.
    0 0
  49. It seems Ralph is getting some of his ideas from Herr Beck's paper in Energy & Environment. http://www.realclimate.org/index.php/archives/2007/05/beck-to-the-future/ That explains much.
    0 0
  50. Jim - Are you saying that CO2 can only be in concentrations ranging from 360 to 380 ppm?
    0 0

1  2  Next

You need to be logged in to post a comment. Login via the left margin or if you're new, register here.


The Consensus Project Website

THE ESCALATOR

(free to republish)


© Copyright 2024 John Cook
Home | Translations | About Us | Privacy | Contact Us