Climate Science Glossary

Term Lookup

Enter a term in the search box to find its definition.

Settings

Use the controls in the far right panel to increase or decrease the number of terms automatically displayed (or to completely turn that feature off).

Term Lookup

Settings


All IPCC definitions taken from Climate Change 2007: The Physical Science Basis. Working Group I Contribution to the Fourth Assessment Report of the Intergovernmental Panel on Climate Change, Annex I, Glossary, pp. 941-954. Cambridge University Press.

Home Arguments Software Resources Comments The Consensus Project Translations About Support

Bluesky Facebook LinkedIn Mastodon MeWe

Twitter YouTube RSS Posts RSS Comments Email Subscribe


Climate's changed before
It's the sun
It's not bad
There is no consensus
It's cooling
Models are unreliable
Temp record is unreliable
Animals and plants can adapt
It hasn't warmed since 1998
Antarctica is gaining ice
View All Arguments...


Username
Password
New? Register here
Forgot your password?

Latest Posts

Archives

Is Arctic Sea Ice 'Just Fine'?

Posted on 18 August 2010 by Alden Griffith

Guest post by Alden Griffith from Fool Me Once 

The decline in arctic sea ice over the last three decades is one of many important indicators of global warming.  It also represents an important feedback in the climatic system: as ice melts, the earth’s surface becomes less reflective and absorbs more energy, resulting in more warming (and more ice melting and more warming, etc…).  However, some would like you to believe that all is well up north.  In his March 12, 2009 testimony to the U.S. Congress, Lord Christopher Monckton described arctic sea ice as “just fine” (see text here and slides here).

Below are two figures from his reports for the Science and Public Policy Institute that he uses to support this claim (the first of which was part of his testimony):
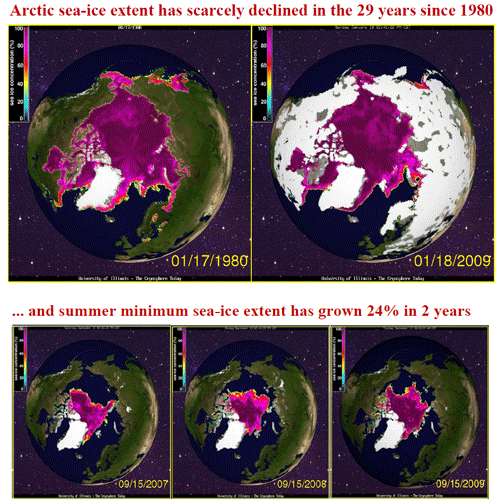
Figure 1: Images of arctic sea ice extent used by Lord Christopher Monckton to support the notion that “arctic sea ice is just fine.” (SPPI 2009, 2010)

The top figure – “Arctic sea-ice extent has scarcely declined in the 29 years since 1980” – rests on two datapoints of arctic sea ice extent in January 1980 and January 2009.  The bottom figure – “summer minimum sea-ice extent has grown 24% in 2 years” – uses three datapoints, showing sea ice extent in September from 2007 to 2009.  So with all of the research that has been carried out on arctic sea ice, we only need 5 data points to conclude that sea ice is fine?  Let’s see how these data look when plotted on a graph:
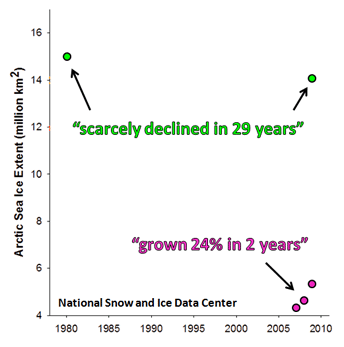
 

Figure 2: Monckton’s 5 datapoints plotted using arctic sea ice extent data from the National Snow and Ice Data Center (NSIDC).

The graph above looks a little sparse, so let’s fill it in with all of the available sea ice extent data from the NSIDC:
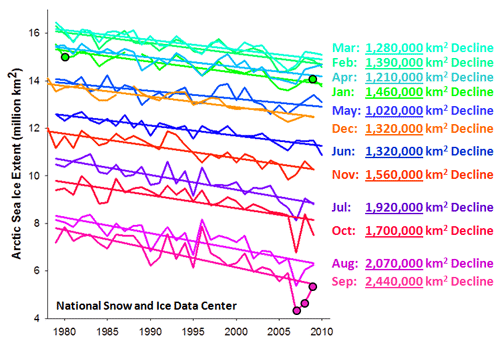
Figure 3: Arctic sea ice extent data for every month from November 1978 to June 2010 (NSIDC).  Reported declines in sea are calculated from the start to the end of each month’s trendline. 

Wow.  More than just cherry picking, this is like trying to hide an elephant behind a teacup!  The entire 30-year dataset on sea ice extent is about as unambiguous as it gets: sea ice is declining.  In particular, the start of the September trendline in 1979 is nearly 2.5 million square kilometers above the end of the trendline in 2009.  How big is that?:  Picture the U.S. east of the Mississippi River (minus Wisconsin).  Or the Mediterranean Sea.  Or one and a half Alaskas.  This is a big deal.  Unless you live in a cherry-picked world of only five datapoints, arctic sea ice is not "just fine"

Be sure to check out Fool Me Once for a more thorough presentation of the claim that "arctic sea ice is just fine / rebounding".

0 0

Printable Version  |  Link to this page

Comments

Comments 1 to 23:

  1. Fantastic post that perfectly illustrates the problem of the cherry-picking done by contrarians and the need to look at trends rather that single points.
    0 0
  2. Well,we all like cherries. Arctic ice however seems to be doing some strange things. Part of the problem lies in the fact that our only reliable record goes back to the 1970s with the advent of satellites. Other records seem to go back no further than the 1870s. Do we have proxies for ice sheet extent predating this period? Currently, it seems to be defying trends with a summer melt less than predicted while Arctic temperatures appear to be below average (if I'm to believe the sceptics). On the other hand, Antarctic sea ice seems to be growing with a net increase in world sea ice (again, if I take sceptical sources at face value). I appreciate the Greenland ice sheet mass seems to be declining as is the Antarctic land ice sheet and I'm aware of the instability in the West Antarctic peninsula. So which cherries do I pick? Proxies for pre 1870s ice sheet extent if available would be helpful in placing today's behaviour in perspective.
    0 0
  3. Chris, Cherries may be nice, but picking two or three data points to make your point is taking it a tad too far. Three decades is long enough to detect a trend - if you include all data points that is. Here are good, recent posts on the Arctic and Antarctica. There are plenty more if you do a search.
    0 0
  4. I also love how Monckton picks a graph from Jan 1980 that has NO snow on it. I mean, look at all the snow in the 2009 graph. It looks soooo much colder to me!
    0 0
  5. Thanks Alden. Once again, the full presentation on Fool Me Once is brilliant. I'm surprised that his lordship's lawyers haven't been in touch with you yet! On a serious note, Monckton's cherry picking is scandalous, particularly just focussing on the rebound in the September minimum from 2007 to 2009. If you look back to 1990 - 1992, you will find a remarkably similar rebound, followed by, oh yes, a continued decline.
    0 0
  6. Anne-Marie, I have no quarrel with the trends over thirty years which your post deals with. However, in the context of climate change, thirty years is really too short a time span. After all, the MWP and LIA (be they localised or global phenomena) are substantial climatic events which took place over many years. It would be interesting to know if we have any way of tracking sea ice extent at those times. For example, if we had evidence that sea ice extent was greater in the MWP than today...? Hence, my question regarding proxies over recent centuries. Reference to such data if available would make the argument more robust.
    0 0
  7. Chris, The problem is that we can only deal with the data we have. Satellite data over the past 30 years give us a clear picture of what's happening. Knowledge of past Arctic changes are not needed to draw conclusions about what's happening now. I agree that it would be interesting to have data for other periods but we don't - or I'm not aware of such data. However, the point of this article was specifically to highlight the outrageous cherry-picking by Monckton, which is as unscientific as it gets.
    0 0
  8. Here's a scary thing. This is a graphic from the IPC TAR of 2001 Are my eyes deceiving me, or is the Actic Ice minimum extent for the last few years much closer to the 2040-2060 scenario than the one projected earlier? Here is an image from a few days ago (white is 100% concentration, declining to blue <~30%):
    0 0
  9. chriscanaries - Arctic ice melt does not seem to be much less than expected to me, in that according tot he latest IJIS data we're at 5.83m sq km, with a loss rate that has been steadily above 50-60,000sq km since mid-July. We're closely tracking 2008's extent, which would lead to the 2nd or 3rd lowest in the record. As for Arctic temperatures, maybe others here can confirm (or corrent me if I have it all wrong), but so far as I understand it, the Arctic air temperature in summer is not a good guide to warmer/cooler conditions. When you look at the Arctic temperature graph (>80deg N is the skeptics favourite), you see it flattens out during summer months, rather than smoothly heading to a peak several degrees higher. The reason for this is that much of the energy that would otherwise be warming the air temperature is being used up in melting ice (latent heat of melting), and so this holds temperatures close to freezing until all the ice is melted away. North of 80deg N the ice does not melt out entirely (at least for now), so temperatures are held down all summer. Thus a tempeature around 1C in the Arctic may only tell you that ice is melting, not whether it's much warmer or colder than previous years.
    0 0
  10. chriscanaris, the main problem with reading your comments are that you try to score a point without doing any homework - leveraging the assumption of no useful pre-1979 data into undermining the observations of decline. There is no 'defying trends', a cold spell in the Arctic is obvious - when it's covered in smoke (http://www.ssd.noaa.gov/PS/FIRE/DATA/SMOKE/2010H050457.html) is typical of a hoodwink. Any research at all would have shown you that Antarctic sea-ice isn't a proxy for cooling, and the trend is flat, with a very very small increase as a trend. The worst problem, however, is that after demonstrating little of your own reseach, you conclude there's similar 'cherry-picking' from the two sides (that's a symptom of anti-science syndrome). Just so there's no confusion about the lack of homework your post represents, a 101 start is Wikipedia:- http://en.wikipedia.org/wiki/Measurement_of_sea_ice Then move up to the NSDIC data that's graphed back to the early 50s - and shows the late 70s as the start of more than just satellite records. http://nsidc.org/sotc/images/mean_anomaly_1953-2009.png http://nsidc.org/sotc/images/mean_anomaly_1953-2009.png In fact, the article pointing out the ugly state of the arctic (as opposed to the 'just fine' joke) is bang on.
    0 0
  11. Chris, the skeptic claim that global sea ice is increasing is, like the others you cited which have already been addressed, simply false; Global trend If you look at the red anomaly data on that graph you'll see that on the left the anomalies rarely dipped below the baseline... while on the right they seldom rise above it. In short, the anomaly trend for global sea ice area is very clearly decreasing. Also, the fact that Arctic sea ice extent does not set a new record low every year is not indicative of a 'recovery'. Indeed, the fact that the Arctic sea ice volume (the actual AMOUNT of ice... as opposed to how 'spread out' it is) has continued to plummet shows just how ridiculous that claim is.
    0 0
  12. Arctic Ice extent is only less than predicted if you are talking about a LINEAR trend. However, as Tamino showed, it fits a quadratic trend pretty well, implying an acceleration in recent years.
    0 0
  13. W/regard to Chris' concern about what we know of past Arctic sea ice extent, not surprisingly this has been a subject of research. Thanks in part to fanatical peering through microscopes at diatom and foraminifera skeletons, past sea ice extent can be teased out of the record. Assessing inter-decadal conditions stretches reconstruction skills but there is enough detail in the record to begin making comparisons between today's conditions and past patterns of behavior of Arctic sea ice. We're not really in the dark on this. Past extent of sea ice in the northern North Atlantic inferred from foraminiferal paleotemperature estimates Sea ice variations in the central Canadian Arctic Archipelago during the Holocene A biomarker-based reconstruction of sea ice conditions for the Barents Sea in recent centuries Arctic climate change: observed and modelled temperature and sea-ice variability Palaeoceanography and climate changes off North Iceland during the last millennium: comparison of foraminifera, diatoms and ice-rafted debris with instrumental and documentary data Abrupt climate changes for Iceland during the last millennium: evidence from high resolution sea ice reconstructions Arctic environmental change of the last four centuries Past glacial and interglacial conditions in the Arctic Ocean and marginal seas-a review
    0 0
  14. #2: "defying trends with a summer melt less than predicted" That sounds like the kind of misconception posted around denier sites who happily pore over these curves. What do they fail to notice in graphs such as this? Everybody looks at the 2007 curve and concludes that the melt amount is less because all other curves are well above that minimum. However, look where the yellow and red curves start the melt season: at a value well above the black curve. Its the difference between annual max and annual min that counts. If the prior year's max extent is greater and the mins are close, the melt amount is in fact increasing. #6: "in the context of climate change, thirty years is really too short a time span." A sea ice reconstruction going back to 1870 is available here. The min extent (column 4) is fairly flat thru 1950, then begins falling at an increasing rate. Is it just coincidence that the CO2 (ice core+atmospheric composite) curve begins taking off at about the same time? But why should that matter? If 30 years of decreasing extent isn't enough to establish the problem, how will presenting more make any difference?
    0 0
  15. 2. chriscanaris Arctic Sea Ice (Part 1): Is the Arctic Sea Ice recovering? A reality check This post show sea ice back to the 1880's from the work of Walsh and Chapman.
    0 0
  16. 2. chriscanaris: Do we have proxies for ice sheet extent predating this period? History of sea ice in the Arctic Leonid Polyak et al. This paper has a lot of information and references that may help Chris. As an example "Fig. 12. Comparison of a multi-proxy reconstruction of sea-ice extent in the Nordic Seas during 1200–1997AD" appears relevant to your question.
    0 0
  17. With regards to the denier claim that the ice is higher than predicted, we might want to revisit Dougs' post stating predicted ice values to see what was really predicted. I see values ranging from 4.2 -5.7 x 10^6km2 (the 1.0 value is not a scientific prediction). It appears that the actual value will be near the middle of that range, unless something unusual happens. WUWT predicted 5.8 10^6km2 (and then changed to 5.6), that is what is is today so their prediction was too high.
    0 0
  18. As a digital artist myself and one working extensively with maps, it is easy to spot a bit of Photoshop work in the first (top left) panel of Monckton's maps dated 17/01/1980. The characteristic digital artefact of Photoshop's "Polar Inversion" filter is apparent around the North Pole of that map, with the pixels in a radial pattern there. It's a pretty basic transform that allows a cylindrical map to be turned into a polar map (Stereographic or AZED-type). What's been composited there? A pretty cack-handed effort I'd say. The others may well have been retouched more convincingly. But his efforts may indeed be all about the most deliberate and flagrant red herrings to waste the maximum possible amount of everybody's time...
    0 0
  19. owl905: you're imputing motives that ain't there. I'm genuinely interested in making sense of a welter of conflicting claims. I asked an honest question and I thank Doug_Bostrom, mdenison and others for coming up with a some papers which I'll be looking at with great interest (which is one of the reasons I like this site). CBDunkerson: your comments about the global anomaly trend certainly fit an eyeballing of the graph - I wonder if anyone's looked at the statistical significance. I'm thinking of something on the lines of tobyjoyce's presentation of Tamino's reconstruction.
    0 0
  20. @#2. chriscanaris: So which cherries do I pick? @#6. chriscanaris: Anne-Marie, I have no quarrel with the trends over thirty years which your post deals with. However, in the context of climate change, thirty years is really too short a time span. You pick all the cherries, chris. And, of course, 30 years is less than ideal but with things happening fast you'll be surprised. First, a general explanation, and then a concrete example. It's a matter of focus. When we focus on the small picture the 'eyes' of our mind tends to get stuck on certain things and our vision blurs. That's when it's time to step back and get a broader look at all the facts, even general facts that don't seem to be related to the subject we were focusing on. Those seemingly unrelated subjects really are of relevance, they just don't seem to be precisely because we're over focused on a small part of the picture at any one time. Here's an example of what I mean. Let's say I'm meditating on the Arctic shrink and I get to wondering why some aspect of it isn't happening as I thought it was supposed to. Forget about it, pull back, and start looking at other aspects of Global Warming even if they are seemingly unrelated to the Arctic. I would meditate on Thermal Lag. the time delay between CO2 coming about with some increase in temperature but not all. My understanding is that we're supposed to get 1*F extra in the next 30 years even if we stop burning all fossil fuels this very minute. That's Global Average. Arctic average would double. How will that effect the ice cap melt that you were so worried about moments before? (If it's not already gone in the summertime by then)? Moral of the story. Thermal Lag, and other 'minor' issues, will make the Arctic ice cap melt you were worried about moot. Rest assured, it's going to happen, and probably worse. We just don't know all the side streets that AGW will travel on.
    0 0
  21. Someday, if he achieves the fame he deserves, the mention of the name "Monckton" is going to have the same connotation as "Piltdown" in the history of science. Or maybe he doesn't even deserve the infamy, it's really just the same old fraud and charade, carefully selected bits cobbled together to demonstrate something that never existed.
    0 0
  22. The latest PIOMAS update puts the mid August ice volume anomaly at about -9,700 cubic kilometers. Given that the baseline for mid August is ~14,500 cubic kilometers that puts the current volume at less than 5,000 km^3... well below the previous record low of 5,800 last September - and with a month yet to go on the melt season. It doesn't look likely that a new minimum EXTENT will be hit this year as the ice is very widely dispersed (though it has started bunching up more the past few days), but the volume has fallen off the bottom of the chart. The way things are going, minimum volume this year will likely be below 4,000 km^3... and if the current trend continues for a few more years the September minimum will have dropped from the 13,400 km^3 long term average down to 0... at which point the extent would also perforce be zero - regardless of how the currents are flowing. Hopefully the extreme melt the past two years has just been a fluctuation and the rate of volume loss will slow down.
    0 0
  23. chriscanaris: Re: Do we have proxies for ice sheet extent predating this period [1870]? There are multiple ways to look for arctic climate information besides the satellite record for arctic ice and thermometer readings. Try these: There are multiple peer reviewed papers that use Canadian lake sediment cores that have temperature indicators going back 200,000 years (that is longer than the Greenland ice cores). These are particularly instructive as they indicate a cooling trend for year 1 up until 1950 (which is what you would expect due to orbit inclination) after which there is a warming trend (even though orbit inclination would generate continued cooling). Just google "canada arctic lake sediment temperature" and check out what pops up. These are good because they are based on multiple locations by multiple scientists The cores also include temperature information related to LIA and MWP if this interests you. One look at the satellite photos of the islands of the Canadian archipelago will tell you why there are no tree ring studies - no trees. There are also some arctic ocean sediment cores. Just google "arctic ocean sediment cores" and see what you find. Another indicator is studies of decreasing ice volume of the ice caps in the Canadian archipelago, such as the Devon Ice Cap. Try google "canadian archipelago ice cap shrinking" or check out the canadian ice caps one by one. Also google "ellesmere island ice shelf" and take a look before they all disappear. This one is pretty scary, so if you would rather believe that nothing is happening, don't look at this topic. Check out the estimates of how long the ice shelves have been around before they broke off - hint several thousand years. The ice cores from Greenland have temperature information and these include LIA and MWP information. I would not get too hung up on LIA and MWP as these can be caused by factors that are not relevant to the current situation. The key is to determine what caused these fluctuations (it wasn't magic, must be physics). Check out the limited explanations and lack of support for the explanations offered for these events and ask yourself if they have proved what caused these events or have they merely offered up a logical explanation based on a single factor. Also ask what it is about these periods that are relevant to the current situation. To be relevant, you would need to show precisely what caused the original event and whether similar conditions are operating today. The mere existence of these prior events proves nothing. Yes there is natural variability, so what does that prove?
    0 0

You need to be logged in to post a comment. Login via the left margin or if you're new, register here.


The Consensus Project Website

THE ESCALATOR

(free to republish)


© Copyright 2024 John Cook
Home | Translations | About Us | Privacy | Contact Us