Just when did humans first start affecting the climate?
Posted on 13 January 2015 by howardlee
Fire!
Homo incendius – “fire man” – is an informal nickname for our ancestors who first learned how to make fire. As one of the quintessential human attributes, you might expect fire-making to have arisen along with our own species, Homo sapiens when we emerged in Africa some 208,000 years ago.
Nope.
You have to go much further back in time, before Neanderthals and even before the earlier Homo heidelbergensis. The first solid evidence for our ancestors’ regular use of fire dates to 1 million years ago, and possibly as far back as 1.5 million years ago. That’s during the reign of Homo erectus – our first fire-making, food-cooking, big-game-hunting, art-making, intercontinental-travelling ancestor.

Homo erectus a.k.a. Homo incendius (Source: Cicero Moraes - via Wikimedia Commons)
Homo erectus took fire-making skills to the Levant and all the way to China by about 770,000 years ago, but strangely our contemporary ancestors who traveled to the fringes of the ice sheets in Europe don’t seem to have been habitual fire-users until much later - about 400,000 years ago.
Our pre-agricultural ancestors may have set fire to their surroundings by accident or deliberately to flush out prey or predators. Either way they left traces of their activity in the form of changes in the quantities and type of charcoal washed into lakes or blown into the dust deposits, later to be recorded by scientists. From records like these it seems that humans were already disrupting of the natural feedbacks between climate, fire regime, and vegetation in a small way as long as 150,000 years ago. Wherever our early ancestors went they affected their regional environment directly through burning and indirectly by removing large browsing animals, with consequential changes to vegetation distribution, but our population was too small (perhaps a few hundred thousand people in all the world 100,000 years ago) to have much impact on global Pleistocene climate.
Pre-industrial, human-caused global warming
Feeding a growing population
Domestication of crops began in the Middle East around 12,000 years ago and by 8,000 years ago people there had become dependent on agriculture for most of their food. Around 7,500 years ago people across a large area of Europe and Egypt began farming those same Middle-Eastern crops, along with domesticated cattle, sheep, pigs, and goats. In China, people began to farm millet and dryland rice around 9,500 years ago, followed by rice farming in flooded paddy fields around 6,500 years ago. Between 7,000 and 5,000 years ago the number of farmed sites in China multiplied a staggering forty-fold!
In South Asia, livestock farming began around 7,000 years ago, spreading across much of Eurasia by about 1,000 years ago. In Sub-Saharan Africa crops like millet, yam, oil palm and Kola nuts were cultivated from around 5,000 years ago, with other crops added later. As the global climate cooled and the summer monsoon weakened, herders moved south from the Sahara, introducing livestock southwards as they went.
In the Americas people began to domesticate various kinds of squash around 10,000 years ago, adding beans, tomatoes and other vegetables later. By 8,700 years ago they had begun to cultivate maize (corn), but it took until 4,300 years ago for human selection to evolve maize with cobs big enough for people to cease dependence on wild foods. Large parts of South America became cultivated, and in North America farming-supported cultures spread through the land surrounding the Mississippi, Tennessee and Ohio rivers from around 2,500 years ago, to the point that by the 16th century much of the region was thickly inhabited.
Burning and breeding
Across the world people cleared forests to make space for agriculture. They used stone tools like the ax in the photo below to girdle (ring-bark) trees until they died, then set fire to the dead wood during dry spells, before planting in the clearings. This earliest farming used extravagant amounts of land compared to today's practices, requiring around 4 hectares (8-9 acres) per person, because of the need to let soil recover ("long fallow") and because there was much less competition for land due to lower populations.
But those farm-fed populations grew dramatically. In Europe the population was well under 1 million at the dawn of agriculture, but by 2,000 years ago it had reached 30 million! In China the intense rice-based agriculture supported a dramatic population rise to about 60 million people by 2,500 years ago. And in the Americas, by the time of the earliest European contact, the population was around 40-60 million, or about 10% of the global population.
An approximately 4,000 year old neolithic stone ax from Langdale in England. By JMiall CC BY-SA 3.0, via Wikimedia Commons
Dwindling resources
By the Roman era, European deforestation was already so extensive that lumber for ship building had to be imported from the far reaches of the empire. By then half the forests of Europe had been eliminated, a process that continued until rulers protected the remaining tracts of woodland by banning commoners from them in the Middle Ages. In China, intense deforestation forced people to burn coal for heat in lieu of wood by the year 400.
By 1600 all but 5-15% of Western Europe had been deforested and there was a growing need to get ever more food from the available land to sustain rising populations. This triggered a number of farming innovations (better plows, windmills to drain wetlands, manure fertilizer, a shorter fallow period, animal husbandry, imported American crops like potatoes), which delivered enough food to sustain a European population of 180 million by 1800 (also helped by better sanitation and medicine).
Pre-industrial greenhouse gas rises
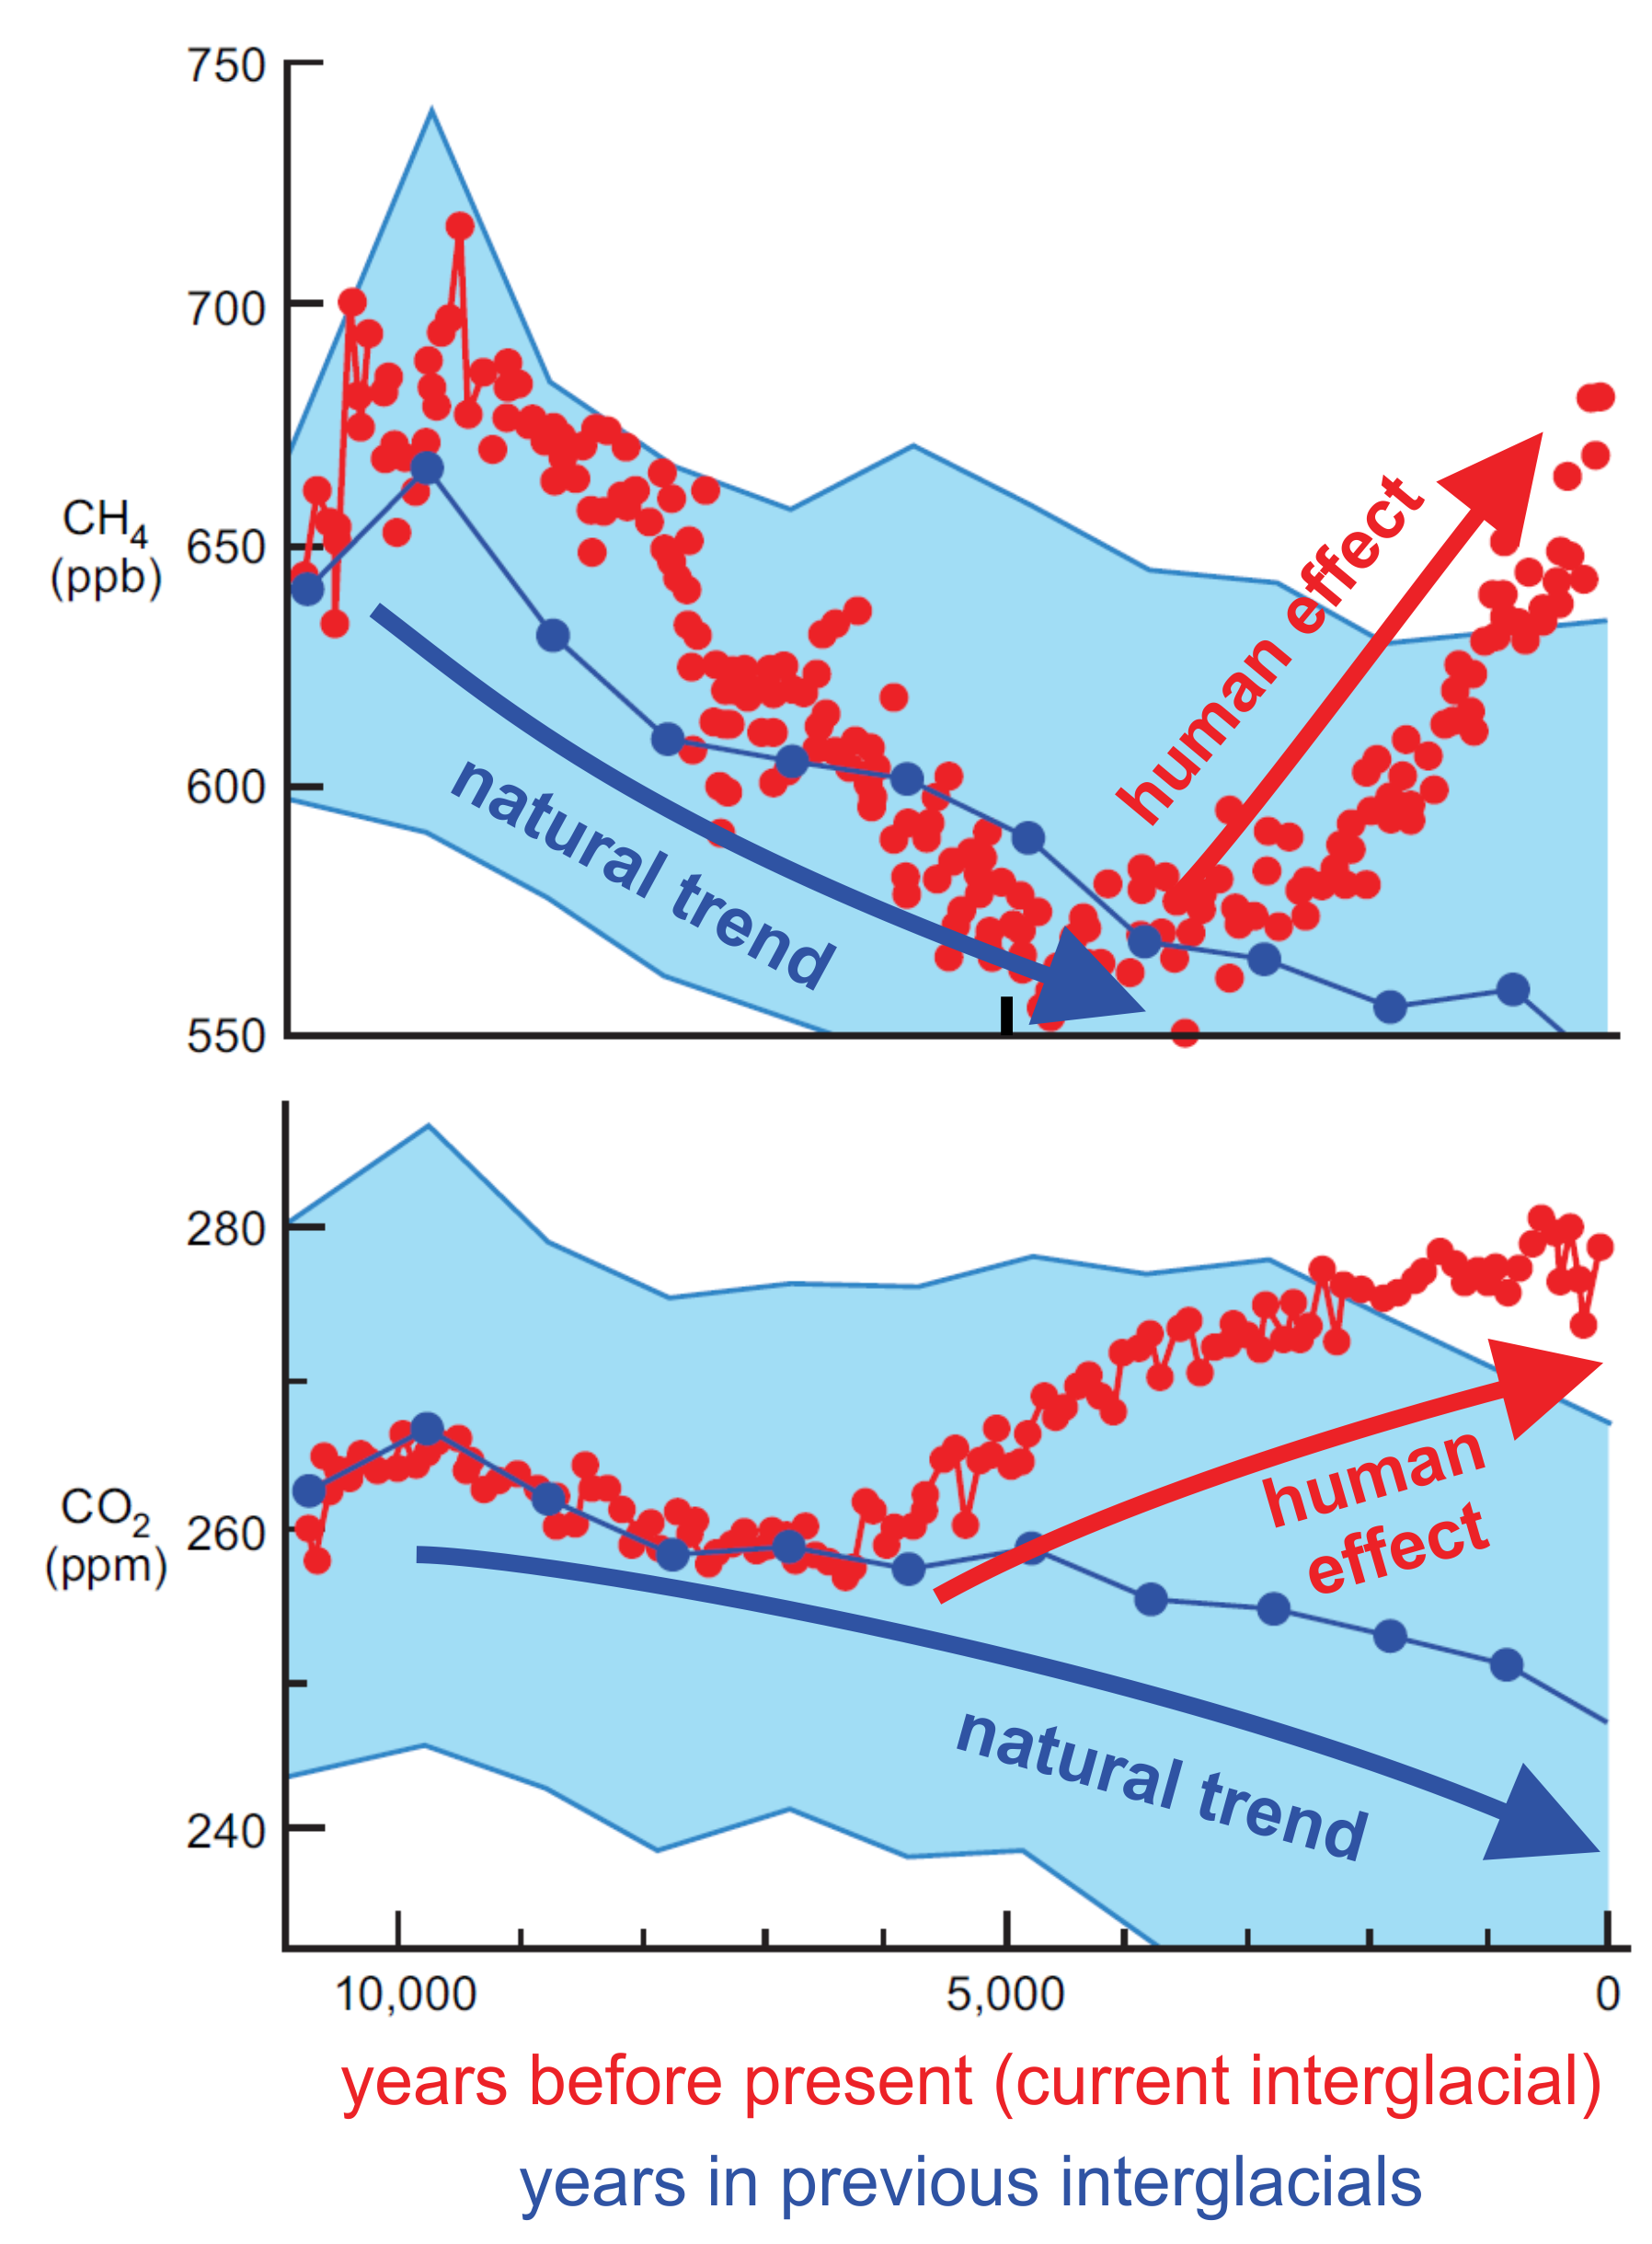
The timing of the widespread adoption of agriculture across Eurasia coincides with increases in atmospheric CO2 and methane levels recorded in ice cores.

Trends in CO2 and methane (CH4): red– current interglacial (Holocene), dark blue– average of prior interglacials over the last 800,000 years aligned by insolation to match early Holocene trend, light blue - standard deviation of dark blue. Source: Ruddiman, et al: “Does pre-industrial warming double the anthropogenic total?” The Anthropocene Review 2014 1: 147 (annotations added for this article)
Methane and CO2 levels had been declining from around 10,000 years ago, in line with the natural cooling climate due to changes in Earth’s orbit, just as they had done in all the prior interglacials. But then they reversed their natural decline at around 6,000 years ago for CO2 and 5,000 years ago for methane. This departure from the natural trend of all prior interglacials in the last 800,000 years was strong and sustained, eventually exceeding the natural range long before the industrial era.
How the spread of agriculture generated greenhouse warming
Most natural methane is emitted from wetlands, and cultivation of rice in wet paddies creates artificial wetlands, which are a significant source of manmade methane. Livestock is another significant source of methane.
Scientists calculated the rise of pre-industrial methane with the help of a GIS (Geographic Information System) populated with archaeological data on the spread of rice farming and also the spread of livestock. They found that the modeled methane increase from both sources tracks the rise of atmospheric methane recorded in ice cores, although calculations suggest that both human-caused and natural sources of methane are needed to explain the methane levels recorded in ice cores.
That methane is gradually oxidized to CO2 at rates of about 540 million tonnes per year. But most of the CO2 was emitted from tree burning and decay, which combines carbon in the wood with oxygen to make CO2. Scientists have calculated that the carbon emitted by the land clearance between 7,000 years ago and the industrial era was around 340 billion tons of carbon, a figure that dwarfs natural emissions. Much of that was returned to the ground in Arctic peat bogs, but the remainder, along with methane, kept the climate warmer by between 0.7°C and 1.2°C than it would otherwise have been. That is roughly the same as the industrial era warming that has occurred since then, but industrial warming is packed into a time period less than 4% as long as the pre-industrial era.
The significance of that warming is that it kept our world from sliding back into the next ice age, which was the natural order of prior interglacial-to-glacial cycles, controlled by wobbles in Earth's orbit around the Sun. In fact, without that extra CO2 and methane, year-round snow would by now be blanketing parts of northern Canada and Eurasia as precursors of the ice sheets typical of ice-age glaciations.
War, Famine, Pestilence, Death!
By the Roman era, population growth, trade, and large-scale movements of armies brought with them the fabled four horsemen of the apocalypse.
Between the years 200 and 600 the population of Europe declined by about 40% (10 million people) through a sequence of plagues: Galen's Plague and the Plague of Cyprian (both possibly smallpox), and the Plague of Justinian (bubonic plague). As a result, farms and villages were abandoned and reclaimed by forests as Europe experienced its "Dark Ages."
Plague struck Europe again between 1347 and 1352 - the "Black Death." Around 30% of the European population died (25 million people). Entire villages were wiped out and crops were left unharvested. In populous areas abandoned farms were soon taken over by others, but in more remote parts of Northern Europe many farms reverted to the wild.
Invasions and civil strife in China between the years 200 and 600 caused the loss of some 15 million people (around 7.5% of global population). Later the Mongol invasion caused a population decline between the years 1200 and 1400. Around 30 million people perished, mostly as a result of starvation resulting from the Mongol destruction of rice paddy infrastructure. Later, in the 1600s, war and smallpox claimed 20 million lives.
But those losses pale when compared to the event which Bill Ruddiman has called: "arguably the greatest tragedy in all of human history."
European contact in the Americas introduced smallpox, swine 'flu, measles, tuberculosis, whooping cough, anthrax, brucellosis, leptospirosis, and malaria, both by personal contact and via the introduction of livestock. Known as "The Virgin Soil Pandemic," it caused the loss of some 50 million people or 85-90% of the combined American population over a century starting around the year 1525. Entire cultures collapsed and the old settlements, farms, buildings, monuments, roads and earthen mounds were abandoned to nature.
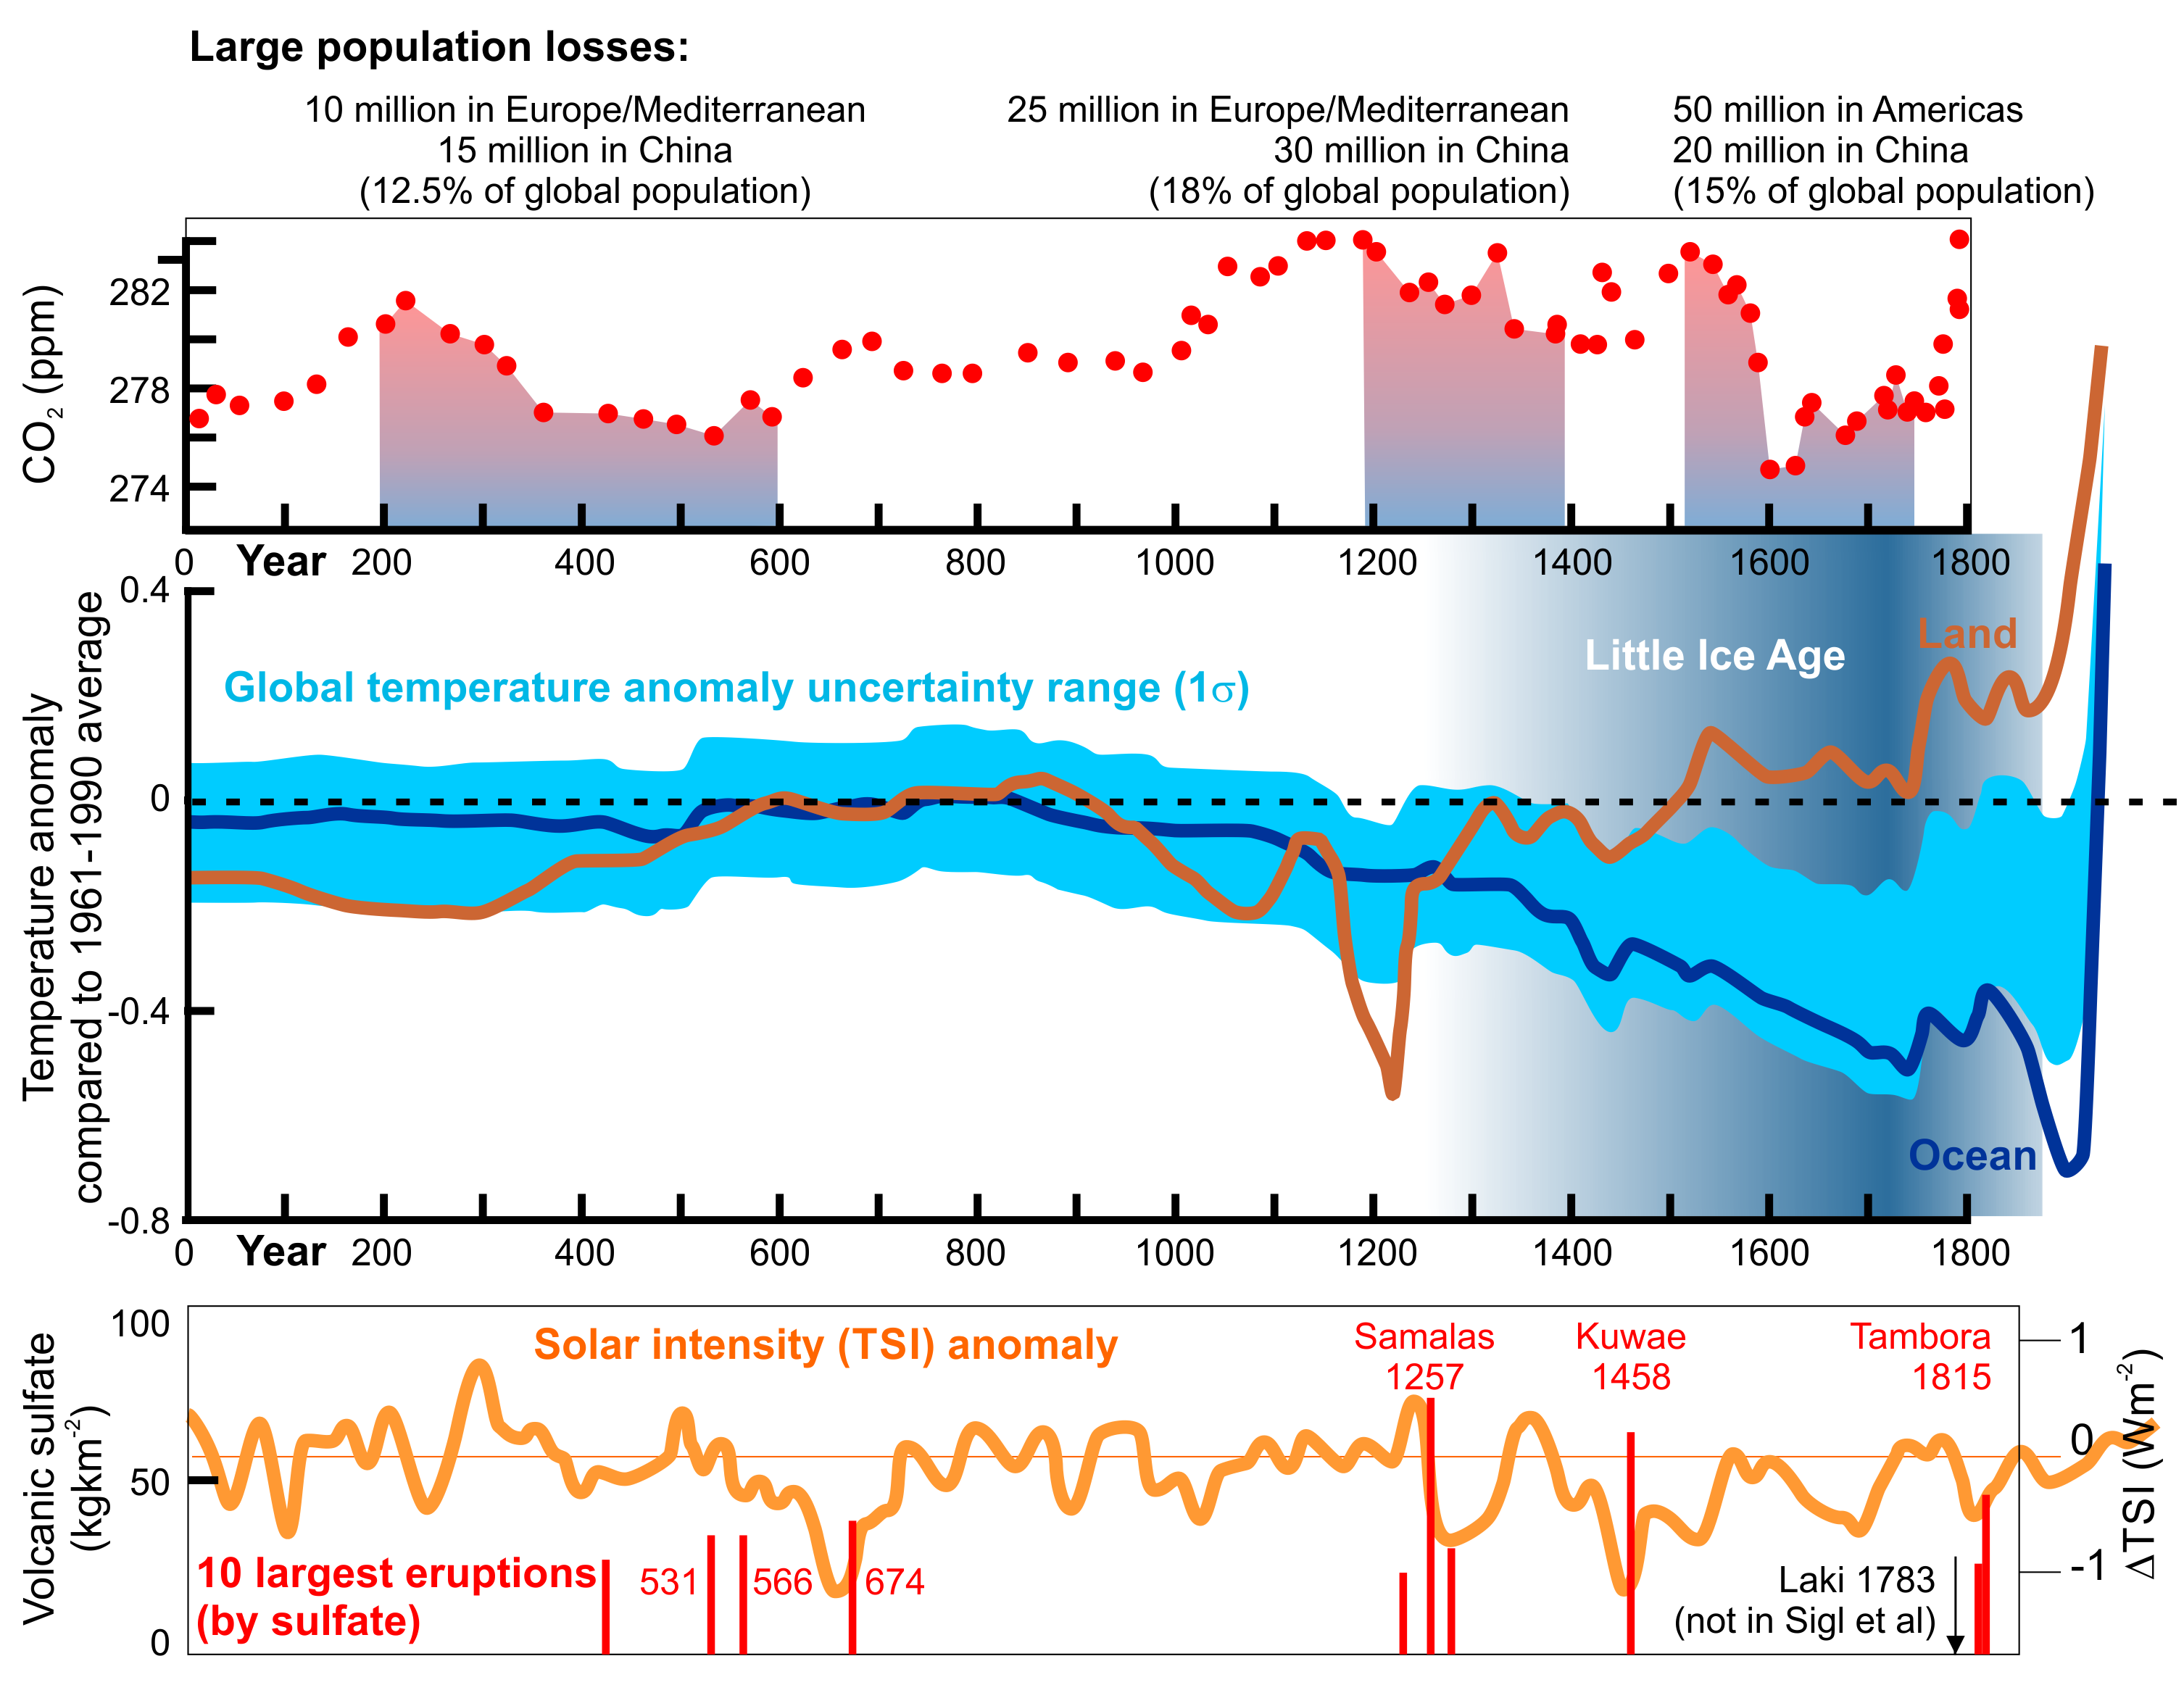
These episodes of abandonment and reforestation are reflected by reductions in CO2 levels recorded in ice cores.

Population decreases and CO2 decreases recorded in ice cores from the Law Dome over the last 2000 years alongside global temperatures, Total Solar Irradiance, and major volcanic eruptions. Population and CO2 redrawn from Ruddiman 2014 "Earth Transformed" figure E-6 (W H Freeman), Temperature anomaly redrawn from Marcott et al 2013 figure S11(c), Volcanic sulfate redrawn from Sigl et al 2013, TSI redrawn from Steinhilber et al 2009 (0=1986 (1365.57 Wm−2)).
Calculations of the American population collapse suggest that about 37 billion tons of carbon was captured and sequestered from the atmosphere at that time. This is a staggering quantity of CO2 drawdown over such a short time, and likely contributed to the cooling of the Little Ice Age (see the figure above).
Industrial Warming Crecendo
Pre-industrial human influence kept the climate warmer than it would otherwise have been, insulating us and delaying the normal slide back into the next ice age that had happened at the tail end of all the prior interglacial periods. But although their effect was diminished, natural orbital changes did not relinquish overall control on our climate, which carried on cooling over the last 6,000 years despite pre-industrial emissions. When CO2 levels were reduced by the American population collapse, our climate flirted with glacial conditions in the Little Ice Age.
But everything changed in the industrial era, when humans finally snatched control of the climate away from the natural, orbitally-driven cycles that had governed the climate and punctuated our evolution and dispersal throughout the last several million years.
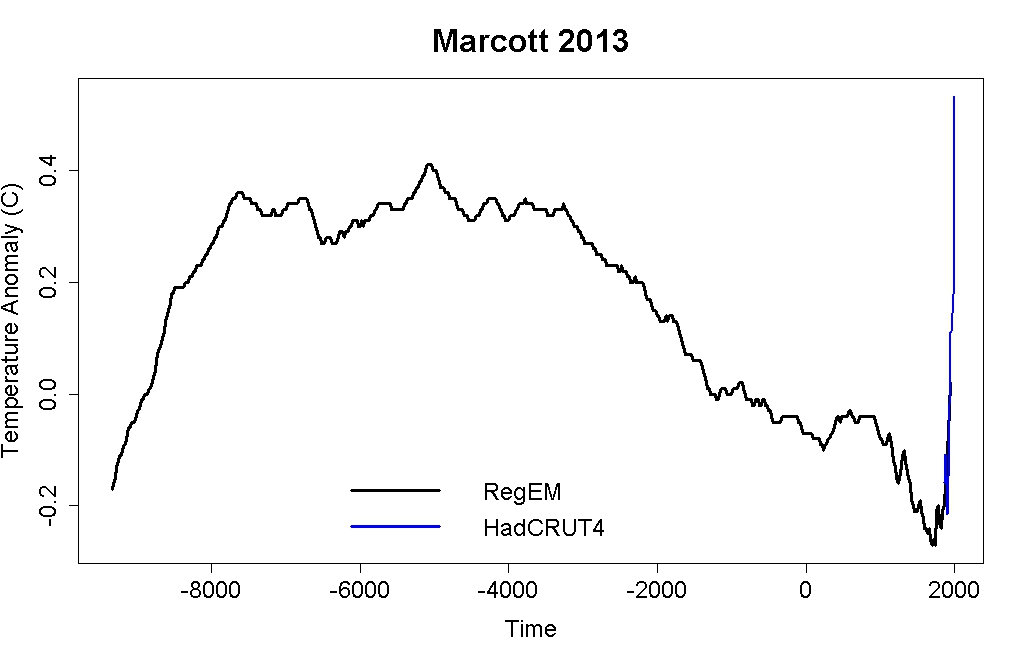
In just the last century or two, 6,000 years of orbitally-driven cooling temperatures have been entirely reversed! (see the graph below). That's because greenhouse gasses are now 68% more abundant in the atmosphere than they were in 1750, and the trend is sharply higher still, to levels and temperatures not seen since long before the evolution of our first fire-making ancestor, Homo erectus.

Temperature reconstruction for the last 11,300 years by Marcott et al, plus recent temperatures (HadCRUT4) Created by Tamino.
Continued debate
It's fair to say that the Early Anthropocene Hypothesis hasn't yet gained universal acceptance (as the IPCC AR5 highlights). Some of the debate has centered on the relative contribution of natural versus human-caused contributions to pre-industrial climate. Some of the debate has suggested that the MIS 11 interglacial shows a similar late uptick in greenhouse gas levels depending on the method of comparing the timing of different interglacials. But Ruddiman et al gave a detailed defense of their methods in 2011, and an expanded treatment of alternative explanations for the data can be found in Ruddiman's book: "Earth Transformed." Over the past 14 years the theory has garnered support from longer ice core records, expanded archaeological evidence, and improved estimates of population and land cover.
Further reading
Bill Ruddiman's 2014 book: "Earth Transformed" (published by W.H. Freeman) is a fascinating, readable, and well-reasoned examination of the topic for those who want to delve into more detail than space here allows. Even though the book was written for undergraduates, its use of plain English makes it an easy read for a general audience too.
The book is the source for all content in this post not otherwise attributed.
I'd like to thank Andy Skuce and John Mashey for helpful comments and suggestions


 Arguments


Plows, Plagues and Petroleum by William Ruddiman is an earlier version of his work, and it is worth searching for some of his Scientific American articles (at least one!) on Google.
I am sure the above book supplants his earlier work, but it is still pricey, and P, P & P is available on Kindle.
Well, we've learned one thing: How to kill a vibrant planet in just a few decades.
"about 37 billion tons of carbon was captured and sequestered from the atmosphere at that time"
Isn't that about what we emitted last year...in one year?
This is a fascinating essay. Thanks! I have one correction to make, however. The sentence, "That methane is gradually oxidized to CO2 at rates of about 540 million tonnes per year", is misleading. The rate of methane oxidation is proportional to the concentration of methane and is best expressed in terms of methane molecular half-life in the atmosphere (about 12 years, I believe) rather than in tonnes of atmospheric methane oxidized per year. The figure you quote comes from a discussion of current atmospheric methane levels, which are more than twice those shown in the ice core measurements for the current interglacial (third figure in the essay). Consequently, the figure you quote is probably more than twice the rate at which methane oxidation was occurring during the pre-industrial era.
Joel - I stand corrected! Thanks for pointing that out.
shoyemore: yes, P, P & P is cheaper and people will get the idea, but the new book is more than a supplement, as a lot of research has happened over the last decade, and I think many issues have been resolved pretty well. People might also try Bill's Tyndall Lecture @ AGU2013
https://www.youtube.com/watch?v=1TOTsmqgmL8
Given the sweeping conclusions he comes to based on his 10,000 years of global mean temperature anomalies which apparently only range over barely 1/2 degree it would be nice to know where / how the proxy data came from . And that final dramatic up spike is a bit hard to swallow as it represents a what ? 25 year period on a graph representing 10,000 years . Most of this doesn't pass the smell test IMHO , but it is highly entertaining .
[Rob P] - Personal incredulity is a logical fallacy. No more please. If you have anything interesting to say from a scientific point of view then do so.
So it seems that we have to reduce atmospheric Carbon dioxide, say to around 250ppm but not let it fall much below that. A new ice age would be as destructive as what we seem to be heading toward now.
Although not entirely convinced, I always have a lot of time for Ruddiman's theory as buring down a forest is quite a simple task, something that is occasionally demonstrated today by misguided children equiped with a box of matches. Also the effect of a small human population in diminishing populations of large herbivore could have very large follow-on effects in vegetation levels. So the ability of quite small populations to have a significant impact did exist.
One point I feel the post is a little too vague on is the differences between slash-&-burn and sedentary agriculture. The first difference is that the former is not concerned about trashing its environment, burning down a forest for a couple of crops of cereals. The latter would never do that. The second difference is that it was the rise of sedentary agriculture as we understand it today that allowed the dramatic rise in population. The post says:-
There is a time of transition when populations decided that sticking around to looking after a field of food crop was better than scattering a few seeds over a hillside and leaving them to grow while you packed up to go hunting wild goats or whatever. This transition is seemingly associated with irrigation which soon allowed a massive rise in population. It was the massive population that made "people ... dependent on agriculture for their food" and with time, the spread of that sedentary agriculture to rain-watered lands added yet more to population who slowly de-forested the land the hard way.
Posthocpropterhoc @7.
The origin of the proxy data is referenced in the caption of the figure your ask about. It is even titled "Marcott 2013" although it should properly be Marcott et al. (2013) as Marcott had three co-authors. The full paper is available here.
Concerning the graphical representation itself, the period you describe as "...it represents a what ? 25 year period on a graph representing 10,000 years" scales at either 100 years long (to the lowest point on of the HadCRUT4 data) or 270 years (to the lowest point on the Marcott proxy data). You are way off with 25 years.
I'm always myself amused by pseudonyms deriving from Latin. Without the "ergo", doesn't the meaning of "Post hoc, propter hoc" translate to something like 'learn from past events'?
william @8, 250 ppmv would correspond to temperatures similar to those in the LIA, and would definitely be disadvantageous compared to current levels. Nor is it automatically true, or even particularly probable that the pre-industrial level of 280 ppmv corresponds to the ideal average temperature conditions across the globe. To the extent that there is such an ideal condition, it probably lies somewhere between 280 and 360 ppmv (given current solar activity and relative position in the milankovich cycle). More important than the exact level, however, is the rate of change which should be kept low.
william @8, in addition to Tom's comments about rate of change, it should be noted that "a new ice age" due to low atmospheric CO2 levels is off the table unless we develop some technology which rapidly decreases the CO2 content of the atmosphere and then use it to excess. Take a look at natural CO2 shifts over the past few million years;
Repeatedly, CO2 spikes up ~100 ppm over the course of 10 to 20 thousand years and then slowly declines back down ~100 ppm over a period of 90 thousand years or so. We've taken the atmospheric CO2 level from ~280 ppm to ~400 ppm over the course of the last 150 years or so. That 120 ppm increase, let alone however much further we drive it up before we get emissions under control, will take tens of thousands of years to reverse naturally. If we could somehow stop fossil fuel emissions today we'd be getting back to ~280 ppm right around the time the next 'interglacial' warming period / CO2 increase was set to start.
Human technology and society today is radically different from that of a thousand years ago. What human technology and society will be like more than 100,000 years in the future is inconceivable. Ergo, we can pretty much ignore the idea of 'the next ice age' (i.e. glaciation). If it ever happens it will be in a world so different from our own that we would have no basis on which to plan contingencies.