Making Arctic Sea Ice Loss Real
Posted on 24 December 2011 by Daniel Bailey
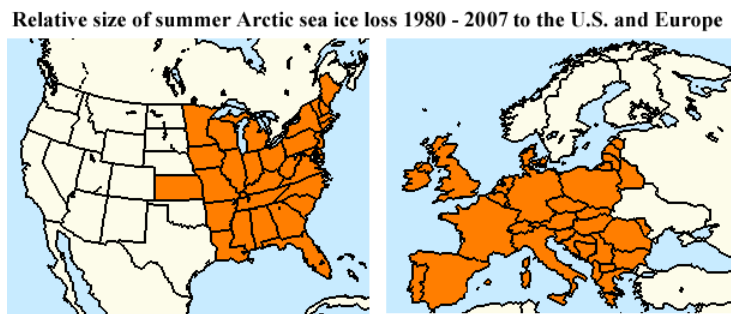
It is said that a picture can tell a story that a thousand words can't. When it comes to the ongoing demise of Arctic Sea Ice, the ice-loss numbers have gotten quite large. Here's a graphic taken from Dr. Jeff Masters' Wunder Blog, that quite elegantly puts the big numbers into visual context:
The extent of Arctic sea ice loss in the summer July - August - September period in 2007 was about 1.4 million square miles (3.6 million square kilometers) greater than in 1980, according to the University of Illinois Cryosphere Today. For comparison, the lost ice coverage (orange colors) was equal to an area about 44% of the size of the contiguous U.S., or 71% of the non-Russian portion of Europe. Image reproduced courtesy of Wunderground.com and the University of Illinois Cryosphere Today.


 Arguments


@ Doug H The mass loss is indeed dramatic. Being volumetric (non-existing in 3-dimensions), it is more difficult to make that volume loss relational. Here are 3 attempts:
Note that this final graphic reveals that Arctic sea ice volume has declined in every month of the year, not just the summer minimums.