Climate Science Glossary

Term Lookup

Enter a term in the search box to find its definition.

Settings

Use the controls in the far right panel to increase or decrease the number of terms automatically displayed (or to completely turn that feature off).

Term Lookup

Settings


All IPCC definitions taken from Climate Change 2007: The Physical Science Basis. Working Group I Contribution to the Fourth Assessment Report of the Intergovernmental Panel on Climate Change, Annex I, Glossary, pp. 941-954. Cambridge University Press.

Home Arguments Software Resources Comments The Consensus Project Translations About Support

Bluesky Facebook LinkedIn Mastodon MeWe

Twitter YouTube RSS Posts RSS Comments Email Subscribe


Climate's changed before
It's the sun
It's not bad
There is no consensus
It's cooling
Models are unreliable
Temp record is unreliable
Animals and plants can adapt
It hasn't warmed since 1998
Antarctica is gaining ice
View All Arguments...


Username
Password
New? Register here
Forgot your password?

Latest Posts

Archives

The correlation between CO2 and temperature

Posted on 4 June 2009 by John Cook

This week, Australian TV channel ABC aired an interview with Australian senator Steve Fielding. The senator is studying both sides of the debate and genuinely seems to be struggling with the question of whether man is causing global warming. He found particularly persuasive the argument that in recent years, global temperatures have been falling while CO2 has been rising.
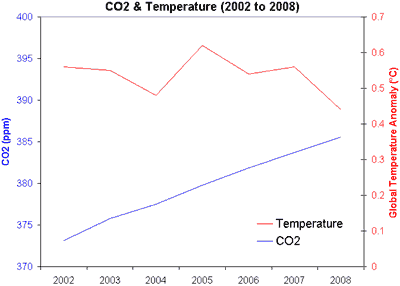

Figure 1: Atmospheric CO2 (parts per million, NOAA) and Global Temperature Anomaly (°C GISS) from 2002 to 2008.

Temperature shows a slight cooling trend while CO2 has been rising steadily. If CO2 causes warming, shouldn't temperature be rising steadily also? However, if we look at the temperature record over the past several decades, we see that even in a long term warming trend, there are short periods of cooling.
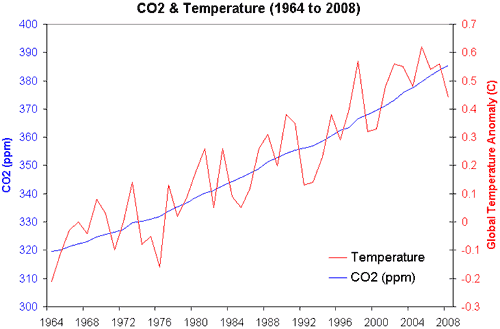

Figure 2: Atmospheric CO2 (parts per million, NOAA) and Global Temperature Anomaly (°C
GISS) from 1964 to 2008.

When looking at short periods (eg - less than a decade), climate shows strong variability. Consequently, it's possible to select short periods throughout the long term warming trend where the warming slows or stops. For example, the periods 1977 to 1985 and 1981 to 1989 both show little to no warming while CO2 continues to increase. One might've made the conclusion in 1985 or 1989 that global warming had stopped based on the previous few years data.
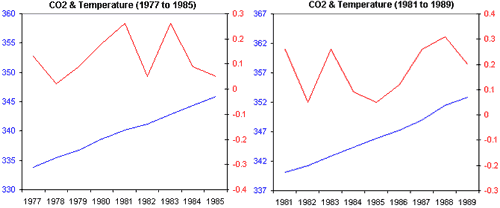

Figure 2: Atmospheric CO2 (parts per million, NOAA) and Global Temperature Anomaly (°C GISS) from 1977 to 1985 and 1981 to 1989.

What causes this climate variability?  In our last post on ocean heat, we looked at ocean cycles, the most dominant being the El Niño Southern Oscillation. The Pacific Ocean is now in a strong La Niña phase, leading to unusually cool temperatures throughout the tropical Pacific Ocean. Additionally, the sun is currently in solar minimum. Solar activity has an 11 year cycle which is estimated to have an effect of around 0.1°C on global temperatures. The combination of solar minimum and La Niña would have a short term cooling effect on global temperatures.

This example demonstrates the error of drawing conclusions from one small piece of the puzzle without viewing the broader picture. If one focuses on just the last few years, one might erroneously conclude global warming has stopped. However, by looking at a longer data series, we see a climate that shows much short term variability. By understanding some of the mechanisms that cause climate variability, we can see that the current cooling is short term variation imposed on the long term warming trend.

Note: in our next post, we broaden the picture even further, comparing CO2 and temperature back to 1880.

0 0

Printable Version  |  Link to this page

Comments

Comments 1 to 29:

  1. Hmmm how many of the dips are caused by volcanoes? There have been no volcanoes to explain the current dip. Maybe you should check the discussion at The Blackboard http://rankexploits.com/musings/2009/how-to-obfuscate-forget-to-mention-volcanoes/
    0 0
    Response: Good question. Here's a plot of temperature versus stratospheric optical depth which is a good indicator of volcanic activity (unfortunately the optical depth data ends in 1999 - if anyone can track down more up-to-date data, please post a link):


    Just eyeballing the graph, I've lightened the periods on the temperature time series that roughly match with volcanic eruptions. What you find remaining is still a noisy time series where temperature drops for short periods even during the warming trend. While I explain above what are two major influences in current cooling (La Nina, solar minimum), the post on short term changes in ocean heat goes into more detail on what can cause cooling in the absence of volcanic activity.
  2. Which raises the question:- just how long a time period is truly indicative of any 'trend'. The last 11,000 years would show a warming trend; but the paleorecord over the last 5 million years shows a cooling trend. Which is 'right'? 10 years is not enough to determine weather (sorry!)the 'warming' has stopped.....and equally I suggest 30 or even 100yrs ( less than 1% of the time since the beginning of the holocene) is enough either. As has been demonstrated on this and other sites, carefully picking the time period seriously affects the outcome.
    0 0
  3. About the graph: Should there not be a time delay between a change in OD and temp? How would you explain the effect of large shifts in OD producing a varied response in Temp...the change in 1993 correlates to a single large T drop but in 1983 T falls and rises and falls and rises despite OD showing a single peak. A similar effect is apparent in 1970.
    0 0
  4. Andrew: You are correct that we should not ignore possible other factors, but in the two examples John shows above (1977 and 1981) I am only aware of one possible significant volcano ( El Chicon in 1982). Now, as far as climate changing volcanoes goes, El Chicon was not a very large one. IIRC it injected about 6.5 megatons of SO2 into the stratosphere (Mt. Pintaubo injected about 17). It does not appear to cause much change and if John had nothing better to do he could plot the time 1977 to 1982 to see what it looks like. In regards to his 1982 series, if anything that should suppress the early part which would cause an apparent increase in the latter part. So it would bias a warm trend on that particular time frame so if anything it strengthens his point that there exist cooling trends. Regards, John
    0 0
  5. John: Just to emphasize my point to Andrew, since El Chicon (the 1982 volcano) takes place early in your second series (1981 to 1989) it would actually cause a cooler reading than you would expect in the early part of your data which is not there in the latter part. So in fact it would tend to bias the result warm. Best, John
    0 0
  6. Opps, of course it should be El Chichon. At least I am consistent in my errors. John
    0 0
  7. Another problem for the senator is probably the use of graphs scaled by others, such as the ones you show. The increase in CO2 from 2002-2008 looks like a lot when the y-axis is 370-400 ppm, but the increase is about 12 ppm. That's an increase of about 3% or less than 1% per year. It's not the increase in any particular year that's having an effect so much as the accumulation over time. It took an increase of about 20-25% over pre-industrial (and a lot of time, as this post points out) before the signal started to really stand out from the noise. From this perspective, the lack of signal from 2002-2008 of a 3% increase in atmospheric CO2 in Figure 1 doesn't impress. I have no refs from attribution studies for my comments -- just common sense and the figures above. Hopefully common sense isn't misleading here.
    0 0
  8. Prehaps this chart can help http://globalwarmingquestions.googlepages.com/trendvolc.jpg Since 1960 there have been 5 cooling periods the first 4 followed volcanoes -- the last (this century) doesn't. So what is the mechanism? If it is just noise then we can test statisitically -- is the noise greater than we would expect from previous data or not. When we do the simple CO2 v temp or the more complex IPCC multi-model mean v temp or even the very simple 2 deg/century v temp all currently fail at 95% confidence. So if it is not noise and not volcanoes what is it? BTW it's not solar cycle as Gavin Schimdt said in 2005 at Real Climate (and since not recanted) that even a variation of 0.1 deg C per solar cycle is an over estimate.
    0 0
    Response: There's not one single driver of climate so I don't think it's a case of looking for a single smoking gun. Two contributors to the current cooling phase would be the solar minimum (whether it be 0.1C cycle or slightly less) and the strong La Nina conditions in the Pacific Ocean. I explore this further on the global cooling page. If you're interested in the physical mechanism by which La Nina cools global temperatures, I recommend reading the previous post on what causes short term changes in ocean heat.
  9. Andrew K. I don't follow your logic. When you say that 4 cooling periods follow volcanoes, you imply that they are caused by volcanoes. For a cooling period of say 8 years to be caused by volcanoes, we would need the cooling to be somewhat minimal at the early stage and then increase towards the end. Keep in mind to cause a cooling period you need to suppress the end of the period more than the start. From what I understand about a volcano the SO2 has a residency time of about 2 years in the stratosphere. So from what I see a volcano at the start of a cooling period would actually tend to mask a natural cooling trend. Do you see something wrong with that logic? Regards, John
    0 0
  10. This is stating the obvious possibly, but it’s worth supplementing the top article with a more explicit explanation of why we don’t expect to observe a correlation between CO2 (levels) and (surface) temperature in the short term. If we take the middle of the range of climate sensitivities consistent with empirical evidence, of around 3 oC of surface warming for each doubling of atmospheric CO2 concentration, it’s straightforward to calculate the change in surface temperature at equilibrium resulting from the yearly increase in CO2. This is about 0.023 oC for current rates of increase of CO2 (e.g. 382 ppm to 384 ppm). Does this mean that the Earth’s temperature should rise by 0.023 oC each year? Obviously no, for two reasons: (i) this is the temperature rise at equilibrium. In fact the current temperature rises are occurring largely in response to the raised CO2 levels of the previous decades. If the atmospheric CO2 levels were to drop by 2 ppm per year during the next 5 years or rise by 2 ppm per year during the next 5 years, the effects on surface temperature wouldn’t be expected to be very different. In each case the temperature progression will be a response to a raised radiative forcing arising from enhanced [CO2] near 385 (+/- 10) ppm. There is no expectation of a correlation between changes in [CO2] and changes in surface temperature on this sort of timescale. (ii) The dominant contributions to year on year variations in surface temperature are intrinsic variations in the climate system. The effects of El Nino’s, La Nina’s, the solar cycle, volcanoes etc. can result in year on year changes of up to around 0.2 oC. Obviously these effects are likely to outweigh the small contribution from enhanced [CO2] forcing. Since the internal variations are expected to result in “noise” while the contribution to the surface temperature from raised [CO2] are persistent, the latter should rise out of the noise as a trend on the longer term. A temperature rise of the order of 0.2 oC per decade with internal variation of the order of 0.1-0.2 oC per year, should be apparent as a trend averaged on the decadal time scale. (iii) If [CO2] rises result in raised surface temperature, where should we observe correlations? We should expect to observe good correlations between the atmospheric [CO2] and the equilibrium surface temperature. This is apparent in the paleorecords sampled throughout the last 500 million years. If we have a good handle on the timescales of the surface temperature response to enhanced radiative forcing (i.e. the progression of the surface temperature to raised CO2 levels that result from the various inertial elements of the climate system), we should expect to observe a good relationship between the observed temporal progression of the surface temperature and modelled temperature, as long as we recognise that the stochastic variations will result in unpredictable (and therefore non-reproducible in forecast) “noise”.
    0 0
  11. If CO2 is such a trace gas, currently 380 PPM of the atmosphere, someone needs to tell me, an inquiring layperson, how an incremental increase in that amount can possibly have much affect on temperature increase. It doesn't make much sense, to me, and, though I've asked numerous times elsewhere, no one seems to be able to explain it to me. I was referred to this website by someone I was disagreeing with about AGW. A site to debunk the debunkers? Those skeptics must certainly be gaining some ground. Many AGW "alarmists" seem to think "the debate is over." Seems to me, it would be very hard to do further unbiased research if that's the attitude taken by these (I believe misguided) followers of King Albert of Gore. Sorry; I just call it like I see it.
    0 0
  12. JWC: just because something is trace does not mean that it has a small effect. The lethal dose of botulism is about 5 parts per billion. Now, if you are asking about the actual physics of the interaction of longwave radiation with the CO2 molecule, that is a different question - but one I am sure we could look at if you wish. Regards, John
    0 0
  13. JWC: This analogy may help - The mass of the sunscreen that you need to smeer on your arm to stop almost all the UV light getting through is tiny compared to the mass of the atmosphere sitting above you which failed to stop it (there are about ten metric tons of atmosphere per square meter of surface I think). A trace amount of a substance can have a big effect if that substance is very effective at what it does. The amount of cyanide that it would take to kill you vs. the total volume of air that you breath is another example.
    0 0
  14. Now, if we can just get that sunscreen up into the upper atmosphere....
    0 0
  15. JWC, This paper may answer some of your questions regarding the relative effect of increasing CO2 concentrations on global temperatures. http://brneurosci.org/co2.html
    0 0
  16. HealthySkeptic: Thanks for the link. I will note that the article (I don't believe it is a paper) is interesting but misses a couple of important points. As simple physics shows, even if the CO2 bands were totally saturated, adding more would still cause an increase in temperature. In addition, when the author calculates his projection he assumes that all warming takes place instantaneously. This is of course not true - warming takes place over numerous time scales. I assume that when he says that if we stop emitting CO2 the level would "instantly return to pre-industrial levels." it is just a typo and was not what he intended to say. So, by all means read it, but as with everything, read it with a skeptic's eye. Regards, John
    0 0
  17. John Cross -- I suppose my point is purely emperical. The current non-warming is explained away as the result of recent weather noise masking the long term warming trend, but a statistical test using for example the d* method of Santer (which using data up to the end of 2007 proved the above explaination) now shows that the lack or warming is more than expected from known (ie previously observed) weather noise. To counter this statistical failure it has been pointed out that there have been decade or so long non-warming (or even cooling) periods within the long term warming trend as shown in Figure 2 above, but previous non-warming (or cooling) periods have followed large volcanoes whilst the current period doesn't. In summary the current period cannot be explained away either as statistical noise or as a simple occurance of known natural events that will soon reverse. So what is causing the non-warming when 'all the consesus science' says there should be (note: some are now claiming it is the sun although a few years ago we were told that solar changes and effects were all known and included in the models)? Either the measurements are wrong or there is a problem with 'the consesus science'
    0 0
  18. re #16 John, With regard to saturation of the CO2 bands, do we know what percentage of energy, in the wavelengths that CO2 can absorb, is already being absorbed? I have seen figures as high as 99%. Some have even quoted that satellites equipped with infrared spectrometers have confirmed that there is already little or no infrared energy from the earth's surface escaping the earth's atmosphere in the CO2 absorption bands. Do any of these claims have any substance? If not, do we know at what atmospheric CO2 concentration the CO2 bands WILL become completely saturated? Regards, HS.
    0 0
  19. re #16 >> I assume that when he says that if we stop emitting CO2 the level would "instantly return to pre-industrial levels." it is just a typo and was not what he intended to say. John, I queried the author personally on this and this is his response'- "Instantly on a climatological scale would be a few years or decades at most. It would depend on the half-life of CO2 in the atmosphere, which is a disputed topic. Many processes, including photosynthesis and dissolution into bodies of water, act to reduce CO2." HS.
    0 0
  20. re #19 Unsupported assertions on dodgy web sites are rarely helpful HS and you've again dumped several on this thread. The author of the web page you linked to is hugely misinformed about several things, including this in reference to the lifetime of enhanced atmospheric CO2 levels:
    "Instantly on a climatological scale would be a few years or decades at most. It would depend on the half-life of CO2 in the atmosphere, which is a disputed topic. Many processes, including photosynthesis and dissolution into bodies of water, act to reduce CO2."
    However the evidence is pretty clear on the expectation that greatly raised atmospheric CO2 levels remain raised by a very long time indeed (100’s to 1000’s of years, with a long tail lasting 10’s of 1000’s of years and more). Some of the evidence for this is given below. It’s worth pointing out that the odd notion that “photosynthesis” will “act to reduce CO2” is a meaningless statement, especially without consideration of timescales and mechanisms. In the real world photosynthesis has very little effect on nett atmospheric CO2 levels since draw down of atmospheric CO2 by photosynthesis is largely balanced by oxidative organic decay and the return of CO2 to the atmosphere. There is only so much scope for enhanced nett primary production of flora (and the sequestration of CO2 by plant fossilation only occurs on the hundreds of thousands to million years timescale). Unfortunately the situation is worsened in our current world with rainforest degradation and the expectation that primary production (nett plant growth) will decrease in a warming world. Some of these points are discussed here http://www.skepticalscience.com/Is-Antarctic-ice-melting-or-growing.html (see posts #13/14). Likewise the rate at which oceans sequester enhanced levels of atmospheric CO2 is slow (100’s of years timescale) [1]. Additionally the ability of the oceans to absorb is reduced as enhanced atmospheric CO2 “drives” CO2 into the oceans, and already the evidence indicates that the expected tendency for the upper oceans to saturate with respect to CO2 uptake is already occurring [2,3]. A review of some of the evidence that informs our understanding of the lifetime of enhanced atmospheric CO2 was published late last year [1], and indicates that sequestering of CO2 occurs on multiple timescales, the most rapid of which (ocean uptake) takes many hundreds of years, with very long tails of recovery lasting 1000’s and 10’s of 1000’s of years. This is consistent with evidence from analysis of carbonates in sediments that are used to determine CO2 levels in the deep past, that indicate that the massive increases in atmospheric CO2 associated with extinctions at the Triassic-Jurassic boundary [4,6] or the Paleo-Eocene Thermal Maximum [5,6] (for example) take many 10’s of 1000’s of years to return to pre-extinction event levels. I haven’t spent very much time looking up this stuff, and no doubt one could come up with more and better examples of the evidence that informs our understanding of the lifetimes of greatly enhanced CO2 levels. [1] Archer D and Brovkin V (2008) The millennial atmospheric lifetime of anthropogenic CO2 Climatic Change 90, 283-297 Abstract: The notion is pervasive in the climate science community and in the public at large that the climate impacts of fossil fuel CO2 release will only persist for a few centuries. This conclusion has no basis in theory or models of the atmosphere/ocean carbon cycle, which we review here. The largest fraction of the CO2 recovery will take place on time scales of centuries, as CO2 invades the ocean, but a significant fraction of the fossil fuel CO2, ranging in published models in the literature from 20-60%, remains airborne for a thousand years or longer. Ultimate recovery takes place on time scales of hundreds of thousands of years, a geologic longevity typically associated in public perceptions with nuclear waste. The glacial/interglacial climate cycles demonstrate that ice sheets and sea level respond dramatically to millennial-timescale changes in climate forcing. There are also potential positive feedbacks in the carbon cycle, including methane hydrates in the ocean, and peat frozen in permafrost, that are most sensitive to the long tail of the fossil fuel CO2 in the atmosphere. [2] Le Quere C et al (2007) "Saturation of the Southern Ocean CO2 sink due to recent climate change" Science 316, 1735-1738. [3] Schuster U et al (2007) “A variable and decreasing sink for atmospheric CO2 in the North Atlantic” J. Geophys. Res. Oceans 112, art # C11006 [4] B. van de Schootbrugge et al (2008) Carbon cycle perturbation and stabilization in the wake of the Triassic-Jurassic boundary mass-extinction event Geochem. Geophys. Geosys. 9 Q04028 [5] G. R. Dickens et al. (1997) A blast of gas in the latest Paleocene: Simulating first-order effects of massive dissociation of oceanic methane hydrate Geology 25, 259-262. [6] A. S. Cohen et al. (2007) The Late Palaeocene–Early Eocene and Toarcian (Early Jurassic) carbon isotope excursions: a comparison of their time scales, associated environmental changes, causes and consequences J. Geological Soc.164, 1093-1108
    0 0
  21. For Andrew K, I think you've ignored what John Cross wrote about the length of time that volcanoes have a strong effect on temperatures. But for me there is a statistical point that is more important -- you can't perform a frequentist statistical analysis every time you get a little more data. Doing so invalidates the accepted Type I error. If you flip a coin 100 times and THEN look to find out whether you have rejected the null hypothesis' expectation of 50:50, that is a valid test at some arbitrarily accepted Type I error rate (typically 5%, or 1 out of 20). If you decide to flip a coin up to 100 times and perform the same test after each flip with the intent of stopping and reporting a significant value when you reach it, you are inflating the Type I error because you are making no correction for the number of tests you are performing: "one out of 20" is no longer fair because you have increased the number of tests.
    0 0
  22. Re #20 chris said;- "Unsupported assertions on dodgy web sites are rarely helpful HS and you've again dumped several on this thread." I think you need glasses, chris (and perhaps a valium as well). So far I have provided only ONE link to a website in this thread. (One that John Cross graciously thanked me for.) I would prefer answers to the questions I posted rather than the condescending platitudes and the mass of references to vaguely relevant papers and articles that you dish out time and time again. In future, if you can't respond to me civily, please don't respond at all. HS.
    0 0
  23. HS,there was nothing uncivil in what Chris said. He was merely pointing out what you do. The same can't be said about your response. In the future, if you're so thin skinned that you can't handle legitimate criticism, maybe you shouldn't comment at all.
    0 0
  24. Lee, I'm sure Chris doesn't need your help in defending himself. However, just for your edification, there was nothing "legitimate" in Chris' snide criticism. In particular, I took offense at his claim that I had "dumped" several links to "dodgy web sites " in this thread. Not only did I consider his manner in stating it to be uncivil, it was a demonstrably false accusation. A fact you have conveniently overlooked. All I expect here are courteous answers to my questions. Is that too much to ask for?
    0 0
  25. re #22 1. “Unsupported assertions on dodgy web sites are rarely helpful HS and you've again dumped several on this thread.” The noun is “unsupported assertions” HS. That’s what you’ve dumped several of. 2. The point is that the unsupported assertions you dumped (about the instantaneous nature of recovery of enhanced atmospheric CO2; about the role of photosynthesis in reducing enhanced CO2 levels; about the role of the oceans in reducing enhanced atmospheric CO2 levels) are either grossly incorrect, or meaningless without some real world context (see my post #20 for why). 3. “Vaguely relevant papers and articles”? You and your misinformed website chum are attempting to pursue some fallacies about the lifetime of enhanced CO2 levels (using unsupported assertions). If we want to know what the scientific evidence actually indicates we have to look at the science, wouldn’t you say? There is a recent review [ref #1 of my post #20] that addresses exactly the point under consideration. The article is a review of scientific analysis of the lifetime of enhanced atmospheric CO2 levels. How can that not be entirely relevant to a discussion of the lifetime of enhanced atmospheric CO2 levels, HS? I hope you’re not suggesting that the science isn’t relevant (or only “vaguely relevant”!), and that we should ignore this and form our world views from unsupported assertions on dodgy web sites. Likewise if we are considering the true lifetimes of enhanced atmospheric CO2 levels, it’s relevant to look at examples of studies in which the lifetimes of enhanced atmospheric CO2 levels in the past are directly assessed through analysis of carbonates in cores at times following tectonic events that greatly raise atmospheric CO2 levels. I gave some examples [refs #4, #5 and #6] in my post #20. And if we are considering the role of the oceans in taking up enhanced CO2 it makes sense to look at some of the science in which his point is specifically addressed [refs. #2 and #3 in my post #20]. Why not supplement your unsupported assertion that these are “vaguely relevant papers and articles” with some explanation of why you consider them to be “vaguely relevant”? That would be quite an interesting starting point for discussion….
    0 0
  26. jeesh HS, you're engaging in a bout of contrived indignation based firstly on a misreading of a sentence, and now (your post #24), on a misrepresentation. Please try to be more careful with your reading. I said: "Unsupported assertions on dodgy web sites are rarely helpful HS and you've again dumped several on this thread." The noun is "unsupported assertions", of which you dumped several. Now you're suggesting that my sentence can be taken to mean that I "claim that (you) had "dumped" several links to "dodgy web sites " in this thread" . That's a weird misrepresentation HS, and any "offense" you've contrived is an "offense" to your own misrepresentation. Let's get back to the science. Your web site chap asserts that raised CO2 levels are reduced to pre-industrial levels "instantly", "instantly" being "a few years or decades at most". That's clearly at odds with the scientific evidence that bears on that point, as I described in my post #20 above. It's an extraordinarily ignorant assertion and one wonders why someone who goes to the trouble to construct a web page on this subject would be so ill-informed of the science. It’s a particularly weird misrepresentation when one examines the reference that your web site chap uses to “justify” his assertion (he does this in a “comment added 1/5/2008”), viz:
    To clarify, this means that if we were to stop emitting carbon dioxide, the CO2 levels in the atmosphere would rapidly return to pre-industrial levels. Geologists tell us that the half-life of CO2 in the atmosphere is on the order of five to ten years [23].
    However if one reads ref [23](***), one finds that they conclude “Decline of CO2 levels in the atmosphere will take centuries because of the slow turnover of the deep sea.” HS, how can an old report that concludes that decline of CO2 levels will take centuries, be used to justify an assertion that the decline will be “almost instantaneous” (“a few years or decades at most”)? ***[23]. National Academy of Sciences, Climate Research Board (1979). Carbon dioxide and climate: a scientific assessment. National Academy of Sciences, 72pp.; cited in Ref. 1, p. 434.
    0 0
  27. I would like to see a graph of CO2 vs Hadley Data Centre's temperature measurements (HadCRUT, HadCRUT3, maybe HadAT etc). Does anyone know where I can find one?
    0 0
  28. #27...try this... http://chartsgraphs.wordpress.com/2009/08/13/excel-chart-misrepresents-co2-temperature-relationship/
    0 0
  29. I can see your argument about the dips being about a trend but I still have several concerns with the data. As you mentioned you can not look at just a small piece. The same argument also holds for the pro global warming argument. You can't just look at the last century. You need to put the current temperature profile into the context of the whole of the Quaternary. Believe me doing so is non trivial. The issue I have is the unusual "flat spot" if you want to call it that of the last 10,000 years. Historically as you would know the Holocene we are in is an extremely unusual interglacial in the middle of the Quaternary glacial period. The argument is that the reason humans were able to develop civilization in the first place is because of this unusual warm flat temperature range. Simply put we got lucky. We evolved for far tougher conditions and the nice comfortable range of the current interglacial meant that humans were able to spend less time just surviving and more time thinking. The crux of my problem is that the flat range is unusual. It was due to end thousands of years ago based on the periodicity of the data - which btw simply screams Fourier Series. So how do you demonstrate absolute causal dependency between CO2 and temperature and disprove the possibility of a bigger problem - the end of the Holocene - or worse the end of the Quaternary period driven by massive effects that we have no hope of controlling. Remember temporal dependency does not imply causal dependency. Just because things occur at the same time does not imply one causes the other. If it did you could correlate your temperature rise to the amount of music played on the planet - which also increased over the 20th century. Why are you so convinced that the correct response is to try and fight change rather than adapt to it? Why would global warming be bad? Think of the consequences of a reduction in human population versus an increase? It seems a rather arrogant echo of King Canute to think that man can make the Holocene last forever simply by commanding it so
    0 0

You need to be logged in to post a comment. Login via the left margin or if you're new, register here.


The Consensus Project Website

THE ESCALATOR

(free to republish)


© Copyright 2024 John Cook
Home | Translations | About Us | Privacy | Contact Us