Unprecedented Warming in Lake Tanganyika and its impact on humanity
Posted on 20 May 2010 by John Cook
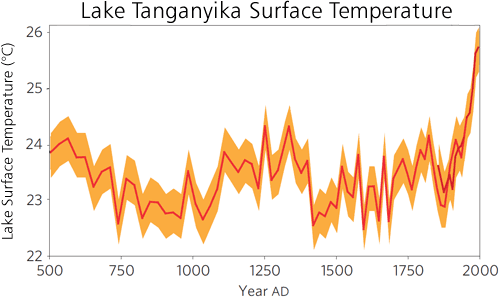
Lake Tanganyika, in East Africa, is the second largest lake in the world (by volume). The lake supports a prodigious sardine fishery which provides a major source of animal protein for the region as well as employment for around 1 million people. Direct observations over past 90 years find that Lake Tanganyika has warmed significantly. At the same time, there's been a drop in primary productivity in the lake impacting sardine populations. To further explore this matter, geologists took lake cores to determine the lake's surface temperature back to 500 AD (Tierney 2010). They found that warming in the last century is unprecedented over the last 1500 years.

Figure 1: Lake Surface Temperature from Lake Tanganyika palaeorecord for the past 1,500 years, measured in core KH1 (red line) and MC1 (dark red line). Orange shading is 95% error bars.
What effect does temperature have on the lake's sardine population? To answer this question, a proxy for primary productivity was also reconstructed from the lake cores. Primary productivity was determined from the percentage of biogenic silica in the sediment. They found that over the last 1500 years, when temperature rose, primary productivity fell. In the last 150 years, productivity plummeted from relatively high levels during the early 1800s to some of the lowest sustained values during the past 1,500 years.
How does temperature affect primary productivity? When the surface of the lake warms, the waters become more stratified. This makes it harder for cold currents to rise from the bottom. These currents carry nutrients from the depths toward the surface as food for algae. Sardine then feed off the algae. A less productive lake means fewer fish and therefore less food and income for those living in the region.
The stratification is confirmed by deep-water instrumental measurements which find less warming at deeper layers, revealing an increased temperature gradient. Nevertheless, another possible cause in changing rainfall is explored. Higher rates of precipitation may increase primary productivity. Charcoal levels in the lake cores were used as a proxy for humidity (eg - low humidity leads to drought which corresponds with more bushfires). However, they found a weak correlation between charcoal levels and productivity. The stronger relationship between temperature and productivity led the authors to conclude that it's temperature, not rainfall, that is largely controlling primary productivity.
There's also a strong match between Northern Hemisphere temperature reconstructions and the Lake Surface Temperature reconstruction. Temperatures on Lake Tanganyika have largely followed global trends over the past 1500 years as well as the past half-century. From this, the authors infer that surface temperatures in this region vary in concert with the global average and that the recent anomalous warming is a response to anthropogenic greenhouse-gas forcing. As lake temperature and primary productivity are closely related, this is evidence of another impact of man-made global warming on humanity - in this case, the communities and regional economy around Lake Tanganyika.


 Arguments


Note that while certain regions during the Medieval Warm Period were hotter than current condition, the global average was cooler than today. Here's a temperature map of the Medieval Warm Period. Temperatures are relative to the 1961 to 1990 period. So if a region is yellow, orange or red, it's warmer than the 1961 to 1990 period. There are various regions that were warmer than the late 20th Century. But there were other regions that were cooler also, denoted by the blue regions.
I suggest discussions of the Medieval Warm Period are best conducted at the Medieval Warm Period page.
I lose control of the class all too easily :-(
"do you have any idea what date the sediment record would be measuring to?"
A close-up of their temperature reconstruction (in the paper, the Figure 1a inset) seems to indicate the data ends in the late 1980s (best guestimate from eyeballing the graph is 1988) but I can't find anything stating that date explicitly. Maybe it's in the supplementary material which I don't have my hands on right now.