Climate Science Glossary

Term Lookup

Enter a term in the search box to find its definition.

Settings

Use the controls in the far right panel to increase or decrease the number of terms automatically displayed (or to completely turn that feature off).

Term Lookup

Settings


All IPCC definitions taken from Climate Change 2007: The Physical Science Basis. Working Group I Contribution to the Fourth Assessment Report of the Intergovernmental Panel on Climate Change, Annex I, Glossary, pp. 941-954. Cambridge University Press.

Home Arguments Software Resources Comments The Consensus Project Translations About Support

Bluesky Facebook LinkedIn Mastodon MeWe

Twitter YouTube RSS Posts RSS Comments Email Subscribe


Climate's changed before
It's the sun
It's not bad
There is no consensus
It's cooling
Models are unreliable
Temp record is unreliable
Animals and plants can adapt
It hasn't warmed since 1998
Antarctica is gaining ice
View All Arguments...


Username
Password
New? Register here
Forgot your password?

Latest Posts

Archives

Watts, Surface Stations and BEST

Posted on 4 November 2011 by logicman

The Berkeley Earth Surface Temperature (BEST) project - was set up to address criticisms of land temperature records.  It has been known since its invention that when using a thermometer to record weather, siting is of vital importance.  It was also known that a thermometer could not measure air temperature accurately unless it was shielded from precipitation and direct sunlight.  One device used to shield thermometers is the Stevenson Screen.

Stevenson Screens need to be mounted in locations where they are in ambient air with the thermometer bulb or other sensor 2 meters above the ground.  There are various other norms: such as ensuring the door opens away from the Sun.

The so-called surface temperature stations actually record near-surface air temperatures.  As early as 1938, G.S. Callender, in writing of the effects on temperature of atmospheric CO2, made it clear that the siting and quality of surface temperature stations must be considered.

The most comprehensive survey of alleged flaws - microsite influences - in the construction and siting of surface stations is the SurfaceStations.org project begun by meteorologist Anthony Watts. in cooperation with Dr. Roger Pielke Sr.  In a 2009 article published by the Heartland Institute think tank, Watts claimed to show that US surface station records could not be relied on, so why trust any others?

"The reliability of data used to document temperature trends is of great importance in this debate. We can't know for sure if global warming is a problem if we can't trust the data."

'Debate' is a contest of orators: science is a contest of evidence. Watts ignores how scientists handle the data: using strong statistical techniques to remove bias. A study using Watts' own data - Menne 2010 - found that station exposure does not play an obvious role in temperature trends, the same conclusion reached by a team including Watts in a later paper, Fall et al 2011.

Most recently, the Berkeley Earth Surface Temperature Project re-examined the surface station data.  Four papers have been published on the BEST web site with all the data and software code so anyone can check.

Watts is on record as having said that he would accept the results of the BEST study.  This is what he posted in his own blog:

Briggs on Berkeley’s forthcoming BEST surface temperature record, plus my thoughts from my visit there

Posted on March 6, 2011 by Anthony Watts

... I’m prepared to accept whatever result they produce, even if it proves my premise wrong. I’m taking this bold step because the method has promise. So let’s not pay attention to the little yippers who want to tear it down before they even see the results.

Anthony Watts' response to this very high degree of transparency is that the papers are of no value because they have not been peer reviewed: we agree with Watts that you should be sceptical of non-peer reviewed work, and wish he would apply this scepticism elsewhere, even to things he wants to believe.  In the case of BEST the criticism is not warranted: the papers are in peer review and are available on the web so that more people can assist in improving their quality.  Watts et al’s criticism has mostly been to insult the authors, as noted here at SkS, rather than help with public reviewing.

Is there a real problem with surface stations?

Judging from Watts' writings on his surface stations project, it seems common sense to him that badly sited surface stations will produce bad data.  However, independent studies have shown that the sites studied by Watts and his volunteers do not affect the finding of a real global warming trend.  Which is most likely to be flawed, the data, or ‘common sense’?  Let’s critically examine the assertions made in Watts' 2009 article Is The US Surface Temperature Record Reliable?

On the front page of the pdf, Watts asks two questions:

"Is the U.S. Surface Temperature Record Reliable?"

"How do we know global warming is a problem if we can't trust the U.S. temperature record?"

The 2nd question carries the implication that if the US temperature record is unreliable, then global warming isn't happening.  Is it possible that Watts' intention is to disprove global warming?  If so, is it possible that in his pursuit of station bias he fails to take precautions against observer bias?

Early in the paper Watts compares three different coatings on Stevenson Screens and finds a difference.

"This test showed that changes to the surface coatings did make a difference in the temperatures recorded in these standard thermometer shelters, shown in Figure 3. I found a 0.3° F difference in maximum temperature and a 0.8° F difference in minimum temperature between the whitewash- and latex-painted screens. This is a big difference, especially when we consider that the concern over anthropogenic global warming was triggered by what these stations reported was an increase of about 1 .2° F over the entire twentieth century."

The graph shows a record of actual temperatures over a 24 hour period.  Watts compares these temperatures to an entire century of recorded trend, i.e. temperature change.

The experiment was a single study of one sample of each coating type in a single location over a single day.  Watts went on to check temperature stations near his home.

"... there were three stations near my town of Chico, California within easy driving distance. I set out to check the paint on the Stevenson Screens at these locations to see if they had indeed been converted to latex from whitewash. The first station, at the Chico University Experiment Farm, had been converted to latex, but it also contained a surprise. It had two screens, one of which was converted to automated radio reporting. I was surprised to find NWS had installed the radio electronics just inches from the temperature sensor, inside the screen, (See Figure 4.) Surely this station's temperature readings would be higher than the actual temperature of ambient air outside the screen."

To the casual observer, this image shows a temperature probe hanging next to some electronic components. It is obvious that the NEMA box has been opened by or for the photographer. When the box is closed, the probe is not inside but some 6 to 8 inches away, as noted by Watts in his own site survey.  The probe is held in place by what looks like a tie-wrap, so that the sensing tip is at the center of volume of the Stevenson Screen.  The chance that the temperature measured by the probe will be significantly affected by the trivial heat dissipation of electronic components in a sealed box some inches away is likely to be vanishingly small.

The rest of Watts' article consists of descriptions and photographs of what he considers to be factors which will influence temperature records.  He includes some false color infra-red photographs to draw attention to heat sources near thermometers.
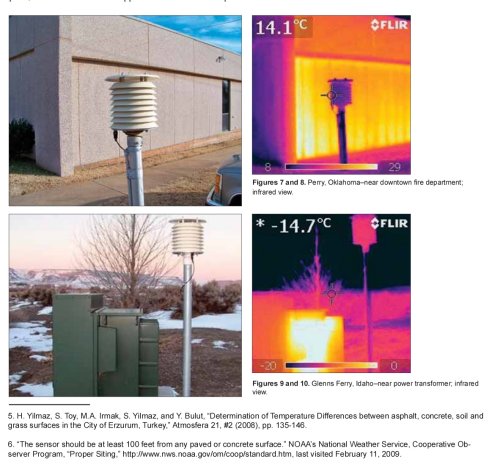
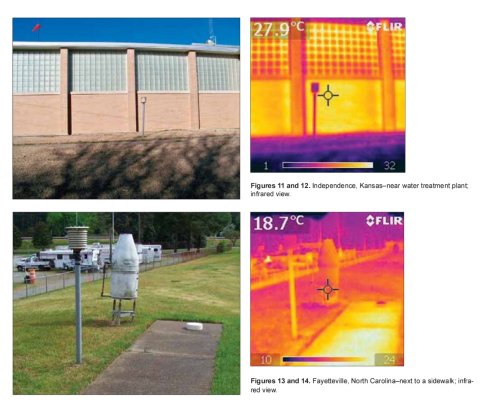
Rather than draw readers' attention to the hot spots, I would invite readers to compare the color (temperature) of the instrument housing with the color (temperature) of the general surroundings.  In each case, the temperature station casing is - despite being near a source of heat - at the same temperature as the nearby land.

The whole purpose in screening a temperature sensor is to shield it from radiant heat.  The photographs serve only to show the infra-red sources from which the temperature sensors are being shielded – and these shields are probably part of the reason why neither Menne nor Watts found a warming bias.

Summary

It has been known since the invention of the thermometer that for accurate measurement of air temperature the thermometer must be shielded from radiant heat.  The lack of overall bias in the surface station records would seem to demonstrate what is seen in the infra red photographs: the stations are adequately shielded against influence from local sources of radiant heat.

It seems likely that the average reader of Watts' articles will have gaps in his or her knowledge of how scientists handle weather station data.  Arguments which rely on those knowledge gaps will fail to impress anyone who has read articles like this SkS series on how weather station data is handled.

Although homogenisation can smooth out some flaws in the data, the data must be free from overall bias in order to produce scientifically valid findings.  One must conclude from the lack of significant bias proven by multiple studies that the surface stations project shows, not factors found to actually cause bias but things which the casual observer thinks ought to cause bias.

-Patrick Lockerby

Credit is due to SkS contributors who have helped to make this article more readable, especially MarkR who contributed a major revision in layout.

0 0

Printable Version  |  Link to this page

Comments

1  2  Next

Comments 1 to 50 out of 56:

  1. Perhaps the final sentence would be clearer as: One must conclude from the lack of significant bias proven by multiple studies that the surface stations project highlights things which the casual observer thinks ought to cause bias, rather than highlighting factors found to actually cause bias.
    0 0
  2. This is lovely. As far as I'm concerned, this is the key quote: "Rather than draw readers' attention to the hot spots, I would invite readers to compare the color (temperature) of the instrument housing with the color (temperature) of the general surroundings. In each case, the temperature station casing is - despite being near a source of heat - at the same temperature as the nearby land." So Watts' biases can be demonstrated using his own photos.
    0 0
  3. Thanks for this. (I noticed that the link to the "Fall et al 2011" draws a blank at Word Press)
    0 0
  4. oneiota: Here's a link for the Fall et al paper that should work
    0 0
  5. I note that Watts is described as a 'meteorologist'. According to Sourcewatch, he holds no higher degrees or qualifications in the field of meteorology, though he has been a TV and radio weatherman for many years. Of course anyone can do science provided they do it competently and read / comprehend the work of those before, but I wouldn't want people to confuse Anthony Watts with other professional meteorologists. His inability to understand the collection and processing of meteorological data, as shown by Patrick's excellent article and in many places elsewhere, is clear for all to see.
    0 0
  6. "We are the 97%" - AGW accepting scientists. Put that on a mug.
    0 0
  7. THese IR pics are very interesting indeed. Watts' site premise for existence has been invalidated by every data study ever intended to verify it: from the early work of John V, to Menne, to Fall. Now it turns out that his premise even lacks a physical basis.
    0 0
  8. skywatcher: "I note that Watts is described as a 'meteorologist'. According to Sourcewatch, he holds no higher degrees or qualifications in the field of meteorology" Nor lower degrees, he dropped out of university after two or three years and never graduated. So, technically, he's a high-school graduate ...
    0 0
  9. To make sure I'm understanding all of this article properly, with regard to the differring properties of coating on Stevenson Screens. Aren't the different coatings irrelevant since we should be using the temperature anomoly rather than the absolute temperature? Like Watts I am not a climate scientist so I'd appreciate some guidance as to whether I'm grasping this properly. Unlike Watts I do hold tertiary qualifications, albeit in another field. (Sorry, but I couldn't resist)
    0 0
  10. Before mention of Watts' qualifications descend into ad-hom, I would add that the best Watts can be described as is an amateur meteorologist. An amateur has the potential to make significant contributions to a field - in astronomy this happens all the time, but it requires exquisite care and dedication to fully understand the field you are dabbling in, and to understand where and how you can make a contribution. Some easy examples: Faint fuzzy not on the sky chart? Comet! But is it moving, and has it already been recorded? Variable star! What observations exist, and what are the existing explanations for its behaviour? Can you and your equipment accurately record the variations? Supernova! Or is it an asteroid or existing star in front of that galaxy? Those with no astronomical/astrophysical qualifications can make valuable discoveries and observations, but they will not make those discoveries by casually looking through their telescope while ignoring the literature and existing understanding on what it is you are observing. Many UFO sightings stand testament to people making a fuss about something in the sky before they understand all the processes/events that may provide a mundane explanation. Watts fails even the dedicated amateur status on several fronts, some of which are in the article above, another is include approaching the problem with a clearly desired conclusion in mind, hence why I would not easily see him as a meteorologist.
    0 0
  11. "A study using Watts' own data - Menne 2010 - found that station exposure does not play an obvious role in temperature trends, the same conclusion reached by a team including Watts in a later paper, Fall et al 2011."
    I don't think that accurately characterizes Fall et al, which does find bias in min/max temperatures but not average temperatures. IIRC, the authors state that while average temps appear to be robust, this may be a chance circumstance of min/max biases cancelling each other out. I'd quote chapter and verse, but the link to the pdf is broken for me - you should check it. And I'd like to re-read.
    0 0
  12. ptbrown31 @6 "We are the 97%" [...] Put that on a mug. What do you mean by this remark? And also can you please explain how it relates to the topic we are discussing here? Stevo @9 I'm in another filed just like you but I guess the average temp anomaly is not biased if the conditions and coatings of given stations stay the same: i.e. if the stations are "re-coated" at some point, then the same coat is used. Still, if they are re-coated randomly according to the taste of the owner. However if they were all gradually re-coated according to the "national fashion trend" or other universal criteria (say from bare wood through latex to whitewash), then those changes could introduce some bias. If I was Watts & trying to disprove the data I would look at this possibility. I wander if Watts (or any other 'sceptic') considered it he is content with just weak allegations...
    0 0
  13. chriskoz @12 Thanks for that. You pretty much summed up my thoughts on that one.
    0 0
  14. Regarding figure 4. It deserves a quote from the TV series Father Ted. "Now concentrate this time, Dougal. These are very small; those are far away..." Not quite the same context but the image is used to create a notion of conspiracy by using the lack of depth information to suggest the sensor appears to be closer to the electronics.
    0 0
  15. The bottom photo, that paving ought to be much cooler than the grass surounding it at night. Its only really about human sources of heat like heating or air conditioning that will change the local temperature over 24 hours.
    0 0
  16. Stevo @9: If you changed the coating, then you would expect a 'jump' in temperatures. If all stations were coated at exactly the same time, then you might not pick it up. If one were coated and the nearby ones weren't, then the homogenisation procedure would work it out: 'what's this big jump? No-one near it has it, must be something else, let's go check and account for it'.
    0 0
  17. Much as I think Watts and co have always been clutching at straws in their attempts to discredit temperature recordings, I do worry about this argument offered in rebuttal:
    "Rather than draw readers' attention to the hot spots, I would invite readers to compare the color (temperature) of the instrument housing with the color (temperature) of the general surroundings. In each case, the temperature station casing is - despite being near a source of heat - at the same temperature as the nearby land."
    My gut reaction to that statement is; well, that's what one would expect, wouldn't one -- given that the weather station and its general surroundings are arguably both equally influenced by the nearby heat source in question? I'm not sure this is such a good argument and in the absence of any scientific study in support of its validity, I would suggest it's removed. As far as I'm concerned the 'BEST' and 'Fall et al' studies have demolished the 'station siting' myth and we should move on.
    0 0
  18. John Russell, think about the amount of energy which would be required to change the temperature of the surrounding environment. Or better... just do a simple experiment at home; 1: Place a thermometer three feet from your stove 2: Record the current temperature 3: Turn one of the burners to its highest setting 4: Wait a bit for the burner to warm up 5: Compare the temperature to that recorded in step 2 I think you know, without even doing the experiment, that the temperature will not change. Yes, the burner is very hot and would show up as such on an IR image... but it is not going to change the temperature of the entire room by any measurable amount. This is even more true outdoors. I'm sure there have been scientific studies of this fact (probably a couple of hundred years ago), but it also falls into the category of 'common knowledge'.
    0 0
  19. @CB Dunkerson: I agree. Please re-read what I said. The weather station and it's surroundings will both be influenced equally by any nearby heat source -- even if the influence is zero! We would therefore expect them both to be the same colour in a thermal imaging camera. So this observation does not invalidate the idea that the weather station is influenced by the nearby heat source -- even though, for the reasons you give, we know empirically that the influence will be not measurable. See what I mean?
    0 0
  20. Ok, yes I agree that the impact will be 'equally not measurable' on both... but isn't the 'not measurable' the relevant bit for a temperature anomaly study? I gather that you are saying that the IR photographs showing that the environment and monitoring stations are at the same temperature does not prove that they haven't both been impacted by the heat source. Indeed, technically they both have been... just to such a small degree as to be meaningless for purposes of the study. However, the sharp contrast (i.e. bright yellow vs purple) between the heat sources and the environment / monitoring stations also demonstrates this lack of impact. Once the logic flaw in the claim 'near heat source means biased readings' is pointed out the 'common knowledge' factor kicks in and people realize that their own past experience is at odds with what Watts is claiming.
    0 0
  21. No Urban Heat Island effect in space. Satellite studies show the same warming as surface stations.
    0 0
  22. @CB Dunkerson: I agree with every word of what you write. It's just that I think rebuttals should be robust as they will be nit-picked by those in denial. The essence of my comment is that the article uses thermal images to prove that the station and its surroundings are at the same temperature. I agree, they are. It then suggests that this means that the station is not being affected by the nearby heat source -- implying that if it was being affected by the heat source it should show as being warmer than its surroundings. If I have interpreted what the article says correctly then surely this is not logical in that -- assuming just for the sake of argument that there is a measurable raising of temperature -- the heat source would heat both the station and its surroundings equally. I'm suggesting that these thermal images should not be part of a robust rebuttal as they do not actually prove anything either way. Or have I misunderstood something?
    0 0
  23. @Jeffery Davis Exactly! That's the argument to use. No point in getting bogged down in the detail of how the clock works when all we want to know is the time.
    0 0
  24. Sorry to burst a bubble, but if the stations are the same temperature as the ground, which they appear to be in a couple of photo's, then the reading is really screwed up. Ground temperatures are only the same as air temps as the air temp rises or falls. Prob like a clock twice a day. And if it is quit warm, then not even then. Farmers refer to ground temp as sod temperature. I can only suggest that you use a probe and leave it in the ground. You will see that ground temperatures and air temp seldome match.
    0 0
  25. Unfortunately, Camburn makes my point for me (about robust arguments). However, though he's right about ground temperatures and air temperatures often being very different, the fact that the station temperature and the grass temp seem to be the same in the photograph is not meaningful, in that that situation is not unusual. Only a series of time lapse images would provide statistically meaningful data. Looking again, I would say that the very last thermal image above makes our point best. The grass 1 metre from the warm concrete slab is at the same temperature as the grass 5 metres away, and again 30+ metres away -- and all the grass is at the same temperature as the weather station. This suggests that heat from the slab is not influencing temperatures significantly, beyond a very short distance (50cm?). The thin metal shield round the sensor kills any radiant heat from surroundings, so that can be discounted. If anything, air warmed by the slab and convected directly upwards will pull in air at ambient temperature from the surroundings and this will tend to ensure that the weather station produces an accurate reading of local air temperature. If the station was sitting on the concrete slab that could be very different.
    0 0
  26. Watts and other deniers claim they will wait for peer review of the Best study. This is a copout for two reasons. First, they don't seem to rely on peer review or even good critical review for reports, presentations, and papers that support their positions. Second, peer review is far more important for papers that add significant new findings to the science or claim to overturn existing conclusions. Best only confirmed several previous studies. How restrained would Watts be if Best had contradicted the prior conclusions? Just look at the headlines based on the Salby video. Curry's only comment to Salby was "wow," no analysis of the science.
    0 0
  27. Camburn @24, the bulb of a thermometer in a weather station doss not rest against the side of its screen. Therefore, it measures air temperature, not enclosure temperature. The question the becomes, does the enclosure effectively screen the thermometer from sources of radiant energy. The fact that screens near hot spots remain cool strongly suggests that they do, and that the thermometer does in fact measure local air temperature. That local air temperature may have been raised by nearby concrete structures, and observing the cool screen tells us nothing about that sort of bias. Nor do I think these pictures are enough to determine whether a bias exists from the radiant heat sources or not, as I do not presume to be able to judge IR temperature to tenths of a degree by brightness in a photo. But the cool screens do show that these pictures do not prove bias.
    0 0
  28. Of course, many folks remember the following claim that Watts made in this non-peer-reviewed publication.
    4. Global terrestrial temperature data are gravely compromised because more than three-quarters of the 6,000 stations that once existed are no longer reporting. 5. There has been a severe bias towards removing higher-altitude, higher-latitude, and rural stations, leading to a further serious overstatement of warming.
    Of course, there is a simple and straightforward way to test this supposed "dropped stations" effect. You simply compare global-average temperature anomalies computed from all the stations with the temperature anomalies computed from just the stations that are still actively reporting data. Do that, and you will find that the "dropped stations" effect is virtually nonexistent. I did exactly that some time ago with my own simple gridding/averaging routine, and here are my results (computed from GHCN *raw* data):
    Anomalies computed from all stations are plotted in blue. Anomalies computed only from stations still reporting data as of 2011 are plotted in orange. This is something that a competent programmer/analyst could do from scratch in a few days (max). The fact that Watts and Co. have been pushing this "dropped stations" claim for *years* even though proving it wrong would take only a few *days* of work (assuming that you are starting from scratch and "hand-rolling" all of your own code) does not reflect well on their competence or honesty. BTW, even though a number of folks (Tamino and others) have published results showing that that Watts' "dropped-stations" claim is completely bogus, Watts has yet to "come clean" and admit that his claim is wrong.
    0 0
  29. The outward radiative temperature of the stations do not accurately reflect the internal temperature of the air, especially in the case where the station is well-ventilated. I would presume that such open-screened housing units as those shown don't let air stagnate within. In any case, if it indeed was true that the ground temperature/housing temperature (as yes they do appear the same, more or less) was the one being recorded, then the fact that the housing unit and ground are *cooler* in each photograph than the ambient air would suggest a cooling bias in temperature, not a warming bias. Time lapse images, I would think, wouldn't help at all. What would help is if you compared the thermometer readings with the IR temperatures of the surrounding unit and ground - if the temperature follows those, instead of the ambient air, then there's a problem.
    0 0
  30. Maybe off-topic with regards to the actual subject of the post, but it does concern one of the main subjects : Watts. I can't see how he can be described as a meteorologist when he has no qualifications in that field and doesn't actually work in the field - he is retired, like so many of the so-called skeptics. He admits his lack of relevant qualifications generally on his own blog, although he does try to deflect away by the usual unrelated diversion : "While I’m not a degreed climate scientist, I’ll point out that neither is Al Gore, and his specialty is presentation also."
    0 0
  31. Like Stevo@9, to me what would be important is the delta temp change. Even if there was some effect from the surrounds which I don't believe there would be, it is the delta change from year to year that is important. I see this argument about location as revelant as a denier stating that we cannot have a cold day if AGW is real. Once again thou, another well thought and written article.
    0 0
  32. Perhaps there needs to be more emphasis on the abject failures of the "coating" experiment to reach the appropriate standards for a scientific experiment. Because it was one screen of each type, tested over the course of one day, in one location, the results should be considered mildly interesting but not statistically significant until the test has been repeated many time with randomized placement so that positioning bias (among others) can be controlled for. The essential problem to me appears to be that Watts prefers an approach to science best characterized as "science by anecdote".
    0 0
  33. @caerbannog, Watts will not 'come clean'. He will already have his tactics laid out now, and when the peer review etc on BEST is done he will call the peers 'biased' or worse (though he might try to avoid a word like 'traitors': for us to guess). Correlation in trends between stations less than 1000 km apart is considerable. I think one will find global temperature on a monthly basis by using just a hundred stations 'sufficiently spread across the globe' within one or two tenths of a degree C margin of error. JMurphy #30, I have disqualified Watts as a meteorologist permamently as of just over a year ago, when he showed not to know at all what a Polar Low is. An object any meteo textbook will describe, and only within the tropics can one afford not ever to have heard of it. Though the warm core, non-baroclinic, convective character of such a low could provide a little useful understanding for tropical revolving systems (just add seven kilometers for tropopause height, say).
    0 0
  34. Logicman: What a great line: "'Debate' is a contest of orators: science is a contest of evidence. I've been searching for a concise, snappy way to say just this. That one's going right into ClimateBites (with credit to Sks & logicman, of course!)
    0 0
  35. Tom and Logicman, the problem with that line is given by the actual struggle for interpretion of evidence. In history and practice oratory always helps to bring certain interpretations of evidence (like that of rising mercury in certain instruments across the globe) across. Actually this is only not true for logic and mathematics, although even there certain 'retorical rules' for proofs exist. The elegant proof convinces even more: often by giving deeper insight. The line is self-defeating. I think the problem can be avoided by not viewing science as a contest at all, for starters. But I don't know how such a fine oneliner could be destilled from this..
    0 0
  36. Anthony Watts was surprised to learn the pdf had been deleted, and kind enough to email me a working link to Fall et al 2011. http://pielkeclimatesci.files.wordpress.com/2011/07/r-367.pdf Having read through, I have to retract my comments above. The interpretation I gave came not from the study itself, now I remember, but from an article on the paper at WUWT. Nowhere in the paper is it suggested that biases in min/max trends make the mean trend suspect.
    0 0
  37. caerbannog @28 "4. Global terrestrial temperature data are gravely compromised because more than three-quarters of the 6,000 stations that once existed are no longer reporting." And Ants' basis for this claim that this reduction in stations used 'compromises "something" is what'? Sorry, WUWT is a maths free zone so he can't answer that question. "5. There has been a severe bias towards removing higher-altitude, higher-latitude, and rural stations, leading to a further serious overstatement of warming." Again, how does removing a warm station bias the record. As distinct from removing a warming station, which would cause a cooling bias in the record. Like deleting stations from the Canadian Arctic. Ants' seems all to willing to pander to the basic innumeracy of his audience with emotive but badly reasoned views.
    0 0
  38. Glenn @37: Ant? Watt Ant? (Sorry, that was completely irresistible!) ChrisKoz @12: I think the mug joke is referring to Occupy Wall Street ("we are the 99%") and the study showing that 97% of climate scientists agree with the premise of AGW. I rather like it - I'll buy one of those if they make them (although I'm not a climate scientist either). Camburn @24, John Russell @25, I know zilch about IR photography, but does the "ground" colour represent the ground temperature you would obtain by sticking a probe in the mud, or the temperature of the layer of air immediately above it? Which can be quite different from both the ground temperature and the temp at about shin level.
    0 0
  39. Watts' criticism can be found at the link below. Can anyone comment if he has valid criticism of the methodology? I think that Muller might have been mistaken to not stick to what Watts stipulated or should have stated right at the outset as to why they chose to analyse the data the way they did. Watts' reasons against BEST results Watts may be an amateur but he has a huge audience and influence. Since he put himself out there by saying he would accept the results, cornering him would really have taken the wind out of the denialist and skeptic sails, if the data supported AGW.
    0 0
  40. DMarshall so a team of professional scientists should stick to what a former TV weatherman "stipulated"? The surface station project provided the raw data, i.e. what "the casual observer thinks ought to cause bias"; the Berkely team analysed those data and reported the conclusions. You may disagree, as Watt does, on BEST's methodology but you can not ask the Berkley team to comply with Watt's wishes or expectations. Not even Watt asked that much.
    0 0
  41. DMarshall @39, I can answer a couple of these. #3 in his points of agreement (the quote from David Whitehouse/GWPF, which has subsequently been hyped into a new denier meme that the "human component of global warming may be somewhat overestimated"). This is a soundbite cherry-picked from a paragraph which a) is a conditional statement, not a conclusion or statement of fact, and b) about questions which the paper didn't attempt to answer. Very good rebuttal on The Way Things Break. Disagreements: #1 I'm sure somebody, somewhere has looked at the actual numbers (I haven't), but the point is that the BEST results and the two papers Watts cites here (Menne et al and Fall et al) agree, so even if using 60 years was catastrophically wrong, it doesn't seem to have biased the results. (Of course Watts will be trying to argue that that the BEST results would be very different from the other two papers if they had used 30 years worth of data instead of 60 - but then he should run the numbers himself and demonstrate this convincingly. Don't hold your breath.) Also in #1, he quotes Willis Eschenbach's comment: "That seems crazy to me. Why compare the worst stations to all stations? Why not compare them to the best stations?" This is nonsense. The objective is to use all the data to compute a mean and trend. So, simplistically, you get "the number" (whatever metric you're computing) from all the data, then you get "the number" from the worst data, and you compare the two results to see whether the worst stations introduce a bias to the overall results. Whether the "best" stations introduce a bias is a completely separate question (and again you would compare them to everything). Disagreement #2: Watts is confusing measurements with trends. Again. The fact that a station is much hotter (or colder) than another station is irrelevant for computing the trend, provided temperature changes over time at the same rate at both locations. What the authors are saying is that the hot spots cover too small an area for their growth to have a big impact on the trend. (Some warming in urban areas will be due to increased urbanisation.) #3 I think several people have observed that this is an outstanding example of pot-kettle-black... ;) Unlike Watt's Heartland Institute paper, these have all been submitted for peer review. Hope that helps - I'm sure others will chip in.
    0 0
  42. Riccardo @40, agree - Watts hasn't demonstrated any ability to do the science yet so no-one actually analysing the data should pay him any attention. But DMarshall is correct about the size of the following he has, and unfortunately there seems to be an epidemic of Dunning-Kruger syndrome amongst his followers so they buy into his science fiction (er, mods, what's the plural of hominem?) I don't think the authors should have stuck to his stipulations, but I tend to agree with "should have stated right at the outset as to why they chose to analyse the data the way they did", if only to grab the scientific high ground right from the start. It comes across much more strongly than doing it in rebuttal. It's disgraceful that science has to become a PR exercise to cope with this, but it's also reality.
    0 0
  43. Self-correction: @40 Disagreement #2 "provided temperature changes over time at the same rate at both locations". That's not true. They can of course warm or cool at different rates, but the absolute temperature of either station at a point in time is irrelevant for computing the trend. (Slaps own wrist)
    0 0
  44. D Marshal @39: 1) There are two possible issues with bad surface stations. One is that a bad surface station will show a different trend over time. There is no particular reason to believe this is so, but it is at least a possibility and should be checked. The second is that a good surface station that is modified by later construction to make it bad will generate a false trend because its absolute measured temperatures will have become warmer as a result of the changes. Clearly, if you use 60 years of data instead of 30, a higher proportion of the "bad" stations would have been good stations at the start of the analysis period. You don't need to know which stations they were, or when they where degraded. So based on this, increasing the study period will increase the trend in the "bad" stations if there is an actual problem. On the other hand, in the worst case (for the analysis) scenario, it may be that all "bad" stations where degraded either 30 years ago or less, or more than 60 years ago. In this unusual circumstance, the fact that the spurious trend caused by degradation of the stations is analyzed over a 60 rather than a 30 year period would halve the spurious trend. As the difference between the trend in OK (ranks 1, 2, & 3) and poor (ranks 4 & 5) sites is 0.0684 degrees C per Century, in this worst case example for the analysis, that would make a difference of just 0.07 degrees C per century in the analysis, hardly significant. Further, if that unusual circumstance did apply, it would show in distinct behavior between OK and Poor stations over the last thirty years and the thirty years before that. In fact, no such distinction is apparent in the reconstruction (which does not suffer from this problem): So, for the primary issue, using a 60 year rather than a 30 year analysis is likely to exaggerate the spurious trend, although it de-emphasize it by a trivial amount. Regardless, choice of period makes no difference to the compared reconstructions which show clearly that station quality does not distort the record of trends. However, using a 60 year analysis with only 30 years of metadata does make it difficult to attribute any spurious trend found to the first or second effect. Consequently an additional 30 year analysis would be nice - but essentially Watts is grasping at straws. 2) With regard to the UHI effect, Watts' critique is even worse. It's main point is given by he quote from Willi Eschenbach, who says,
    "That seems crazy to me. Why compare the worst stations to all stations? Why not compare them to the best stations?"
    However, in the UHI paper, the 40% "very rural stations" are compared to all stations. As far as avoiding contamination by the UHI goes, the "very rural" stations are the best. Eshenbach's (and Watts') argument, then consists in simply mis-describing what was done. His secondary argument is no better. Watts says,
    "They didn’t adequately deal with that 1% [of urbanized surface area] in my opinion, by doing a proper area weighting."
    But, of course, in the reconstruction the stations are area weighted, so he is simply claiming as a counter argument that they did not do what they in fact did. He probably suspected that was not a good argument, so he then dragged "33% of the sites show a cooling" across the trail to confuse the scent. (It is, of course, irrelevant to the UHI issue.)
    0 0
  45. @Tom Curtis #44: How about transforming your excellent commentary into an article?
    0 0
  46. @Tom Curtis #44 Thank you for that analysis and I second John Hartz's suggestion that you make an article out of it. The WUWT crowd are sure to play up Muller's supposed manipulation of the results through the use of faulty data and it would be good to have a thorough analysis of what matters and what doesn't in a main article.
    0 0
  47. I would like to thank everyone who contributed to this interesting discussion. It's good to see so much genuine critical thinking. Regarding comments about the infra red images: the camera 'sees' only significant sources and sinks of radiated heat. The air itself is not imaged, so the IR images can say nothing whatsoever about air temperatures. All they can show is whether or not radiated heat is being absorbed by the weather station screens. If a screen was so close to a radiant source as to be heated by it, then we could assume with some justification that the air inside could or would be heated. But the weather station would need to be very close indeed: almost in contact with the radiating object. Tom Curtis #44 I agree with the previous comments: you have the basis of an excellent article here.
    0 0
  48. logicman, the link to Fall et al 2011 in your article is broken. Replace it with this one. http://pielkeclimatesci.files.wordpress.com/2011/07/r-367.pdf
    0 0
    Response:

    [DB] Updated link, thanks!

  49. Like Watts, no qualification in climate or meteo. But I clearly don’t understand the point. My problem is not the IR photo in particular, but what is measured by the thermometer. I imagine a sensor, in the middle of a field. First case, nothing happen around the field from 1970 to 2010. Second case, the field is progressively surrounded by houses, roads, factories, etc. There are no other change except these local ones. Because the sensor is shielded in a box, it will be absolutely indifferent to change in sensible and latent heat fluxes in the environment, or radiative changes from albedo ou local GHG concentrations ? And the sensor will not register any temperature difference in the two cases, after 40 years of differential land-use?? But... what is measured by the sensor??? Totally weird for me.
    0 0
  50. Coming into the fray a bit late.... Let's start with part of the first paragraph of the post:
    "It has been known since its invention that when using a thermometer to record weather, siting is of vital importance. It was also known that a thermometer could not measure air temperature accurately unless it was shielded from precipitation and direct sunlight. One device used to shield thermometers is the Stevenson Screen.
    The physics of this is also well understood. To start, the only thing you can measure accurately with a thermometer is the temperature of the thermometer. To do anything useful, you have to find a way to get the thermometer temperature close to the temperature of the thing you're interested in. In our case, we are interested in air temperature. A thermometer has an energy balance. There are three primary forms of energy transfer we are concerned with: - radiation - thermal transfer - evaporation We can express this energy balance as follows:
    C*dT/dt = Q* + QH + QE
    where C is the heat capacity of the thermometer, dT/dt is the rate of temperature change of the thermometer with time (i.e., how fast is it warming or cooling?), Q* is the net radiation (sum of received visible and IR, minus losses of visible and IR), QH is the rate of thermal energy transfer between the air and the thermometer, and QE is the loss of energy due to evaporation from the thermometer. QH depends on the temperature difference between the air and the thermometer. Obviously, if we want to measure air temperature, we want this term to equal zero. We also want the thermometer temperature to be stable (at least, as stable as air temperature is), so we want dT/dt to equal zero. How do we accomplish this? Well, we want to block radiation, so that Q* = 0, and we want to keep the thermometer dry, so that QE = 0, So then we have C*dT/dt = Q* = QE = 0, and thus QH = 0 and our thermometer gives a good measurement of air temperature. If we have a radiation error (Q* > 0), then our thermometer reads high. If our thermometer gets wet (QE > 0), then our thermometer cools until QH = -QE. Keep it good and wet, and compare it to a dry bulb thermometer, and you can measure the humidity of the air (see Wikipedia Wet bulb temperature discussion). So, what is needed for good air temperature measurements is some form of radiation shield, a way of keeping the thermometer dry, and a way of making sure air flows over the thermometer. The Stevenson Screen is the classic (although many other devices exist). In olden days, Stevenson Screens were often left to use natural ventilation, but now days all the ones I've seen use forced ventilation (a fan and air intake). Forced ventilation is a requirement for wet bulb/dry bulb humidity measurements, and it helps bring a thermometer to rapid equilibrium and reduces radiation errors for a normal temperature system. If a sensor has errors (e.g. radiation), then a long-term trend in temperature requires that the error change over time. This is why anomalies are used instead of actual temperatures. I'm going to give away my age, but my bookshelf includes the second edition (1990) of Principles of Environmental Physics. I see there is a third edition available. The first edition was published in 1973. Many, many useful discussions of such basic micrometeorology. I'll make my next point in another comment.
    0 0

1  2  Next

You need to be logged in to post a comment. Login via the left margin or if you're new, register here.


The Consensus Project Website

THE ESCALATOR

(free to republish)


© Copyright 2024 John Cook
Home | Translations | About Us | Privacy | Contact Us