Climate Science Glossary

Term Lookup

Enter a term in the search box to find its definition.

Settings

Use the controls in the far right panel to increase or decrease the number of terms automatically displayed (or to completely turn that feature off).

Term Lookup

Settings


All IPCC definitions taken from Climate Change 2007: The Physical Science Basis. Working Group I Contribution to the Fourth Assessment Report of the Intergovernmental Panel on Climate Change, Annex I, Glossary, pp. 941-954. Cambridge University Press.

Home Arguments Software Resources Comments The Consensus Project Translations About Support

Bluesky Facebook LinkedIn Mastodon MeWe

Twitter YouTube RSS Posts RSS Comments Email Subscribe


Climate's changed before
It's the sun
It's not bad
There is no consensus
It's cooling
Models are unreliable
Temp record is unreliable
Animals and plants can adapt
It hasn't warmed since 1998
Antarctica is gaining ice
View All Arguments...


Username
Password
New? Register here
Forgot your password?

Latest Posts

Archives

Are surface temperature records reliable?

What the science says...

Select a level... Basic Intermediate Advanced

The warming trend is the same in rural and urban areas, measured by thermometers and satellites, and by natural thermometers.

Climate Myth...

Temp record is unreliable

"We found [U.S. weather] stations located next to the exhaust fans of air conditioning units, surrounded by asphalt parking lots and roads, on blistering-hot rooftops, and near sidewalks and buildings that absorb and radiate heat. We found 68 stations located at wastewater treatment plants, where the process of waste digestion causes temperatures to be higher than in surrounding areas.

In fact, we found that 89 percent of the stations – nearly 9 of every 10 – fail to meet the National Weather Service’s own siting requirements that stations must be 30 meters (about 100 feet) or more away from an artificial heating or radiating/reflecting heat source." (Watts 2009)

At a glance

It's important to understand one thing above all: the vast majority of climate change denialism does not occur in the world of science, but on the internet. Specifically in the blog-world: anyone can blog or have a social media account and say whatever they want to say. And they do. We all saw plenty of that during the Covid-19 pandemic, seemingly offering an open invitation to step up and proclaim, "I know better than all those scientists!"

A few years ago in the USA, an online project was launched with its participants taking photos of some American weather stations. The idea behind it was to draw attention to stations thought to be badly-sited for the purpose of recording temperature. The logic behind this, they thought, was that if temperature records from a number of U.S. sites could be discredited, then global warming could be declared a hoax. Never mind that the U.S. is a relatively small portion of the Earth;s surface. And what about all the other indicators pointing firmly at warming? Huge reductions in sea ice, poleward migrations of many species, retreating glaciers, rising seas - that sort of thing. None of these things apparently mattered if part of the picture could be shown to be flawed.

But they forgot one thing. Professional climate scientists already knew a great deal about things that can cause outliers in temperature datasets. One example will suffice. When compiling temperature records, NASA's Goddard Institute for Space Studies goes to great pains to remove any possible influence from things like the urban heat island effect. That effect describes the fact that densely built-up parts of cities are likely to be a bit warmer due to all of that human activity.

How they do this is to take the urban temperature trends and compare them to the rural trends of the surrounding countryside. They then adjust the urban trend so it matches the rural trend – thereby removing that urban effect. This is not 'tampering' with data: it's a tried and tested method of removing local outliers from regional trends to get more realistic results.

As this methodology was being developed, some findings were surprising at first glance. Often, excess urban warming was small in amount. Even more surprisingly, a significant number of urban trends were cooler relative to their country surroundings. But that's because weather stations are often sited in relatively cool areas within a city, such as parks.

Finally, there have been independent analyses of global temperature datasets that had very similar results to NASA. 'Berkeley Earth Surface Temperatures' study (BEST) is a well-known example and was carried out at the University of California, starting in 2010. The physicist who initiated that study was formerly a climate change skeptic. Not so much now!

Please use this form to provide feedback about this new "At a glance" section, which was updated on May 27, 2023 to improve its readability. Read a more technical version below or dig deeper via the tabs above!


Further details

Temperature data are essential for predicting the weather and recording climate trends. So organisations like the U.S. National Weather Service, and indeed every national weather service around the world, require temperatures to be measured as accurately as possible. To understand climate change we also need to be sure we can trust historical measurements.

Surface temperature measurements are collected from more than 30,000 stations around the world (Rennie et al. 2014). About 7000 of these have long, consistent monthly records. As technology gets better, stations are updated with newer equipment. When equipment is updated or stations are moved, the new data is compared to the old record to be sure measurements are consistent over time.
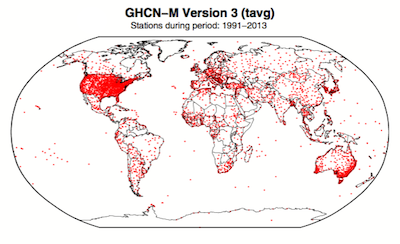
 GHCN-M stations

Figure 1. Station locations with at least 1 month of data in the monthly Global Historical Climatology Network (GHCN-M). This set of 7280 stations are used in the global land surface databank. (Rennie et al. 2014)

In 2009 allegations were made in the blogosphere that weather stations placed in what some thought to be 'poor' locations could make the temperature record unreliable (and therefore, in certain minds, global warming would be shown to be a flawed concept). Scientists at the National Climatic Data Center took those allegations very seriously. They undertook a careful study of the possible problem and published the results in 2010. The paper, "On the reliability of the U.S. surface temperature record" (Menne et al. 2010), had an interesting conclusion. The temperatures from stations that the self-appointed critics claimed were "poorly sited" actually showed slightly cooler maximum daily temperatures compared to the average.

Around the same time, a physicist who was originally hostile to the concept of anthropogenic global warming, Dr. Richard Muller, decided to do his own temperature analysis. This proposal was loudly cheered in certain sections of the blogosphere where it was assumed the work would, wait for it, disprove global warming.

To undertake the work, Muller organized a group called Berkeley Earth to do an independent study (Berkeley Earth Surface Temperature study or BEST) of the temperature record. They specifically wanted  to answer the question, “is the temperature rise on land improperly affected by the four key biases (station quality, homogenization, urban heat island, and station selection)?" The BEST project had the goal of merging all of the world’s temperature data sets into a common data set. It was a huge challenge.

Their eventual conclusions, after much hard analytical toil, were as follows:

1) The accuracy of the land surface temperature record was confirmed;

2) The BEST study used more data than previous studies but came to essentially the same conclusion;

3) The influence of the urban stations on the global record is very small and, if present at all, is biased on the cool side.

Muller commented: “I was not expecting this, but as a scientist, I feel it is my duty to let the evidence change my mind.” On that, certain parts of the blogosphere went into a state of meltdown. The lesson to be learned from such goings on is, “be careful what you wish for”. Presuming that improving temperature records will remove or significantly lower the global warming signal is not the wisest of things to do.

The BEST conclusions about the urban heat effect were nicely explained by our late colleague, Andy Skuce, in a post here at Skeptical Science in 2011. Figure 2 shows BEST plotted against several other major global temperature datasets. There may be some disagreement between individual datasets, especially towards the start of the record in the 19th Century, but the trends are all unequivocally the same.
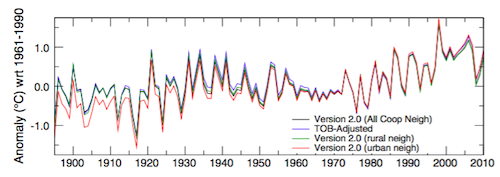
rural-urban T

Figure 2. Comparison of spatially gridded minimum temperatures for U.S. Historical Climatology Network (USHCN) data adjusted for time-of-day (TOB) only, and selected for rural or urban neighborhoods after homogenization to remove biases. (Hausfather et al. 2013)

Finally, temperatures measured on land are only one part of understanding the climate. We track many indicators of climate change to get the big picture. All indicators point to the same conclusion: the global temperature is increasing.


See also

Understanding adjustments to temperature dataZeke Hausfather

Explainer: How data adjustments affect global temperature recordsZeke Hausfather

Time-of-observation Bias, John Hartz

Berkeley Earth Surface Temperature Study: “The effect of urban heating on the global trends is nearly negligible,” Andy Skuce

Check original data

All the Berkeley Earth data and analyses are available online at http://berkeleyearth.org/data/.

Plot your own temperature trends with Kevin's calculator.

Or plot the differences with rural, urban, or selected regions with another calculator by Kevin

NASA GISS Surface Temperature Analysis (GISSTEMP) describes how NASA handles the urban heat effect and links to current data.

NOAA Global Historical Climate Network (GHCN) DailyGHCN-Daily contains records from over 100,000 stations in 180 countries and territories.

Last updated on 27 May 2023 by John Mason. View Archives

Printable Version  |  Offline PDF Version  |  Link to this page

Argument Feedback

Please use this form to let us know about suggested updates to this rebuttal.

Related Arguments

Further reading

Denial101x video

Here is a related lecture-video from Denial101x - Making Sense of Climate Science Denial

Additional video from the MOOC

Kevin Cowtan: Heat in the city

Comments

Prev  1  2  3  4  5  6  7  8  9  10  11  12  13  14  15  16  17  18  19  20  Next

Comments 151 to 175 out of 530:

  1. I'd like to be able to graph historical met station data for a given site over its entire history. So far, I have not yet found access to such a data collection Chris Shaker
  2. Try the links at: here and here Way to go, by the way. Nothing better than getting your hands dirty with the real data. Just be sure to read up the metadata and also data processing, especially homogenising. Any long term record will have changed thermometers, screens, maybe location, reading time, many many times. Its not a trivial job doing those corrections. Homogenised records can be got from GHCN sources.
  3. Your opinions about RC nor tamino are irrelevant. They usefully include pointers to where to download data from. That is what you want. Education about real science is not marketing.
  4. A friend pointed me at: http://www.ncdc.noaa.gov/oa/climate/stationlocator.html I eventually got down to this web page: http://www.ncdc.noaa.gov/oa/mpp/digitalfiles.html#DIG They want $2,200 for the complete data set from 1901 to current, or $500 for the summary of each day from the 1800s As taxpayers, we get to pay their salaries, pensions, health care, and then we have to pay again to access our public data? I just looked at the RealClimate.org webpage again, where you suggested, and am currently looking at the raw data section http://www.realclimate.org/index.php/data-sources/#Climate_data_raw Chris Shaker
  5. At the suggestion of the moderator I will take an OT discussion from another post to here. referencing a comment in another thread I have a question related to the number of weather stations related to a given area. Why is it ok to have 8 data points (i.e. temperature stations) to represent a global region composed of a circle with a 1,500 km radius (which is what the GISS data does for the north pole area)? If you look at the dark red area on the picture below and then click on the center of that dark red region on the GISS site you'll only find 8 sites that have continuous measurements over the past several decades (continuous through 2011). and here is a link to a screen capture showing the list of stations that are less than 1,500 km from the point I clicked.
  6. Without knowing exactly where you clicked it is hard to know how to answer but certainly there are issues such as data sparsity in the north. That being said UAH uses polar interpolation also for the region 82.5-90 N. As i've pointed out before, NCEP reanalysis and ECMWF reanalysis which include satellite, weather balloon and all available station data support GISS's interpretation of the Arctic. As a polar researcher myself we have a lot of respect particularly for the quality of the ECMWF data and feel it is an accurate portrayal of Arctic trends.
  7. Update to the Berkeley Earth Science Temperature study 'controversy': Watt$ made it up. Anyone surprised?
  8. That's because the raw data is restricted by intergovernment agreements ( - Musings about conspiracy theories snipped- ) to three data centres. He makes the clear the debate is not over and that mean temperatures have no physical meaning- its a descriptor of the system.

    Response:

    [DB] Please refrain from baseless speculations. And you are simply incorrect on the data being restricted to 3 data centers. In the vast majority of cases, the data is available upon request from producing nations.

  9. And as we have repeatedly told you, temperature record is not about mean data temperature. This is a strawman argument. Didnt you even read the links we gave you? I youtube lecture is not a citation.
  10. scaddenp I did look at your links- first one is faulty. The second is a bunch of lame excuses
    Response: [DB] Both links work quite well. If you have issues with discussing climate science, using the scientific method with the intended goal of gaining greater understanding of the science, then perhaps Skeptical Science is not the best place for you.
  11. 160 cloa513- both links work for me - and the 2nd is full of links to data sources as you asked for. Maybe you should try another browser or check your computer for malware?
  12. I think there may be some confusion about what links are being referred to. Not the data links to chris shaker. To cloa513, moderator pointed to useful links in response to post here I pointed to other useful data (eg Hansen agreeing that mean global temperature isnt useful so dont us it) and actual methodology in posts 143 and 144. Both work. In essence, the arguments about mean global temperature are a strawman. The arguments against it are quite valid but the methodology being rebutted is not the methodology used for examining global temperature trends. The actual methodology (average anomaly) is pointed to by link and the papers that support it reveal decades of testing of the method validity. What cloa513 hasnt done is presented a contrary argument against this. Cloa513 - a debate of substance would include a statement about what you thought was excuses and particularly why you thought it was lame. The question really at hand is whether the globe is warming or not. You seem to contending that we dont know about method is flawed (but you havent examined the real method) plus some speculative FUD. You are also noting that other evidence of warming is provided by satellites tropospheric measurement (which is independent of ground measurement), sealevel rise and glacial retreat. If you are of one opinion now, you need to ask yourself what data would make you change you mind.
  13. I looked at the links through RealClimate.org The US Government site provides no data or garbage numbers like 4000 lots of -1936. Someone should complain about their garbage. Some useful data in the rest. CISL- its none of your business or your parent organisation- who I am nor should you restrict data access in any way. Needing the request data is a scientific disgrace- its all our tax dollars.
  14. cloa "The US Government site provides no data or garbage numbers" What are you talking about? Data downloadable for free here, zipped here and graphics here. "its all our tax dollars." Ah ha: 'I can't find what I'm looking for, so they're wasting our tax dollars.' Anyone for tea?
  15. Well a great many people have managed to use this data. eg look at this and you will guides to understanding the odd numbers and how to process if you look. What exactly were you trying to download from CISL? (their data, their rules - oil companies certainly cant download government data here without telling us who they are). While its great that you are looking at the data, you also should satisfy yourself about the methodology. (ie neither GISS, Hadcrut, nor noaa are trying to calculate a global mean temperature and that the anomaly data really is stable and spatially highly correlated).
  16. garythompson @155 The station list you present looks like it is from a point in the northern Norwegian Sea. Don't forget this map is for land & ocean index, not just land. the predominant data for that region would be ocean SST data. GISTEMP uses ocean data in preference to land data when the land area is very small - look at the Chatham Islands in the South Pacific as a good example of this. Do runs for Land only, Ocean only and Land & Ocean. Look at the tabulated data for each run. The land data isn't used at all in the combined series. Also the use of data out to 1200 km is part of the standard algorithm for GISTEMP. However temps frpm 1200 k's out only have a small weighting at the centre. The basis for this 1200 range is the original research behind GISTEMP showing strong correlation between anomaly changes out to 1200 kms. Currently I am working on a post on another subject. Following that I plan a series of posts on surface temperature measurement that I hope will clarify some of these things.
  17. Surprise! Professor Muller says that the IPCC temperature trend information is reasonable http://us1.campaign-archive2.com/?u=d8548cad5e5305433c810b0d4&id=fc86e0f3ab&e=36d50f5714 "In Summary Despite potential biases in the data, methods of analysis can be used to reduce bias effects well enough to enable us to measure long-term Earth temperature changes. Data integrity is adequate. Based on our initial work at Berkeley Earth, I believe that some of the most worrisome biases are less of a problem than I had previously thought."
  18. #158 For those who would still ignore our two most famous french deniers, here is the letter, from climate scientists references to instances of the French scientific research, that details their fallacy arguments : a taste of skepticalscience method with french sauce. So here are the perfect rebuttals lists to the Allègre's book and the Courtillot's conference.
  19. I do not wish to engage in an esoteric argument over the reliability of data sets that support the abstraction called global mean temperature. { snip - Several paragraphs of esoteric argument over the ... removed, as per your wish. } As a skeptic I do not wish to engage in arguments over just how to interpret the chicken guts but to ask a more fundamental question: Prove that it exists and that you can measure it. { snip - several paragraphs of arguments over chicken guts removed as per your wish } This is very powerful stuff. {snip }
    Response: [muoncounter] Read the Comments Policy and refrain from quasi-religious ranting. Form an argument based on science and evidence and we'll have something to discuss. Off-topic comments are deleted.
  20. Bruce Frykman @169, it is very plain that like the mean number of children per family, mean global surface temperature is a statistical concept. That does not mean it conveys no useful information, or no physically significant information. If the mean number of children per family in the US rises from 2.3 to 2.4, then all else being equal we can predict both that the US population will grow, and that the ratio of elderly to younger people will reduce, if the pattern persists. The increase in population is a real, physical effect even if we are certain that there is no household in the US containing 0.4 of a child. In like manner, if the mean surface temperature of the Earth increases, we can confidently predict that there will be a reduce mass of water stored as snow and/or ice; and that there will be an increase in the mass of water vapour in the atmosphere. Those are real physical effects, and that their prediction is based on change in a statistical measure makes no difference to the real physical consequences of that change. So, at the very best, your position has the same intellectual poverty as that of a person arguing that there cannot be a mean number of children in a family because there is no such thing as 0.4 of a child. In fact, your position is substantially worse. Climate scientists make predictions by taking a variety of well evidenced physical laws, taking data of actual humidities, precipitations, atmospheric temperatures and compositions, and temperatures at particular locations, and determining the consequences of that set of laws with those initial conditions. Some of the consequences are predicted values for statistical measures. Those values can be compared with values for the statistical measures determined by observation, to either refute or confirm the predictions. One of those statistical measures is the mean global surface temperature - and the agreement between the value determined by measurement and that determined by theory is confirmation of the theory. So your argument is not only wrong headed, showing a fundamentally flawed understanding of the nature of statistical measures - but it is simply obscurantist. It has all the intellectual merit of a head in the sand. The sad thing is that by dressing your obscurantism and ignorance up in a semi-plausible rhetoric you may well fool some people. Just not those who think.
  21. Bruce, see comment #144. Hansen agrees with you about global mean temperature. That's why they dont track temperature trends that way. Read up and how it is actually done and the evidence supporting the methodology. You are attacking a strawman.
  22. With May 2 the NCDC changed the dataset and calculation. This change has a very strange effect. The NCDC uses the period of 1901-2000 as reference. With the "correction" (if one really will call it this way) the anomalies from beginning of the reference (1901) until the mid 50th are lowered while all other following values rised. Of course, not in significant ranges. But having this three or four times happened we will see differences to previous calculations in a significant range of approx. 0.1K. So the question arises again: are the data reliable?
    Response:

    [DB] Hey, progress happens.  You're not against improvements to increase accuracy, right?  After all, insinuations of something nefarious are beneath us...especially when the details of the change are made transparent, as you note.

  23. Yes, I agree with you regarding the need of progress. But if the progress looks like this, it is a bit odd. I made it by myself with a simple Excess table which compares the GHCN-M version 2 with the version 3 regarding the yearly anomalies. And it looks ... strange.
    Response:

    [DB] This is a science-based website.  Merely attaching an "odd" or "strange" appellation/connotation to something adds nothing positive to the dialogue.  If you have constructive criticism of the changes you reference you will need to perform a more robust analysis to back up your "insinuations" (which veer into Comment Policy violation status...).

  24. What I did is just to download the data of version 2 and of version 3, copy them in an Excel sheet (sorry for misspelling above), compared them and made a graphical output. As scientific as a simple comparison can be. I had used the original (NCDC) data to show that there is an odd behaviour when making the recent update of data and methods. OK, I should have linked these data in the comments before. Sorry for that. The summary of the changes that you mentioned does not explain the behavior of the corrections at all. It is not apparent why the first half of the last century should have been overestimated while the rest until now should have been underestimated. Even if one would follow the statements, the behavior in general or the reason are quite unclear. This, of course, is odd and it really creates doubts. It is nearly impossible for an outstanding to follow these procedures, even if there are summaries. But this would be an off-topic question about scientific transparency. If you look on top and read the question of this topic, my answer would be (and i've tried to show it with actual data) "there are doubts, indeed". But I wonder how you can accuse me to make "insinuations" although the data speak a very clear tongue.
    Response: [e] Please review the advanced version of this post. The raw data has been analyzed and plotted several different ways by several different organizations and citizen scientists. The result is always the same. Implying wrongdoing simply because you do not understand one of these reconstructions is not a valid scientific argument and is a violation of this site's comment policy.
  25. JoeRG wrote: "It is not apparent why the first half of the last century should have been overestimated while the rest until now should have been underestimated." You do realize that the 'change' in the trendline is 0.0002 C per year, right? If you find that to "really create doubts" it doesn't seem like this has anything to do with logic or reality. The variation between the old and new results is a tiny fraction of the stated margin of error and leaves these anomalies still in close agreement with the GISS, NASA, UAH, RSS, and other data sets.

Prev  1  2  3  4  5  6  7  8  9  10  11  12  13  14  15  16  17  18  19  20  Next

Post a Comment

Political, off-topic or ad hominem comments will be deleted. Comments Policy...

You need to be logged in to post a comment. Login via the left margin or if you're new, register here.

Link to this page


The Consensus Project Website

THE ESCALATOR

(free to republish)


© Copyright 2024 John Cook
Home | Translations | About Us | Privacy | Contact Us