Sun & climate: moving in opposite directions
What the science says...
| Select a level... |
 Basic
Basic
|
 Intermediate
|
 Advanced
| ||||
|
The sun's energy has decreased since the 1980s but the Earth keeps warming faster than before. |
|||||||
Climate Myth...
It's the sun
"Over the past few hundred years, there has been a steady increase in the numbers of sunspots, at the time when the Earth has been getting warmer. The data suggests solar activity is influencing the global climate causing the world to get warmer." (BBC)
At a glance
Thankfully for us, our Sun is a very average kind of star. That means it behaves stably over billions of years, steadily consuming its hydrogen fuel in the nuclear reaction that produces sunshine.
Solar stability, along with the Greenhouse Effect, combine to give our planet a habitable range of surface temperatures. In contrast, less stable stars can vary a lot in their radiation output. That lack of stability can prevent life, as we know it, from evolving on any planets that might orbit such stars.
That the Sun is a stable type of star is clearly demonstrated by the amount of Solar energy reaching Earth's average orbital position: it varies very little at all. This quantity, called the Total Solar Irradiance, has been measured for around forty years with high accuracy by sensitive instruments aboard satellites. Its average value is 1,362 watts per square metre. Irradiance fluctuates by about a watt either way, depending on where we are within the 11-year long sunspot cycle. That's a variation of no more than 0.15%.
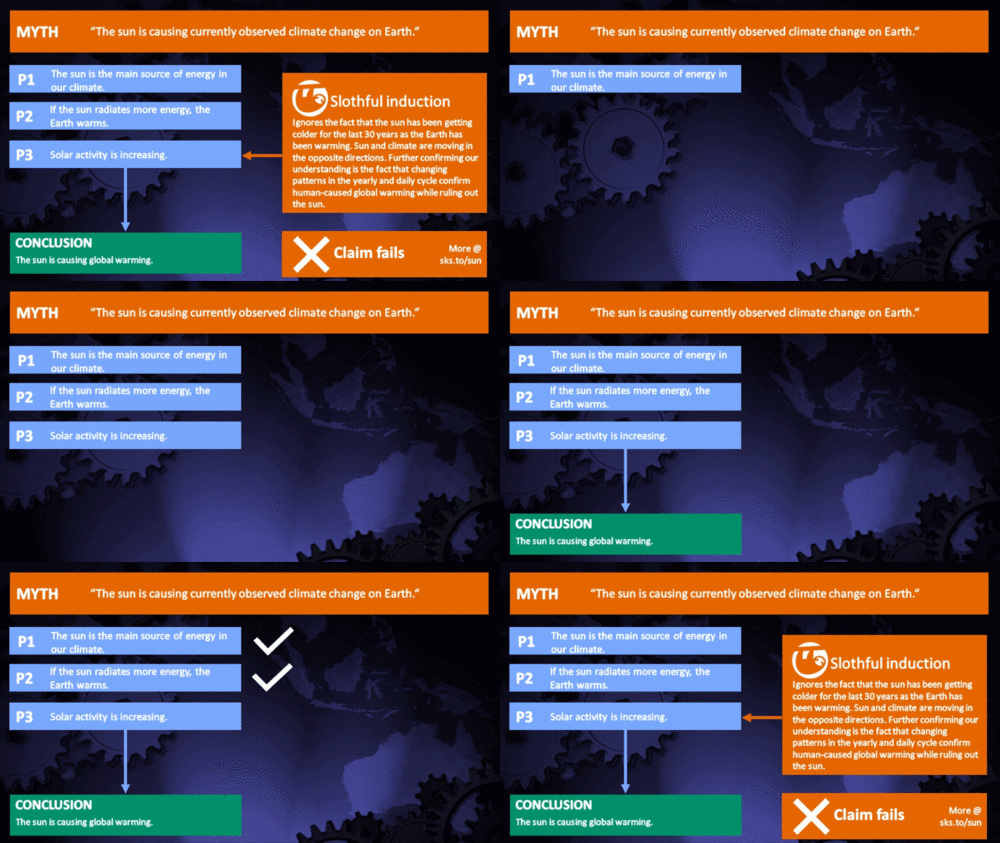
From the early 1970s until today, the Solar radiation reaching the top of Earth's atmosphere has in fact shown a very slight decline. Through that same period, global temperatures have continued to increase. The two data records, incoming Solar energy and global temperature, have diverged. That means they have gone in opposite directions. If incoming Solar energy has decreased while the Earth continues to warm up, the Sun cannot be the control-knob of that warming.
Attempts to blame the sun for the rise in global temperatures have had to involve taking the data but selecting only the time periods that support such an argument. The remaining parts of the information - showing that divergence - have had to be ditched. Proper science study requires that all the available data be considered, not just a part of it. This particular sin is known as “cherry-picking”.
Please use this form to provide feedback about this new "At a glance" section, which was updated on May 27, 2023 to improve its readability. Read a more technical version below or dig deeper via the tabs above!
Further details
Our Sun is an average-sized main sequence star that is steadily using its hydrogen fuel, situated some 150 million kilometres away from Earth. That distance was first determined (with a small error) by a time consuming and complex set of measurements in the late 1700s. It led to the first systemic considerations of Earth's climate by Joseph Fourier in the 1820s. Fourier's number-crunching led him to realise a planet of Earth's size situated that far from the Sun ought to be significantly colder than it was. He was thereby laying the foundation stone for the line of enquiry that led after a few decades to the discovery of what we now call the Greenhouse Effect – and the way that effect changes in intensity as a response to rising or falling levels of the various greenhouse gases.

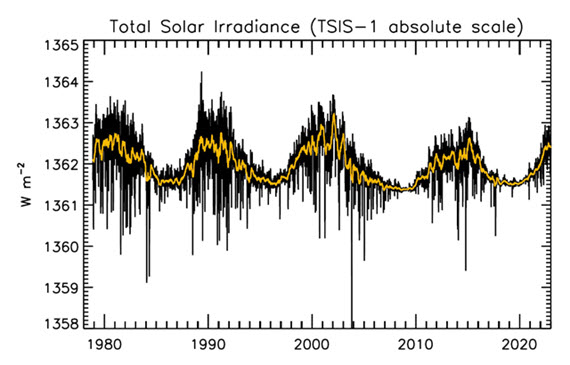
Figure 1: Plot of the observational record (1979-2022) on the scale of the TSIS-1 instrument currently flying on the space station. In this plot, the different records are all cross calibrated to the TSIS-1 absolute scale (e.g., the TSIS1-absolute scale is 0.858 W/m^2 higher than the SORCE absolute scale) so the variability of TSI in this plot is considered to be its “true variability” (within cross calibration uncertainties). Image: Judith Lean.
The Sun has a strong magnetic field, but one that is constantly on the move, to the extent that around every 11 years or so, Solar polarity flips: north becomes south, until another 11 years has passed when it flips back again. These Solar Cycles affect what happens at the surface of the Sun, such as the sunspots caused by those magnetic fields. Each cycle starts at Solar Minimum with very few or no sunspots, then rises mid-cycle towards Solar Maximum, where sunspots are numerous, before falling back towards the end. The total radiation emitted by the Sun – total solar irradiance (TSI) is the technical term – essentially defined as the solar flux at the Earth's orbital radius, fluctuates through this 11-year cycle by up to 0.15% between maximum and minimum.
Such short term and small fluctuations in TSI do not have a strong long term influence on Earth's climate: they are not large enough and as it's a cycle, they essentially cancel one another out. Over the longer term, more sustained changes in TSI over centuries are more important. This is why such information is included, along with other natural and human-driven influences, when running climate models, to ask them, “what if?"
An examination of the past 1150 years found temperatures to have closely matched solar activity for much of that time (Usoskin et al. 2005). But also for much of that time, greenhouse gas concentrations hardly varied at all. This led the study to conclude, "...so that at least this most recent warming episode must have another source."

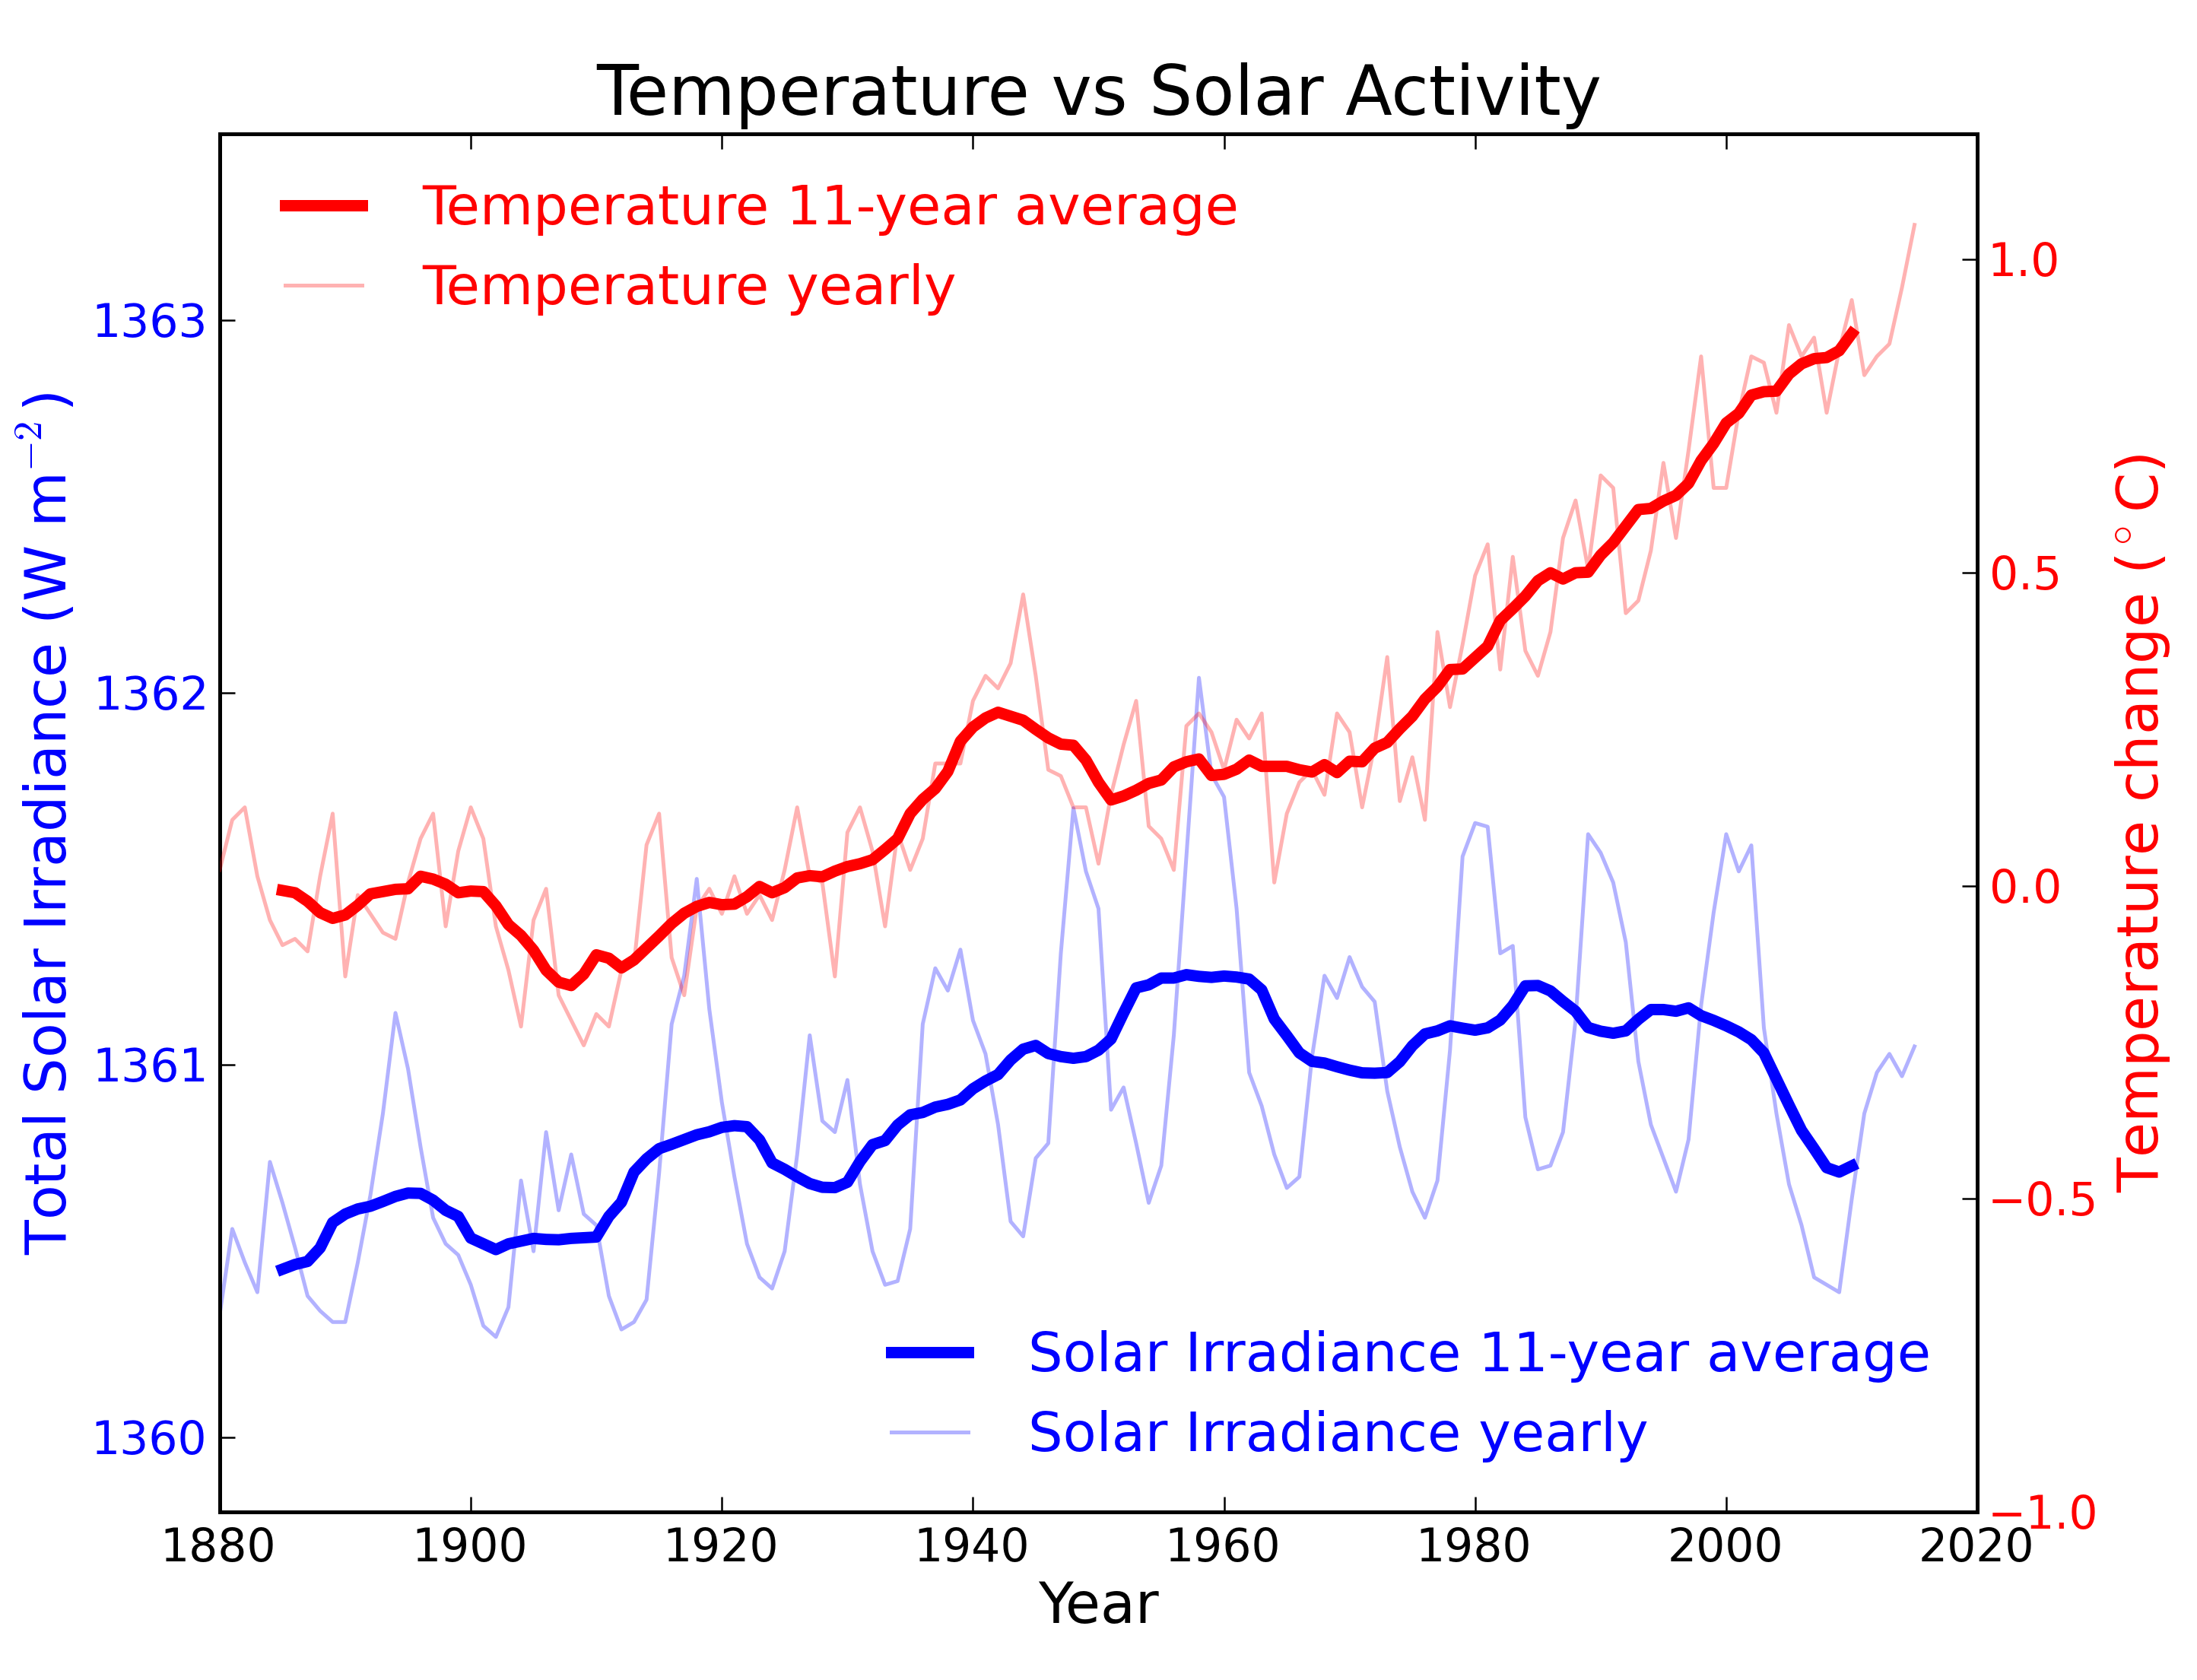
Figure 2: Annual global temperature change (thin light red) with 11 year moving average of temperature (thick dark red). Temperature from NASA GISS. Annual Total Solar Irradiance (thin light blue) with 11 year moving average of TSI (thick dark blue). TSI from 1880 to 1978 from Krivova et al. 2007. TSI from 1979 to 2015 from the World Radiation Center (see their PMOD index page for data updates). Plots of the most recent solar irradiance can be found at the Laboratory for Atmospheric and Space Physics LISIRD site.
The slight decline in Solar activity after 1975 was picked up through a number of independent measurements, so is definitely real. Over the last 45 years of global warming, Solar activity and global temperature have therefore been steadily diverging. In fact, an analysis of solar trends concluded that the sun has actually contributed a slight cooling influence into the mix that has driven global temperature through recent decades (Lockwood, 2008), but the massive increase in carbon-based greenhouse gases is the main forcing agent at present.
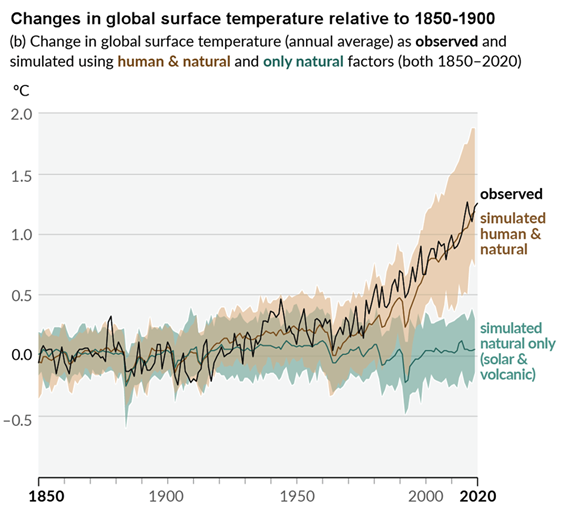
Other studies tend to agree. Foster & Rahmstorf (2011) used multiple linear regression to quantify and remove the effects of the El Niño Southern Oscillation (ENSO) and solar and volcanic activity from the surface and lower troposphere temperature data. They found that from 1979 to 2010, solar activity had a very slight cooling effect of between -0.014 and -0.023°C per decade, depending on the data set. A more recent graphic, from the IPCC AR6, shows these trends to have continued.
Figure 3: Figure SPM.1 (IPCC AR6 WGI SPM) - History of global temperature change and causes of recent warming panel (b). Changes in global surface temperature over the past 170 years (black line) relative to 1850–1900 and annually averaged, compared to Coupled Model Intercomparison Project Phase 6 (CMIP6) climate model simulations (see Box SPM.1) of the temperature response to both human and natural drivers (brown) and to only natural drivers (solar and volcanic activity, green). For the full image and caption please click here or on the image.
Like Foster & Rahmstorf, Lean & Rind (2008) performed a multiple linear regression on the temperature data, and found that while solar activity can account for about 11% of the global warming from 1889 to 2006, it can only account for 1.6% of the warming from 1955 to 2005, and had a slight cooling effect (-0.004°C per decade) from 1979 to 2005.
Finally, physics does not support the claim that changes in TSI drive current climate change. If that claim had any credence, we would not expect to see the current situation, in which Earth's lower atmosphere is warming strongly whereas the upper atmosphere is cooling. That is exactly the pattern predicted by physics, in our situation where we have overloaded Earth's atmosphere with greenhouse gases. If warming was solely down to the Sun, we would expect the opposite pattern. In fact, the only way to propagate this myth nowadays involves cherry-picking everything prior to 1975 and completely disregarding all the more recent data. That's simply not science.
Longer-term variations in TSI received by Earth
It's also important to mention variations in TSI driven not by Solar energy output but by variations in Earth's orbit, that are of course independent of Solar activity. Such variations, however, take place over very long periods, described by the Milankovitch orbital cycles operating over tens of thousands of years. Those cycles determine the distance between Earth and the Sun at perihelion and aphelion and in addition the tilt the planet's axis of rotation: both affect how much heat-radiation the planet receives at the top of its atmosphere through time. But such fluctuations are nothing like the rapid changes we see in the weather, such as the difference between a sunny day and a cloudy one. The long time-factor ensures that.
Another even more obscure approach used to claim, "it's the sun" was (and probably still is in some quarters) to talk about, "indirect effects". To wit, when studies can't find a sufficiently large direct effect, bring even lesser factors to the fore, such as cosmic rays. Fail.
In conclusion, the recent, post 1975 steep rise in global temperatures are not reflected in TSI changes that have in fact exerted a slight cooling influence. Milankovitch cycles that operate over vastly bigger time-scales simply don't work quickly enough to change climate drastically over a few decades. Instead, the enormous rise in greenhouse gas concentrations over the same period is the primary forcing-agent. The physics predicted what is now being observed.
Last updated on 27 May 2023 by John Mason. View Archives


 Arguments


I will post a separate comment with what I consider to be the failings in his efforts, but I don't want to diminish them. He was an intelligent and yet uneducated (formally) man who took wholeheartedly to his hobby, pursued it with intelligence and diligence, and whether correct in his conclusions or not he demonstrated both a humility and an investment in the importance of the subject which now deserves respect, not derision. But I would ask you to read his book a little more closely, and to read between the lines, imagining what he might say today, faced with the mounting evidence, rather than what you perceive that he had said back then. He is at a disadvantage in having you as his only advocate. I believe you owe it to him to consider all of his words, and what he himself seemed more than ready to accept, which is the idea that he might be wrong, that it is frighteningly important to be right about this, and that doing so -- being right -- means being willing to always keep an open mind, and to always adjust your reasoning to the facts as they become available.
There is no mention of the development of the basic tenet of the book (ie. The Ratios Principle)or its subsequent and future application. The assertion that A S Gaddes only depended on Australian Rainfall records is erroneous.He very much used Deep Ice Core And Tree-ring data to generate his tables. His discussion of the importance of volcanic activity has not been 'nailed down' by current Climate Science, it is in fact ignored or considered irrelevant. What caused the so called 'La Nina' events in Southern Australia at the time of the eruption of Mt Pucon in Mexico 2011? Or the bitterly cold Northern Hemisphere winter at the time of the eruption of Eyjatjallajokull in Iceland? Finally,(for the moment,) are the forecasts generated by the Ratios Principle correct? If they are then the 'method' must have had something to do with it. It took me many readings to 'understand' this work, I expect it will take those more astute and qualified than myself more than one reading.[DB] Again you continue to prosecute your agenda of curve-fitting without plausible, physical mechanisms for support nor do you provide testable references. As such you are a practitioner of climastrology.
As noted earlier, pick the element you feel strongest about & post on it on the most appropriate thread. Further comments of this nature constitute Gish Gallop and will perforce be deleted. Failure to follow this guidance is cause for a rescinding of posting privileges.
No further warnings shall be given.
See (921) for my answer to the queries on temperature readings (or lack of them.)The Ratios Principle predicts 'Dry Cycles' not Heat Fluctuations.I suspect the current predilection for temperature fixation is just an attempt to 'prop up' AGW. For the queries on Drift of Magnetic Field. It is my understanding that the Earth revolves around the Sun once every Earth/Solar Year, 360 degrees, 30 degrees/month. I believe we are accompanied on this journey by our Magnetic Field. Does the Magnetic Field 'drift, undulate, waft or cavort?' Probably all of the above. I stand by the 'Ratios Principle' and the methods used to obtain it. Apart from my own observations it should be perfectly simple for anyone to check the veracity of the forecasts from 1976 (or before,)to 2011. KR(939) I appreciate your 'moderate approach' The Metonic cycle of the Moon's Nodes is an important 'Constant' in the Ratios Principle calculation. It appears to affect the severity and duration of 'Dry Cycles.' (see where the Metonic Cycle appears in the Forecast Tables, and accompanying comments.)Perhaps you can use Sphaerica's copy,(apparently he wont be using it any more.) It is now cold and dry in America, 'physically indicating' the predicted passage of the 'Dry Cycle' due to reach Australia in early January 2012.[DB] "Does the Magnetic Field 'drift, undulate, waft or cavort?' Probably all of the above."
Now you resort to trolling by argumentarium. If you honestly cannot understand what you are talking about in this point you must then also summon the intellectual honesty to admit it and then get more knowledge.
"Apart from my own observations it should be perfectly simple for anyone to check the veracity of the forecasts from 1976 (or before,)to 2011."
Eyecrometers do not cut it in science. You must perform statistical significance tests to provide a scientific basis for your claims. You still practition climastrology as a result.
"It appears to affect the severity and duration of 'Dry Cycles.'"
IBID.
"It is now cold and dry in America"
Winter approaches. For many parts of America this means rain, not drought. Or do include the seasons in your collection of semimythical cycles?
Either step it up and provide real scientific evidence (via significance testing) to support your extraordinary claims (which bear the burden of proof of extraordinary evidence to support them) or take your agenda elsewhere. Many "alternatives-to-science" blogs exist that will gladly welcome you.
Evasion struck out.
[DB] Point taken. ;)
[DB] You were warned here to provide significance testing to support your claims. Failing that, to provide links to peer-reviewed articles published by working scientists in the field in scientifically relevant papers (in this comment here).
The comments that you posted that failed to follow this course of action were deleted. As will subsequent comments, unless you step it up with the requisite testing and citations. Nothing you have presented thus far meets those standards.
Your practice thus far is to employ circular reasoning:
A continuation of this course of action is simply wasting everyone's time.