


 Arguments


Correcting myths about the cost of clean energy
Posted on 23 September 2024 by dana1981
This is a re-post from Yale Climate Connections
After decades of stable electricity prices, U.S. residents have seen their rates rise by one-third over the past four years.
The fossil fuel lobby and some Republican politicians are exploiting the opportunity to falsely place the blame on clean energy sources.
“We are going to get the energy prices down,” former President Donald Trump said at an August 2024 rally in Wisconsin. “You know, this was caused by their horrible energy – wind.”
In reality, wind is the cheapest source of new power in the United States today.
It’s true that electricity from wind and sunshine is intermittent, depending on the weather and time of day. So these power sources require building more energy storage and electrical transmission lines. But their fuel is free, unlike fossil fuels, whose prices vary wildly.
A plethora of evidence, including real-world electricity rates and power generation mixes, demonstrates that wind and solar energy tend to reduce electricity prices compared to fossil fuels. Bottom line: Electricity prices have generally increased for the same reason as everything else – inflation.
Some states with lots of cheap renewables have low electricity rates
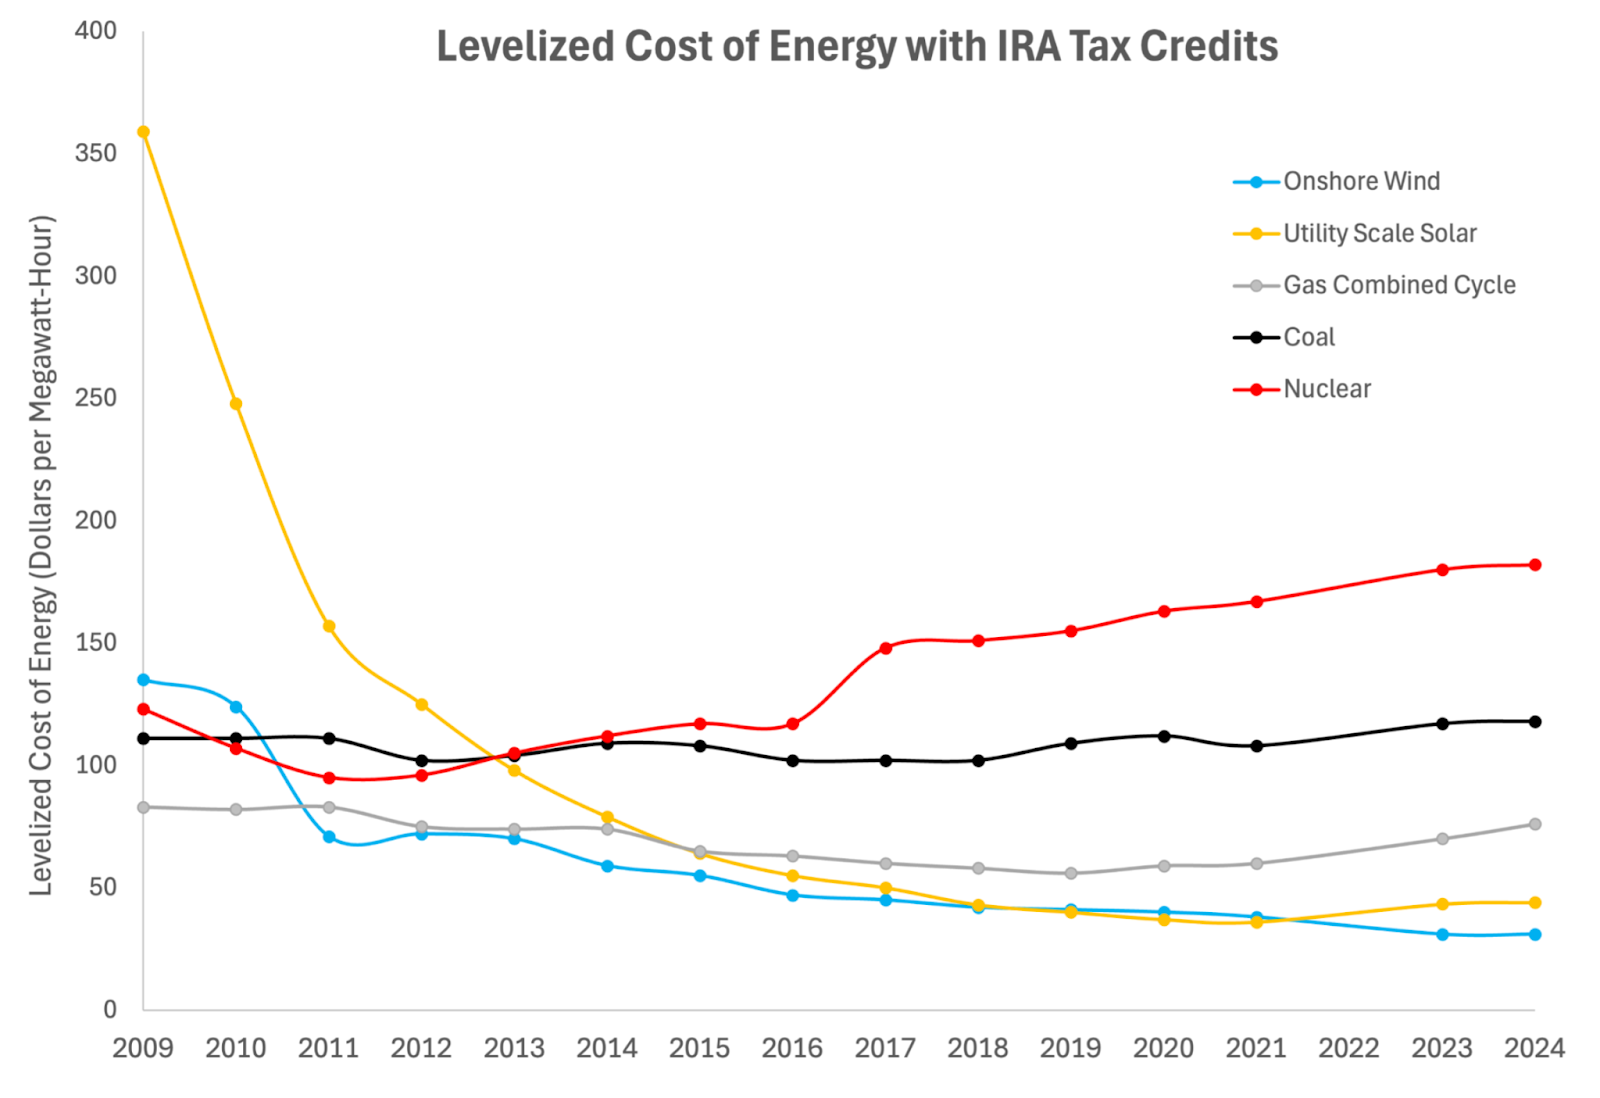
Wind energy has been the cheapest source of new electricity in the U.S. for about a decade, according to the Lazard financial services company’s annual levelized cost of energy report.
This analysis accounts for the cost of electricity generation over the lifetime of the source, including factors like capital, operations and maintenance, fuel costs, financing, and utilization rates. In other words, it accounts for the fact that wind and solar power are intermittent. They are nevertheless the two cheapest sources of new power available in the U.S. today, especially when including clean energy tax credits from the 2022 Inflation Reduction Act, or IRA.
Because wind power has been cheap for a long time, many states in the windy central U.S. have installed a lot of wind turbines. These states provide a real-world test of the effect that deploying renewable energy has on electricity rates. As the chart below illustrates, many of the states with the highest percentage of wind and solar generation, like Iowa, the Dakotas, Kansas, Oklahoma, and New Mexico, have among the lowest electricity prices in the country. And a 2023 report by University of Texas at Austin research associate Joshua Smith estimated that renewables reduced electricity rates by about 13% in that state from 2018 to 2022.
Why are electricity rates rising?
U.S. electricity rates have long been stable, generally deviating no more than plus or minus 10% from the national average of about 15 cents per kilowatt-hour. But since 2022, national electricity prices have risen to nearly 20% above the long-term average, approaching 18 cents per kilowatt-hour.
A recent report from the energy and climate policy think tank Energy Innovation, a Yale Climate Connections partner, sought to identify the causes of those electricity rate increases. The title of the report didn’t leave readers in suspense: "Clean Energy Isn’t Driving Power Price Spikes.”
Instead, as a result of inflation caused largely by the COVID-19 pandemic, the cost of virtually everything has increased over the past several years. The Energy Innovation report notes that American electricity rates since 2010 have risen at the same rate as inflation. But electricity bills have increased more slowly due to improved home energy efficiency: Energy-efficient appliances and light bulbs mean families can keep the lights on (and the dishes washing) while consuming less electricity, for example.
Some states experienced bigger electricity price increases than others. Energy Innovation concluded that the most expensive rate increases happened in states with more fossil-fueled power generation. The report found that many utilities have continued to invest significant amounts of money in aging, expensive coal power plants. And it noted that “the states most reliant on natural gas for electricity generation were among those with the highest rate of retail price increases as gas prices surged since 2020,” in large part because “Russia’s invasion of Ukraine left Europe scrambling to reduce dependence on Russian gas, driving gas prices in the U.S. up by a factor of four in a matter of months.”
 Source: Energy Innovation with dashed trendline added by Dana Nuccitelli.
Maintaining and upgrading the power grid also adds costs. Many of America’s electrical transmission and distribution lines were built over 50 years ago and need to be replaced and modernized. And electricity demand is growing due to factors like expanding data centers, artificial intelligence, and the electrification of vehicles and buildings. But most of those infrastructure upgrades are necessary regardless of where we get our electricity from.
Wildfires, not renewables, are driving rate increases in California
California has the highest electricity rates in the continental United States, and about one-third of its electricity is generated from renewables. (It’s worth noting that household energy bills in California are close to the national average because the state has invested heavily in energy efficiency, so though electricity rates are high, electricity consumption is low.)
Electricity rates have risen rapidly in California over the past few years, primarily as a result of wildfire risk. The utility Pacific Gas & Electric was held liable for the over $16 billion in insured losses caused by the Camp Fire that swept through the city of Paradise in 2018. Since that disaster, California electrical utilities have been forced to fund wildfire risk insurance pools, wildfire prevention measures, improved power grid resilience, and other wildfire-related costs. According to the California Public Utilities Commission, wildfire-related costs have been responsible for most of the rise in state electricity rates.
Research has shown that climate change is a wildfire “threat multiplier” that has doubled the area burned by California wildfires over the past 30 years. One of the most important ways to lessen those risks and avoid worsening wildfires and the resulting rise in electricity rates is to deploy climate solutions like solar and wind power.
Ultimately, the Energy Innovation report determined that wind and solar energy are solutions to, not causes of, rising electricity prices.
“The volatility of fossil fuel prices, the cost of climate-driven wildfires, and surging spending on aging infrastructure all contribute to rising rates,” the report concluded, “while falling costs of clean energy can help to offset these factors.”


The Labour Government in the UK are in a rush to get to get clean energy by 2030. Due to the last Conservative Government there are few onshore wind turbines in the UK, but their planning permission allows them to be made taller to take bigger blades, and if we add the maximum height allowed by the planning permission we can approximately triple the amount of electricity generated. And of course the infrastructure is already built so we can triple onshore wind turbine electricity in months. This is a win win as infrastructure takes a long time to put in, and at great expense. Great British Energy can hit the ground running by picking the lowest hanging fruit. Octopus Energy is already buying up 10% of our onshore wind turbines to heighten our onshore wind turbines, and we can do the other 90% by paying the owners to do the work, or nationalizing them.
US energy Information Adminstration has an excellent comment on why LCOE is not used by the electric generation industry in planning for plant expansion, primarily because LCOE doesnt capture all the costs and value of the different sources of generation
"LCOE is limited because it only reflects the cost to build and operate a plant, but not the value of the plant to the grid"
See page 9 of the pdf in the attached link.
www.eia.gov/outlooks/aeo/electricity_generation/
A couple of other observations with Chart created by Nuccitelli =
Lazards report shows the LCOE range for the various types of electric generation sources
Wind Onshore $27-$73
Solar utility $29-$92
Gas combined $45-$108 (which includes base gas generation and peak generation)
Coal $69-$168
The two observations are why does Nuccitelli's chart use the low end of the range for solar and wind LCOE while showing the upper mid range for gas?
The second question is why the LCOE computation used by lazards for gas include both baseload costs and peaker costs (peaker costs being the highest cost for all sources of electric generation) and then comparing to the LCOE for wind and solar when they dont perform in that space?
thanks for an explanation
David-acct @2 ,
you are quite correct, in that pricings ought to cover external costs.
Also, the projected future costs.
Thus the costs should be shown in several categories :-
(A) The immediate LCOE, and projected costs at 5, 10, and 20 years.
(B) Immediate and projected total grid costs.
(C) A range of amortisations regarding environmental and projected societal costs.
*
Of course, (C) is the most difficult to estimate. Yet important, in both dollar and non-dollar terms.
And (A) ventures into guesstimations of changes in technology.
But we should always be looking at the bigger picture.
David-acct:
You appear to have cited the incorrect page in the EIA report. Page 9 does not discuss LCOE as you suggest. LCOE is discussed on page 7. The EIA has a metric called LACE which. I do not remember seeing this metric before. It appears to me that the graph on page 7 shows that most of the wind and solar projects have good to outstanding LACE while none of the as projects have good LACE.
I note that on page 6 the EIA estimates that in 2028 approximately 30 GW of wind will be built, 20 GW of solar, 2 GW of gas and zero nuclear. I thought that was interesting because there is cursors solar under construction than wind. Obviously gas is on the way out.
I note that in the past the EIA has grossly underestimated the amounts of renewable energy to be built. The EIA cost of nuclear is half the Hazard cosr. The EIA has consistently underestimated nuclear costs in the past.
Nuccitelli clearly labels his graph as "Levelized cost of energy with IRA tax credits". You list the cost without the tax credits. Your assertion that Nuccitelli used the low end of the range for solar and wind LCOE is false. The comparable graph in the Lazard report (which does not include the taxes) states that the average of the high and low values are used. Nuccitelli used the average of the high and low values from the tax included table. The EIA report states that the average cost of construction of wind and solar is less than the average of the high and low
If you read the sources that you cite more carefully you will stop making obviously false claims. Please try to read more carefully, it is very time consuming for me to read all the citations to find errors.
Baseload plants cannot generate peak power and require back-up by peaker plants. Electricity in a traditional system always costs a lot more than the costs of the base load plants since during the day everyone is paid the peaker plant rate. Baseload plants make all their money during the day and often operate at a loss at night.. Renewable energy systems can supply all required power and require storage for times of low generation. Since the two systems work completely differently Lazzad has to compare the costs they think are most comparable
David-acct:
rn
You appear to have cited the incorrect page in the EIA report. Page 9 does not discuss LCOE as you suggest. LCOE is discussed on page 7. The EIA has a metric called LACE which. I do not remember seeing this metric before. It appears to me that the graph on page 7 shows that most of the wind and solar projects have good to outstanding LACE while none of the as projects have good LACE.
rn
I note that on page 6 the EIA estimates that in 2028 approximately 30 GW of wind will be built, 20 GW of solar, 2 GW of gas and zero nuclear. I thought that was interesting because there is cursors solar under construction than wind. Obviously gas is on the way out.
rn
I note that in the past the EIA has grossly underestimated the amounts of renewable energy to be built. The EIA cost of nuclear is half the Hazard cosr. The EIA has consistently underestimated nuclear costs in the past.
rn
Nuccitelli clearly labels his graph as "Levelized cost of energy with IRA tax credits". You list the cost without the tax credits. Your assertion that Nuccitelli used the low end of the range for solar and wind LCOE is false. The comparable graph in the Lazard report (which does not include the taxes) states that the average of the high and low values are used. Nuccitelli used the average of the high and low values from the tax included table. The EIA report states that the average cost of construction of wind and solar is less than the average of the high and low
rn
If you read the sources that you cite more carefully you will stop making obviously false claims. Please try to read more carefully, it is very time consuming for me to read all the citations to find errors.
rn
Baseload plants cannot generate peak power and require back-up by peaker plants. Electricity in a traditional system always costs a lot more than the costs of the base load plants since during the day everyone is paid the peaker plant rate. Baseload plants make all their money during the day and often operate at a loss at night.. Renewable energy systems can supply all required power and require storage for times of low generation. Since the two systems work completely differently Lazzad has to compare the costs they think are most comparable
Sorry about all the typos, I am out of town and it is difficult to type on my tablet.
The point of the article is "correcting myths about the cost of clean energy"
When compare costs of each type electric generation it is important to compare apples to apples.
Nuccitelli as you noted, uses the after tax credit LCOE cost for renewables. Those tax credits get paid by the consumer in the form of higher income taxes to cover the subsidy (subsidies arent free in macro economics) or paid by the consumer in the form of higher prices due to inflation which is the result of deficit spending. Thus using the after credit LCOE cost is hiding the full LCOE cost.
Without addressing your last paragraph directly, it should be pointed out the need to understand the fundementals of electric generation. Electric generation has three major tranches of electric generation demand. First there is baseload power demand, second there is intermediate level demand and third peaker level demand. Peaker demand is the most expensive tranche of demand because it is only needed when demand is high, Peaker has low fixed costs, but high marginal costs. That is generally okay since the peaker demand is infrequent. Baseload has high fixed costs though low marginal costs. Intermediate demand is the lowest cost of the three tranches.
Its also important to understand the fossil fuel, hydro, nuclear electric generation are all Demand constrained generation sources. Wind and Solar on the other hand are resource constrained, ie electric generation limited resources ie amount of wind.
It should be noted that Wind and solar perform very well in middle intermediate tranche of electric generation demand, while performing very poorly in the peaker demand tranche precisely due to their resource limitations.
With that background, when comparing costs across each type of electric generation source, it important to compare Baseload LCOE for gas, coal, nuclear against baseload LCOE cost for Wind and solar. Same with comparing Peaker LCOE cost for Gas, coal, against peaker LCOE cost for Wind and Solar. Its telling that Lazard's doesnt compare across each of the demand tranches.
As noted in the EIA article, its also quite telling that the industry does not use LCOE in plant generation planning because the LCOE doesnt provide any meaningful information for purposes of cost analysis.
lastly, my background is accounting and cost accounting, as such, it is much easier to spot and recognize inconsistencies in the presentations and representations than the layman.
David-acct @7
"Nuccitelli as you noted, uses the after tax credit LCOE cost for renewables. Those tax credits get paid by the consumer in the form of higher income taxes to cover the subsidy.
Yes but it should be noted that gas and coal fired powered generation and nuclear power also get very substantial tax credits or subsidies with costs passed onto consumers. All effects their LOCE numbers as well.
David-acct 8
I think M Sweets point about the electricity system might have been that criticising renewables based on the reliance on gas peaker plants is ultimately flawed because a fully renewables system would be generation and storage without a need for gas peaker plants. So your response quoting baseload and peaker plants doesnt address the point. We are talking about two completely different operating systems. Interesting though how the current system operates so good information in that respect.
David-acct at 7:
As Nigelj has pointed out, other energy sources besides renewable energy are heavily subsidized. Fossil fuel subsidies in 2022 were estimated at $7 Trillion, far more than subsidies for renewable energy.
Zero nuclear power plants world wide have been built without enormous subsidies since they are not economic.
David-acct at 8:
I do not need you to explain how electricity was generated in the 20th centuary. We are now replacing obsolete, polluting energy sources with cheaper, cleaner renewable sources. We need to evaluate how energy resources will contribute to a future renewable system. At the same time we want to keep prices down.
We currently have a hybrid system while the renewable system is being built. Renewable wind and solar can generate most needed power using existing peaker plants as storage. Old baseload plants cannot compete economically with cheap renewable energy. As more wind and solar is built obsolete plants are closing. Expensive coal and nuclear have closed first.
Batteries are now cheaper, more versatile and provide more grid support services than peaker plants. Batteries store extra power on sunny, windy days. As demonstrated by the EIA report you cited, (I note the EIA has always been biased against renewable energy in he past) the market is planning on building a lot of wind, solar and batteries in the next four years. Very litle, heavily subsidized, gas is planned. Everyone in the market can see the handwriting on the wall. The market is building out cheap renewables virtually everywhere in the world.
The professionals at Lazard. have chosen LCOE as the best metric to compare different technologies. The EIA report does not support your claim that obsolete technologies are cheaper than renewable energy. You have cited no authoritative sources to support your argument that Lazard is incorrect. Your argument that obsolete technology should be promoted is simply wrong.
In any case, the website Oil Price says all the best fracking sites in he USA have been tapped. Fracked wells decline in production very rapidly (just two or three years). Oil, gas and coal are finite resources that are declining. We have to build out a renewable system now before those nonrenewable sources run out.
I am surprised that someone with a background in cost accounting is so supportive of expensive, polluting, obsolete technologies when cheaper alternative sources are readily svailable.