First Look at HadCRUT4
Posted on 18 April 2012 by dana1981
Morice et al. (2012) explains the changes in HadCRUT4, which incorporates land temperatures from CRUTEM4 (as described by Jones et al. 2012) and sea surface temperatures (SSTs) from HadSST3 (as described by Kennedy et al. 2011 Part 1 and Part 2).
CRUTEM4 has been updated to include more data:
"US station data have been replaced with the newly homogenized US Historical Climate Network (USHCN) records [Menne et al., 2009]. Many new data have been added from Russia and countries of the former USSR, greatly increasing the representation of that region in the database. Updated versions of the Canadian data described in [Vincent and Gullett, 1999, Vincent et al., 2002] have been included. Additional data from Greenland, the Faroes and Denmark have been added, obtained from the Danish Meterological Institute [Cappeln et al., 2010, 2011, Vinther et al., 2006]. An additional 107 stations have been included from a Greater Alpine Region (GAR) data set developed by the Austrian Meteorological Service [Auer et al., 2001], with bias adjustments accounting for thermometer exposure applied [Böhm et al., 2010]. In the Arctic, 125 new stations have been added from records described in Bekryaev et al. [2010]. These stations are mainly situated in Alaska, Canada and Russia. See Jones et al. [2012] for a comprehensive list of updates to included station records."
HadSST3 includes both an increased number of SST measurements, and new adjustments for recently-identified biases. Gavin Schmidt provides a good discussion of some of the issues with historical SST measurements at RealClimate.
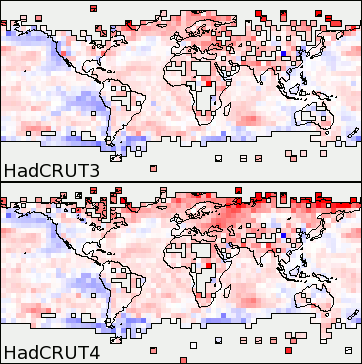
Kevin C has produced a great animated GIF comparing the global coverages of HadCRUT3 and HadCRUT4, illustrating that the most notable difference is better coverage in HadCRUT4 (Figure 1).
Figure 1: global geographic coverages of HadCRUT3 and HadCRUT4. Colors represent mean(2006-2010) minus mean(1996-2000), from +2°C (red) to -2°C (blue).
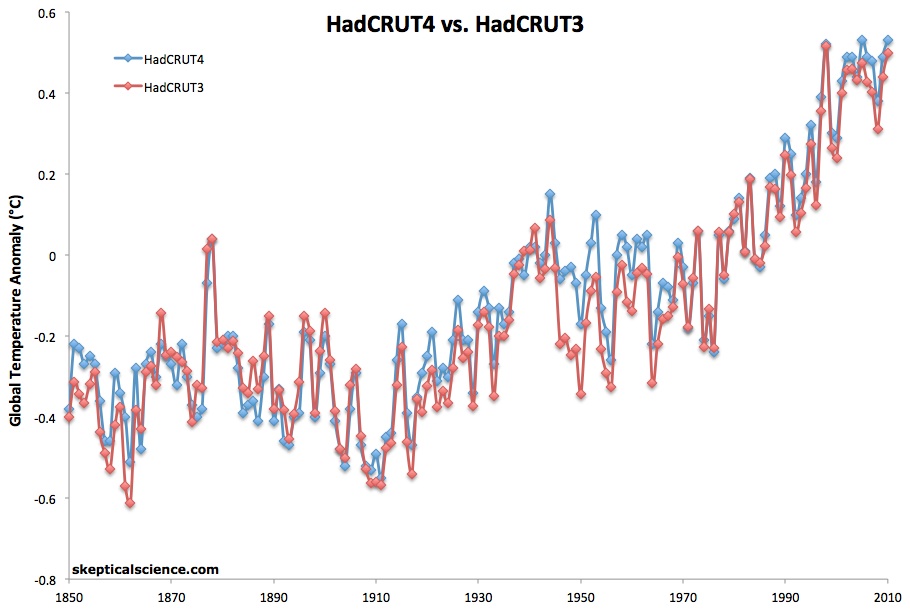
Figure 2 compares HadCRUT4 to the previous version, HadCRUT3. Note that so far HadCRUT4 data are only available through 2010.
Figure 2: HadCRUT4 (blue) vs. HadCRUT3 (red) annual global surface temperatures
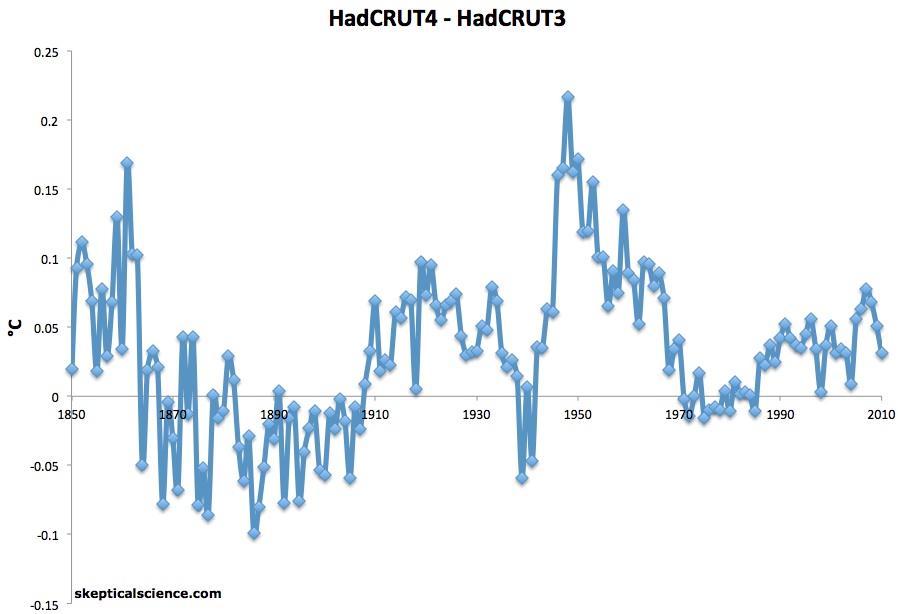
The largest change comes during the mid-20th Century, for example due to an adjustment to account for the sources of SST data switching during World War II from European fleets to almost exclusively US fleets (discussed by Schmidt at the link above). These adjustments, which somewhat dampen the mid-century cooling, are quite apparent in Figure 3, which takes the difference between HadCRUT4 and HadCRUT3.
Figure 3: HadCRUT4 minus HadCRUT3 annual global surface temperature data
In HadCRUT4, the hottest years on record are 2010 and 2005, with 1998 right behind in a statistical tie. This brings HadCRUT4 into better agreement with the surface temperature records from NCDC and GISS, which also have 2010 and 2005 as the hottest years on record, whereas HadCRUT3 had 1998 as the hottest.
This is something of a dark day for the many climate "skeptics" who in recent years have exclusively used HadCRUT3 to argue the myth that global warming has stopped, thanks to its cool bias. In fact, they were already attacking CRUTEM4 a month ago.
There is no longer any excuse for using HadCRUT3, and HadCRUT4 is in better agreement with the two other major surface temperature data sets. In fact, the HadCRUT4 linear trend in recent years now falls between the other two, a bit higher than NCDC but a bit lower than GISS. For example, the 15-year trends (1996 through 2010, which can be found with the SkS temperature trend calculator) are:
-
0.157 +/- 0.146°C/decade (GISS)
-
0.136 +/- 0.145°C/decade (HadCRUT4)
-
0.121 +/- 0.140°C/decade (NCDC)
-
0.098 +/- 0.156°C/decade (HadCRUT3)
So we can probably expect to see the 'skeptics' using NCDC surface temperature data from now on.


 Arguments


[DB] No Poe here. fydijkstra is a long-time fake-skeptic with a history of drive-by thread hijacking at SkS. Between mystical "Cycles" and "It's all a conspiracy" (indeed, it's conspiracies-all-the-way-down-Wednesday), no thread is safe. A sample of his work:
"@Bernard J. Why should anyone deny these numbers? It is a huge blessing, that the earth is able to store all this heat, without harmful effect on the climate! The oceans are a perfect heat buffer. If we had no oceans, we should invent them! They are the best weapon against global warming."
Everyone, DNFTT
[DB] "The trend since 1996 is not statistically significant."
Actually, 2 main points:
1. skywatcher was responding to the claim by fydijkstra that "the warming trend in the last 15 years is zero"; skywatcher ably showed the trend to not only be non-zero, but positive.
2. Tamino, in his The Real Global Warming Signal thread, showed that (once controlling for exogenous factors) not only is the warming trend since 1996 statistically significant, but that the trend in all 5 datasets examined showed statistically significant warming since 2000.
QED
Lets look at the period from 2003 to 2014 and put a trend line in over the last ten years.
Paul C:
Why would we deal with a time period that is:
(a) meaningless, from the perspective of analyzing the behaviour of the climate (there's a reason climatology usually operates on 30+ years)
(b) cherry-picked (doubtless because in HadCRUT 4 it gives a negative, but neither statistically significant nor (see below) physically significant, trend)
(c) unrepresentative of the behaviour of the climate in response to the global change in radiative forcing caused by greenhouse gases (since surface temperature represents approximately 2-3% of the Earth climate heat storage)
[PS] And perhaps look at the "Escalator" graph on this left.
I haven't been able to find any HadCrut data after about December 2014, neither at the MET web site nor on WoodForTrees tool. Has something changed?