 Arguments
 Software
 Resources
Comments
 The Consensus Project
 Translations
 About
Support


Latest Posts
- Skeptical Science New Research for Week #16 2025
- Climate Adam: Climate Scientist Reacts to Elon Musk
- Sabin 33 #24 - Is wind power too expensive?
- EGU2025 - Picking and chosing sessions to attend on site in Vienna
- 2025 SkS Weekly Climate Change & Global Warming News Roundup #15
- Fact brief - Is the sun responsible for global warming?
- Skeptical Science New Research for Week #15 2025
- Renewables allow us to pay less, not twice
- Sabin 33 #23 - How much land is used for wind turbines?
- Our MOOC Denial101x has run its course
- 2025 SkS Weekly Climate Change & Global Warming News Roundup #14
- Fact brief - Is Mars warming?
- Skeptical Science New Research for Week #14 2025
- Two-part webinar about the scientific consensus on human-caused global warming
- Sabin 33 #22 - How does waste from wind turbines compare to waste from fossil fuel use?
- Clean energy generates major economic benefits, especially in red states
- 2025 SkS Weekly Climate Change & Global Warming News Roundup #13
- Skeptical Science New Research for Week #13 2025
- Climate skeptics have new favorite graph; it shows the opposite of what they claim
- Sabin 33 #21 - How does production of wind turbine components compare with burning fossil fuels?
- China will need 10,000GW of wind and solar by 2060
- 2025 SkS Weekly Climate Change & Global Warming News Roundup #12
- Skeptical Science New Research for Week #12 2025
- Climate Fresk - a neat way to make the complexity of climate change less puzzling
- Sabin 33 #20 - Is offshore wind development harmful to whales and other marine life?
- Do Americans really want urban sprawl?
- 2025 SkS Weekly Climate Change & Global Warming News Roundup #11
- Fact brief - Is waste heat from industrial activity the reason the planet is warming?
- Skeptical Science New Research for Week #11 2025
- Visualizing daily global temperatures
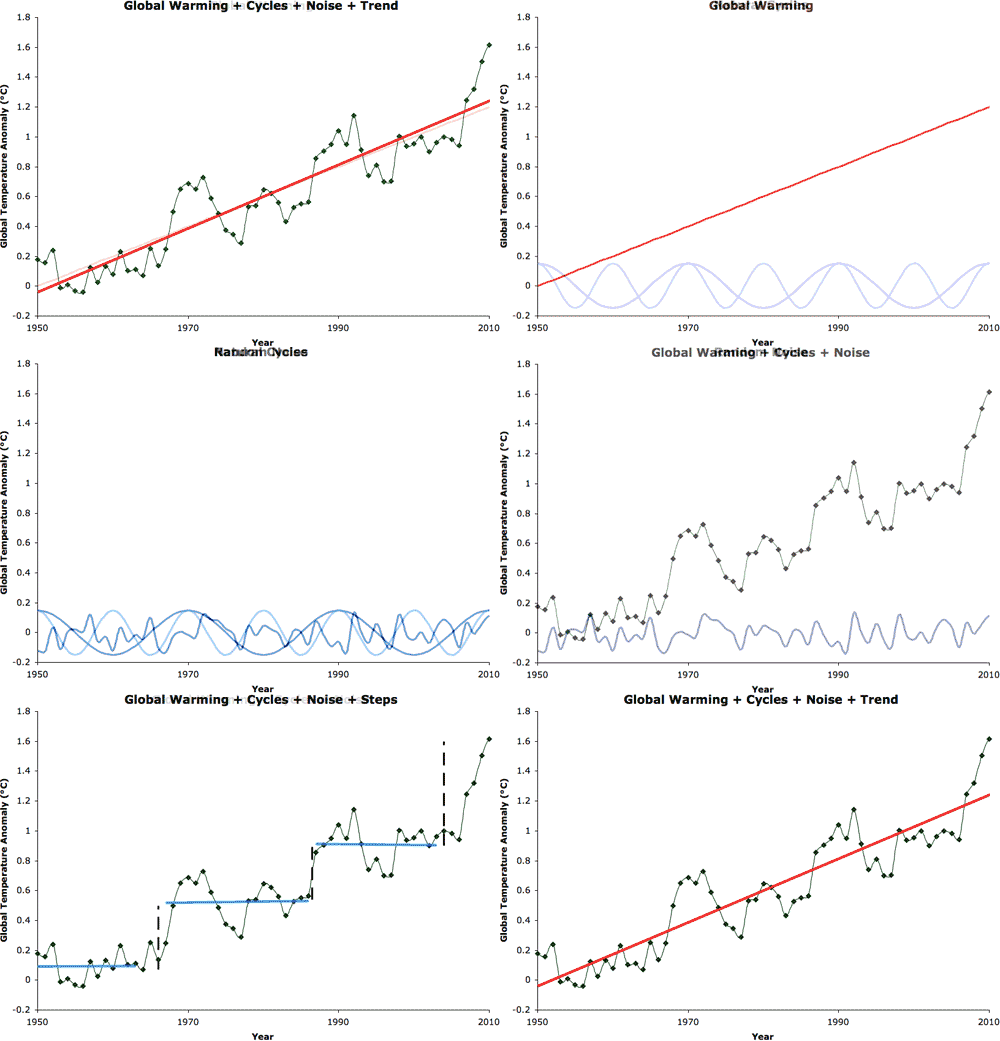
Step Function

For a video version of this animation, click here
This animation refutes the myth that the global temperature record is somehow explained by "climate shifts" or "step functions", when in reality the record is physically explained by an underlying long-term trend of increasing temperature (global warming caused by human greenhouse gas emissions) plus the superimposed effects of noise and natural cycles such as the El Nino Southern Oscillation (ENSO) and the solar sunspot cycle. Using simulated temperature data to illustrate how these physical factors combine to explain the appearance of the real temperature record, the frames show: 1) a 0.2°C per decade global warming trend; 2) two "natural cycles" of amplitude 0.15°C and periods of 10 and 20 years; 3) random noise of amplitude 0.07°C; 4) the sum of the warming trend, cycles and noise (the simulated temperature record); 5) a fit to the sum using a step function given by 3 linear trends from 1950-1963, 1967-1986, and 1987-2003 (light blue); and 6) a linear fit to the entire time period 1950-2010, which has slope 0.21°C per decade (red). The fit to the complete simulated temperature record in frame 6 is almost identical to the assumed global warming trend of 0.2°C in frame 1, just like the situation in the real world where short-term cycles and noise don't contribute to the long-term global warming trend.
SkS Resources that use this Graphic
- Global Warming and Step Functions
- Going Down the Up Escalator, Part 2
- Fred Singer - Not an American Thinker
- A Big Picture Look at Global Warming
Images
Printable Version | Back to Graphics by Skeptical Science
|
|
Skeptical Science Graphics by Skeptical Science is licensed under a Creative Commons Attribution 4.0 International License. |
THE ESCALATOR

(free to republish)


