 Arguments
 Software
 Resources
Comments
 The Consensus Project
 Translations
 About
Support


Latest Posts
- Skeptical Science New Research for Week #16 2025
- Climate Adam: Climate Scientist Reacts to Elon Musk
- Sabin 33 #24 - Is wind power too expensive?
- EGU2025 - Picking and chosing sessions to attend on site in Vienna
- 2025 SkS Weekly Climate Change & Global Warming News Roundup #15
- Fact brief - Is the sun responsible for global warming?
- Skeptical Science New Research for Week #15 2025
- Renewables allow us to pay less, not twice
- Sabin 33 #23 - How much land is used for wind turbines?
- Our MOOC Denial101x has run its course
- 2025 SkS Weekly Climate Change & Global Warming News Roundup #14
- Fact brief - Is Mars warming?
- Skeptical Science New Research for Week #14 2025
- Two-part webinar about the scientific consensus on human-caused global warming
- Sabin 33 #22 - How does waste from wind turbines compare to waste from fossil fuel use?
- Clean energy generates major economic benefits, especially in red states
- 2025 SkS Weekly Climate Change & Global Warming News Roundup #13
- Skeptical Science New Research for Week #13 2025
- Climate skeptics have new favorite graph; it shows the opposite of what they claim
- Sabin 33 #21 - How does production of wind turbine components compare with burning fossil fuels?
- China will need 10,000GW of wind and solar by 2060
- 2025 SkS Weekly Climate Change & Global Warming News Roundup #12
- Skeptical Science New Research for Week #12 2025
- Climate Fresk - a neat way to make the complexity of climate change less puzzling
- Sabin 33 #20 - Is offshore wind development harmful to whales and other marine life?
- Do Americans really want urban sprawl?
- 2025 SkS Weekly Climate Change & Global Warming News Roundup #11
- Fact brief - Is waste heat from industrial activity the reason the planet is warming?
- Skeptical Science New Research for Week #11 2025
- Visualizing daily global temperatures
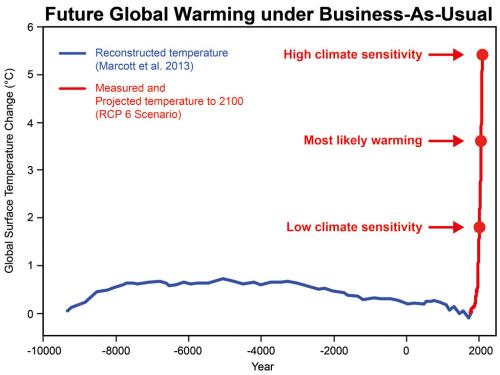
Future global warming under business-as-usual

This graph shows that even at the lowest range of climate sensitivity, future global warming will take us well beyond any temperature experienced during civilised human history. The blue line represents reconstructed temperature (Marcott et al. 2013). The red line represents measured and projected global surface temperature (Meinshausen et al. 2011). The red dots show the projected warming in the year 2100 for three different climate sensitivities (high sensitivity 4.5°C, most likely sensitivity 3°C, low sensitivity 1.5°C). H/T to Joe Romm and Michael Tobis whose work inspired this graph.
For more info, see A Glimpse at Our Possible Future Climate, Best to Worst Case Scenarios.
SkS Resources that use this Graphic
- The Economist Screws Up on the Draft IPCC AR5 Report and Climate Sensitivity
- The climate change policy discussion I wish Andrew Neil would have on BBC
Images
Printable Version | Back to Graphics by Skeptical Science
|
|
Skeptical Science Graphics by Skeptical Science is licensed under a Creative Commons Attribution 4.0 International License. |
THE ESCALATOR

(free to republish)


