HadSST3: A detailed look
Posted on 5 May 2012 by Kevin C
The Hadley centre of the UK Meteorological office has for a number of years maintained a dataset of sea surface temperatures (SSTs), HadSST2, which has formed a basis for estimating global surface temperatures. The HadSST2 dataset was used in the widely quoted HadCRUT3 temperature record, as well as providing the in-situ sea surface temperature component of HadISST since 2007. HadISST is used along with Reynold's OISST in NASA's GISTEMP record. The source data are versions of the International Comprehensive Ocean Atmosphere Data Set (ICOADS), which includes historical records from many sources.
The SST data are a little more complex than the weather station data with which most of use are familiar: Whereas temperature measurements at weather stations have been performed according to a standard protocol for over a century, measurement methods for SST data have changed significantly over the same period. Early measurements were taken using a canvas bucket trailed in the water, or later a better insulated wooden or rubber bucket. Later measurements were taken from engine room intakes, hull sensors, or buoys. The different methods have different biases, and thus significant corrections are required to produce a stable temperature series. The HadSST2 record included a 'bucket correction' for data collected before 1942, to correct for a known cool bias in the data.
This year, the Hadley centre released a new version of this dataset, HadSST3, based on additional data and more importantly, some additional corrections. These are described in Kennedy et al, 2012.
Temperature bias
A number of studies have looked at the sources of bias in SST measurements. Kennedy et al provide a review of the literature, and identify the following key issues:
-
Canvas buckets allow significant evaporation while hauling in the bucket, cooling the water and leading to a measurement which is biased low.
-
Wooden or rubber buckets reduce the evaporation effect.
-
Engine room sensors take their samples from deeper water, but the water is heated by the pipework, and so the resulting measurements are most often biased high.
-
Hull sensors suffer similar problems to engine room sensors, although the effect is probably smaller - this has not been widely studied.
-
Buoys tend to be more consistent.
These effects have been quantified; for example engine room intake (ERI) temperatures have been compared to bucket measurements by a number of studies. Engine room temperatures can be directly checked against buoy measurements by mining the ICOADS data for examples of a ship passing close to a buoy. Reasonable estimates are therefore available for the temperature biases, however there are still uncertainties, with ERI measurements in particular varying from ship to ship and with loading.
How often is each method used?
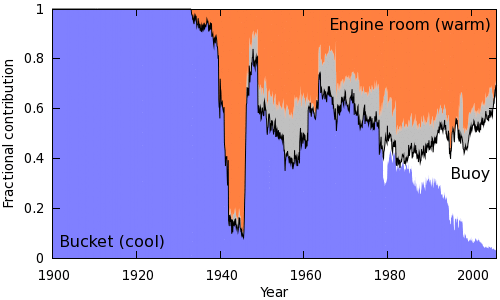
The effect of these biases will vary according to how often each method is used at any point in time. In many cases the measurement method is recorded in ICOADS metadata, in other cases it must be inferred from other sources, such as the standard operating procedures for the nation operating the ship. Kennedy et al have examined the available records and devised a set of rules to determine which method is most likely to have been used for an unclassified measurement. Combining these classifications with the known cases give rise to an estimate of the proportion of measurements made using a given method by year. This is illustrated in Figure 1.

This is a re-plotting of Kennedy et al Figure 2, to sort the measurement types according to bias. The grey region represents measurements of unknown type.
The black line in Figure 1 gives an approximate indication of the correction required. When all the data come from cool-biased buckets, a positive adjustment is required; when they come from warm-biased engine room intakes, a negative adjustment is required. There is a big shift from buckets to engine room intakes in 1941-1942; this is the 'bucket correction' implemented in existing datasets such as HadSST2. The big change identified in this work is a shift back to buckets in the mid 40's. This corresponds to a switch from using US ships to UK ships, with a corresponding change in operating procedures. The resulting discontinuity in the temperature record has been know for a while, but the cause was first identified by Thompson et al (2008).
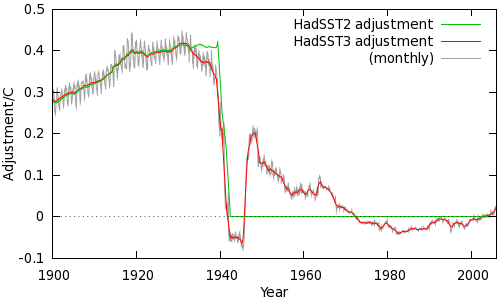
Note however that this figure does not tell the whole story - for example it ignores the distribution of measurements across the globe, and the transition from canvas to insulated buckets between 1954 and 1970. Kennedy et al take these and other factors into account, and the resulting adjustment is shown in Figure 2.

The HadSST2 and HadSST3 adjustments are in good agreement until 1940; after that HadSST2 assumes that the data is homogeneous while HadSST3 makes corrections for the continuing changes in the mix of observations. From the late 40's the increasing use of first insulated buckets and then buoys means that the size of the adjustment has declined. However in recent decades there has been a small shift towards a cool bias, and a corresponding positive correction with the switch from engine room temperatures to buoy measurements.
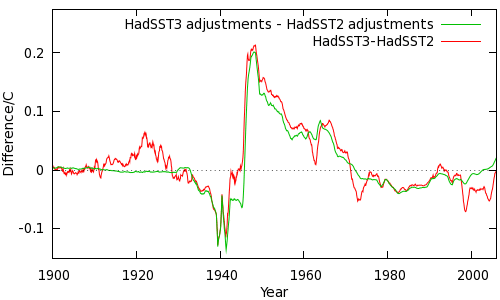
How does this play out in the global SST series? The difference between HadSST3 and HadSST2 is shown in Figure 3, along with the change in the adjustments.

The green line in Figure 3 is the difference between the red and green lines in Figure 2. Clearly the bulk of the difference between the two datasets is due to the new adjustments. The remainder comes from additional records which have been digitized and added to the ICOADS database.
Why stop at 2006?
The currently released data runs up to 2006. After that time ship identifiers were removed from the ICOADS records for security reasons.
Uncertainties
One more complex feature of the HadSST3 data is the provision of an ensemble of possible 'realizations'. This is related to determining the uncertainty in an estimate of global mean sea surface temperature, or of a trend over multiple years. The simplest approach is to attach an uncertainty estimate to each map grid cell for each month. That works fine if the errors behave like measurement errors, because measurement errors are independent - if you average them over the globe they tend to cancel out, and the global mean thus has a lower uncertainty than an individual measurement. Some biases (referred to as microbiases in the paper) also behave in this way. However others, such as the bias due to sampling method, may affect whole groups of observations in the same way.
The corrections for these biases also have uncertainties. If a bias correction is made which applies to all the measurements in a particular month, the the resulting uncertainty in the global temperature will be just as big as the corresponding uncertainty in any individual cell. The issue becomes even more complex with bias corrections which are correlated from month to month. Bias corrections which are stable over time will have a big effect on time averages, but no effect on trends. Conversely, bias corrections which vary over time can have a big effect on trends.
A common mathematical approach to this problem is to calculate the 'covariances' of all the variables - i.e. how the temperature of every map cell for every month is related to every other through the common corrections. For the SST problem this approach is unfeasible, requiring of the order of a billion covariances. Instead Kennedy et al have created 100 'realizations' of data using different values for the various bias corrections which sample the uncertainty range for each correction. To estimate the uncertainty in an average or a trend, all that is required is to calculate the average or trend for each of the 100 realizations, and estimate the uncertainty from the distribution of the results.
An important implication is that uncertainties due to uncorrected biases (which are often correlated over time) will not usually be picked up by post-hoc uncertainty estimates, such as the estimates produced by the Skeptical Science trend calculator.
Implications
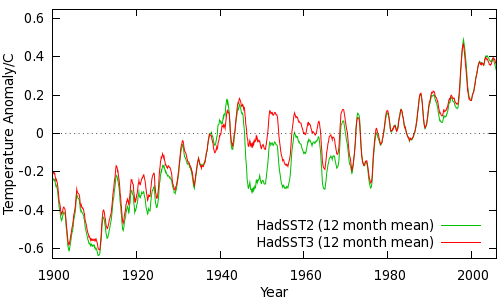
A single temperature series can be constructed from the ensemble of realizations by some kind of average - in the case of HadSST3 the median (a robust estimator) is used. The resulting series for HadSST3 and HadSST2 are compared in Figure 4. (Note that these series are global averages as opposed to the NH/SH average usually quoted by Hadley/CRU.)

The most important result from a climate perspective is the correction of the discontinuity in the mid 40's. Climate models have consistently failed to reproduce this feature of the temperature record from any known set of climate forcings. If the adjustment incorporated by Kennedy et al is correct then the discrepancy is at least partly accounted for by bias in the temperature record rather than a problem with the models. However natural variability and uncertainties in the observations and forcings mean that the issue is far from clear-cut.
A more topical issue is the temperature trend over the last decade or so, with the trend since 1998 receiving frequent attention. The HadSST2 trend over the 9 year period 1998-2006 is 0.08°C/decade. The median trend from the HadSST3 ensemble is 0.12°C/decade, however the 95% uncertainty interval obtained from the whole HadSST3 ensemble ranges from 0.10 to 0.16°C/decade not including the substantial uncertainty in the trend. Thus, while it is more likely that the recent trend has been under- rather than overestimated, there remains significant uncertainty. This highlights the need for longer periods of data when assessing climate trends.
Conclusions
Oceans make up 70% of the Earth's surface, and so accurate sea surface temperature measurements are important in understanding the temperature changes of the last 1½ centuries. HadSST3 is an important contribution to that understanding. However the problem is not simple, and the bias problems present a very different challenge to weather station records. Kennedy et al summarize the current state of knowledge in the following way:
"It should be noted that the adjustments presented here and their uncertainties represent a first attempt to produce an SST data set that has been homogenized from 1850 to 2006. Therefore, the uncertainties ought to be considered incomplete until other independent attempts have been made to assess the biases and their uncertainties using different approaches to those described here."
Acknowledgements
The author would like to thanks to John Kennedy at the Hadley centre for data and suggestions concerning this article.


 Arguments


 0
0  0
0


Comments