Climate Science Glossary

Term Lookup

Enter a term in the search box to find its definition.

Settings

Use the controls in the far right panel to increase or decrease the number of terms automatically displayed (or to completely turn that feature off).

Term Lookup

Settings


All IPCC definitions taken from Climate Change 2007: The Physical Science Basis. Working Group I Contribution to the Fourth Assessment Report of the Intergovernmental Panel on Climate Change, Annex I, Glossary, pp. 941-954. Cambridge University Press.

Home Arguments Software Resources Comments The Consensus Project Translations About Support

Bluesky Facebook LinkedIn Mastodon MeWe

Twitter YouTube RSS Posts RSS Comments Email Subscribe


Climate's changed before
It's the sun
It's not bad
There is no consensus
It's cooling
Models are unreliable
Temp record is unreliable
Animals and plants can adapt
It hasn't warmed since 1998
Antarctica is gaining ice
View All Arguments...


Username
Password
New? Register here
Forgot your password?

Latest Posts

Archives

Are we heading into a new Ice Age?

What the science says...

Select a level... Basic Intermediate

The warming effect from more CO2 greatly outstrips the influence from changes in the Earth's orbit or solar activity, even if solar levels were to drop to Maunder Minimum levels.

Climate Myth...

We're heading into an ice age

"One day you'll wake up - or you won't wake up, rather - buried beneath nine stories of snow. It's all part of a dependable, predictable cycle, a natural cycle that returns like clockwork every 11,500 years.  And since the last ice age ended almost exactly 11,500 years ago…" (Ice Age Now)

Just a few centuries ago, the planet experienced a mild ice age, quaintly dubbed the Little Ice Age. Part of the Little Ice Age coincided with a period of low solar activity termed the Maunder Minimum (named after astronomer Edward Maunder). It's believed that a combination of lower solar output and high volcanic activity were major contributors (Free 1999, Crowley 2001), with changes in ocean circulation also having an effect on European temperatures (Mann 2002). 
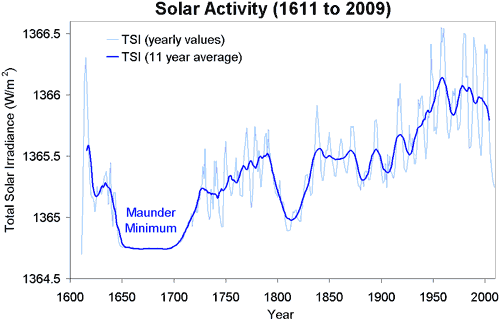
Solar Activity - Total Solar Irradiance (TSI) including Maunder Minimum
Figure 1: Total Solar Irradiance (TSI). TSI from 1880 to 1978 from
Solanki. TSI from 1979 to 2009 from Physikalisch-Meteorologisches Observatorium Davos (PMOD). 

Could we be heading into another Maunder Minimum? Solar activity is currently showing a long-term cooling trend. 2009 saw solar output at its lowest level in over a century. However, predicting future solar activity is problematic. The transition from a period of 'grand maxima' (the situation in the latter 20th century) to a 'grand minima' (Maunder Minimum conditions) is a chaotic process and difficult to predict (Usoskin 2007).

Let's say for the sake of argument that the sun does enter another Maunder Minimum over the 21st century. What effect would this have on Earth's climate? Simulations of the climate response if the sun did fall to Maunder Minimum levels find that the decrease in temperature from the sun is minimal compared to the warming from man-made greenhouse gases (Feulner 2010). Cooling from the lowered solar output is estimated at around 0.1°C (with a maximum possible value of 0.3°C) while the greenhouse gas warming will be around 3.7°C to 4.5°C, depending on how much CO2 we emit throughout the 21st century (more on this study...). 
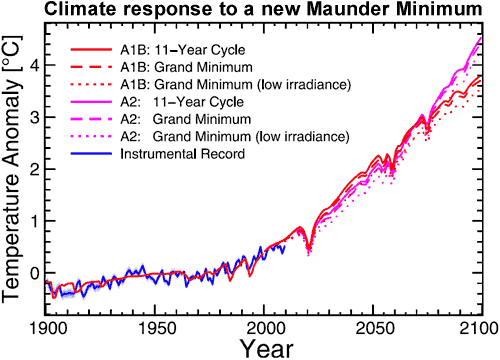

Figure 2: Global mean temperature anomalies 1900 to 2100 relative to the period 1961 to 1990 for the A1B (red lines) and A2 (magenta lines) scenarios and for three different solar forcings corresponding to a typical 11-year cycle (solid line) and to a new Grand Minimum with solar irradiance corresponding to recent reconstructions of Maunder-minimum irradiance (dashed line) and a lower irradiance (dotted line), respectively. Observed temperatures from NASA GISS until 2009 are also shown (blue line) (Feulner 2010).

However, our climate has experienced much more dramatic change than the Little Ice Age. Over the past 400,000 years, the planet has experienced ice age conditions, punctuated every 100,000 years or so by brief warm intervals. These warm periods, called interglacials, typically last around 10,000 years. Our current interglacial began around 11,000 years ago. Could we be on the brink of the end of our interglacial?
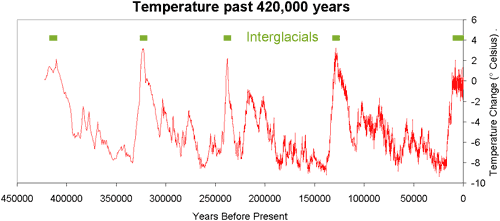
Temperature of Vostok, Antarctica including interglacials and Milankovitch cycles
Figure 3: Temperature change at Vostok, Antarctica (Petit 2000). Interglacial periods are marked in green.

How do ice ages begin? Changes in the earth's orbit cause less sunlight (insolation) to fall on the northern hemisphere during summer. Northern ice sheets melt less during summer and gradually grow over thousands of years. This increases the Earth's albedo which amplifies the cooling, spreading the ice sheets farther. This process lasts around 10,000 to 20,000 years, bringing the planet into an ice age.

What effect do our CO2 emissions have on any future ice ages? This question is examined in one study that examines the glaciation "trigger" - the required drop in summer northern insolation to begin the process of growing ice sheets (Archer 2005). The more CO2 there is in the atmosphere, the lower insolation needs to drop to trigger glaciation.

Figure 4 examines the climate response to various CO2 emission scenarios. The green line is the natural response without CO2 emissions. Blue represents an anthropogenic release of 300 gigatonnes of carbon - we have already passed this mark. Release of 1000 gigatonnes of carbon (orange line) would prevent an ice age for 130,000 years. If anthropogenic carbon release were 5000 gigatonnes or more, glaciation will be avoided for at least half a million years. As things stand now, the combination of relatively weak orbital forcing and the long atmospheric lifetime of carbon dioxide is likely to generate a longer interglacial period than has been seen in the last 2.6 million years.
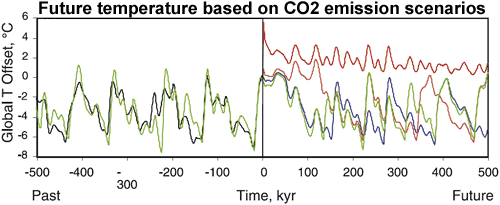
Future temperature rise based on various CO2 emission scenarios
Figure 4. Effect of fossil fuel CO2 on the future evolution of global mean temperature. Green represents natural evolution, blue represents the results of anthropogenic release of 300 Gton C, orange is 1000 Gton C, and red is 5000 Gton C (Archer 2005).

So we can rest assured, there is no ice age around the corner. To those with lingering doubts that an ice age might be imminent, turn your eyes towards the northern ice sheets. If they're growing, then yes, the 10,000 year process of glaciation may have begun. However, currently the Arctic permafrost is degrading, Arctic sea ice is melting and the Greenland ice sheet is losing mass at an accelerating rate. These are hardly good conditions for an imminent ice age.

intermediate rebuttal written by Daniel Bailey


Update July 2015:

Here is a related lecture-video from Denial101x - Making Sense of Climate Science Denial


Additional video from the MOOC

Expert interview with Mike Lockwood


Last updated on 12 October 2016 by pattimer. View Archives

Printable Version  |  Offline PDF Version  |  Link to this page

Argument Feedback

Please use this form to let us know about suggested updates to this rebuttal.

Further reading

Tamino discusses predictions of future solar activity in Solar Cycle 24.

Acknowledgements

Many thanks to Sami Solanki for his invaluable advice and feedback as well as John Cross for his very helpful comments.

Further viewing

potholer54 published a video tackling this myth on June 27, 2020


Dave Borlace explains why we are not headed towards an ice age in this "Just have a think" video published in December 2019:


Denial101x video

Comments

1  2  3  4  5  6  7  8  9  10  11  12  13  14  15  16  17  Next

Comments 1 to 25 out of 411:

  1. Hi John: Thanks for the thanks (although I will hasten to point out that all I did was offer some minor comments). I am especially delighted to me mentioned in the same acknowledgement as Dr. Solanki. I don't know if Dr. Solanki reads this blog, but if he does I would like to say that I have been reading his papers since I came across the Harold Jefferys Lecture that he did about 4 years ago. Very interesting work! Regards, John
  2. Re: "What if the sun did go through another Maunder Minimum?" Not IF but When. It's part of the long term climate cycle.
  3. Actually we can't head into an ice age at this point in time because we are already in one. Technically this is an interglacial period within the current ice age, ie. this is not "Earth Normal" climate, which is much hotter. Interglacial means "between glacations" and is about as unstable a climate as possible on this planet. That is assuming that it is an interglacial rather than the ice age ending (far worse for us). It also assumes that another glacation will occur. Looking at graphs of prior interglacials and glacations there is a particular constant: it warms slowly for thousands of years then cools rapidly (it looks very similar to a sawtooth inventory graph). Another fact is that CO2 has been very high when it suddenly became very cold (it did nothing to stop the glacations). So be afraid, be very afraid.
  4. Quietman: That's simply not true. The glacial cycles of the last 450'000 years have consisted of long periods of slow cooling, followed by rapid warming. (http://commons.wikimedia.org/wiki/Image:Ice_Age_Temperature.png - please note that present day is to the left). This rapid warming is believed to be started by small changes in solar forcing (see Milankovitch cycles: http://en.wikipedia.org/wiki/Milankovitch_cycles) which is enough to start positive feedback spirals: warmer -> more greenhouse gases -> even warmer... Since we've recently come out of an glacial period, temperature is basically is as it gets and should be slowly decreasing (on a long timescale) until we reach the next glacial period. But instead, anthropogenic releases of greenhouse gases have started the process of warming. The amount of released GHG so far is enough to keep the planet warming for a long time (but of course, with possible micro trends of cooling) and we've soon reached a level where positive feedback spirals kick in, meaning that temperature will continue to rise even if we would stop our own releases of GHG.
  5. should've been: "... is basically as high as it gets ..."
  6. Maunder minimum...solar radiation ( and I deliberately use that term) drops between .17 and .23 W/m2; the suggestion is that these changes are insufficient to account for glaciation periods, or , if they are responsible, the system must be pretty thermally unstable. What was perihelion at this time? Orbital eccenticities have FAR greater effects on the amount of radiation recieved (between 6 -7% depending on source)than solar variations. What other factors were different then as opposed to now? You cannot isolate one component of a system and use it to determine an end result. You have to include all factors. My general conclusions from what I have read and what I have tried to model, is that the 'normal' state of the earth is "cold". That the warm phases are the anomalies. I accept this is MY opinion, but given the choice between a longer, warmer interglacial period or an earlier decline into one, I think I would opt for the warmth; life ( of all kinds) flourishes better in warm climates
  7. Why am I not surprised that the snapshot used by "Image from Global Warming Art" is different from everyone elses? It's called cherry picking.
  8. To clarify, Look at the 5 million year chart instead. The highs and lows of 450 K years are only oscillations of a gradual warming trend for 5 million years.
  9. The O18 concentration in bottom-dwelling foramanifera is used as a proxy for surface climatic conditions: eg a warmer climate produces more dead bodies drifting to the sea bed which allows the organisms there to multiply and 'trap' more O18. There are some difficulties with this, namely, you need prior data on the level of O18 or C13 at 'ground zero'. Also how do you compute the time lags involved? Slide the graph around until there seems some kind of match to glacier records? How do you accomodate variations in surface species numbers due to local climate? Are 57 core samples sufficient to give a general trend? http://en.wikipedia.org/wiki/Paleothermometer
  10. "The difference in solar radiative forcing between Maunder Minimum levels and current solar activity is estimated between 0.17 W/m2 (Wang 2005) to 0.23 W/m2 (Krivova 2007)" Wang 2005: "The increase in cycle-averaged TSI since the Maunder minimum is estimated to be ~1 W/m2" (instead of 0.17 W/m2?) Krivova 2007: "[The model predicts] an increase in the solar total irradiance since the Maunder minimum of 1.3^+0.2_-0.4 W/m2" (instead of 0.23 W/m2?)
  11. I am a novice here but I have noticed a lot of technical jargon that I don't understand. "Al Gore" etc thinks it is going to get warm. The "skeptics" say it is going to get cold. I think that if I lived in the NH I would make sure I have got some warm clothes. The bottom line is that all our heat comes from the Sun. If it cools down so does Earth. Any variances due to different Ocean Currents, Magnetic Fields etc are only releasing stored energy from the Sun. At the end of the day this planet will be a Dead Rock circling a spent Sun. Lets hope it warms up, CO2 increases, Plants grow and life becomes comfortable for a while. The alternative is not nice.
  12. Nor is a seven metre rise in sea levels. Where are all the people who live within ten miles of the coast going to live? I doubt the dinosaurs worried too much about how much land they had available or how many times they were flooded out or how many died in forest fires or died of thirst.
  13. Samboc: Don't worry about the sun cooling down just yet, providing it doesn't do anything silly it will follow the normal sequence for its type and increase in luminosity ( by about 10% over the next billion years). And you're right: warmer is better as the paleorecord shows. The view that sea levels will rise to the levels predicted is based on assumptions, not facts. All that water has to come from somewhere- snow,glaciers, icecaps, thermal expansion et al. There are many unresolved factors such as land rebound, greater oceanic uptake of CO2 due to rising ocean volume decreasing the GG efect at the same time as ocean warming releases more CO2...and one can go on and on. We currently simply do not have the ability (or data)to fully understand and accurately model the climate process, so it is not reasonable to take action that would have severe economic and societal repercussions until that time arrives.
  14. Samboc Well said. Warm is better than cold.
  15. sandy Distance to the shore is irrelevant, height above sea level is relevant. But a small factor is left out when the alarmists talk about sea level rise and that is porosity and absorbtion. The Newark Basin in New Jersey is not very much higher than sea level and yet it was swamp lands during the mesozoic, not ocean bottom. Much of the coast that will flood is swamp land now. During the Mesozoic the midwestern US was an inland sea and remains lowland today. A catastrophic rise in sea level will most likely result in a return of the inland sea, something that alarmists fail to mention.
  16. On sea levels: In Australia a bed of semi-fossilised molluscs has been found above current sea level and dated at between 4500 to 6000 years old. This suggests current MSL has fallen over the last 6000yrs. since Australia is not very active tectonically. Wait til the creationists find that one! I can't remember the exact page but more detail is at John-Daly web site.
  17. Mizimi Plates literally float. They can shift, rise or fall. There are no true continents, what we see is a result of large pieces of lighter material breaking and mergeing or subducting. There is no real difference between sea floor and land other than elevation. So while Australia is relatively free from volcanism it is still subject to plate tectonics which are constantly active but change intensity and speed is cycles.
  18. QM: Yes, and it makes rather a nonsense of trying to assign mean sea level deviations to global warming. The Isles of Scilly is a group of around 50 islands some 45km south west of Cornwall, England. They have been inhabited since (at least) the bronze age, some 4000ya. At low tide, stone houses, roads and field perimeters are revealed, dating from that time, so either msl has risen a few metres in 4000yrs or the islands have sunk.....how to tell the difference?
  19. Mizimi I think Dr. Rhodes Fairbridge answered that question in his study of sea level cycles. It's referred to as the "Fairbridge curve" and I think wikipedia posted an explanation of how it works. I have not looked too deeply into it as I am more interested in his later "Solar Jerk" hypothesis.
  20. I heard about this on the radio last month, and this would prove that we are not the cause of climate change, and that industrialization is not harmful. Unfortunately, many people are still advocating global warming since they have their money on it. This seems to be the strategy for defense of these advocates: "if any part of the earth gets warmer during the industrialized age, industrialization is to blame. If the earth gets cooler, of course, industrialization is a bad thing anyway. Heads, I win. Tails, you lose!
  21. QM: have you read this, and if so, any comment? http://www.griffith.edu.au/conference/ics2007/pdf/ICS176.pdf How's the greehouse project?
  22. Mizimi Yes that was the first piece I saw that got me interested in the hypothesis. Mackey said the test period would be 2007-2011 and so far it's on the money. It's also the ONLY paper that predicted the cold snap, all the other articles and papers at that time said exactly the opposite. (I kept all the failed forcasts in a file to serve as bad examples for future generations). ps The green house is on hold until the ice melts. Right now I'm waiting on delivery of a larger snow blower that I can mount off the PTO on my tractor. Snow has been way too heavy for the gas fired one and too deep to plow, I have been using a bucket loader all winter to shovel it off and it's ruining my driveway. So I'm going to have to resurface it when everything finally melts. But I am planning to go with the blue plastic for the roof.
  23. John "We're heading into a new Little Ice Age" equals "It's the Sun". No different, same thread.
  24. SAME THREADS: "Are Sunspots Different" http://www.leif.org/EOS/2009EO300001.pdf "LONGER TERM SOLAR MINIMUM" http://icecap.us/images/uploads/SOLAR_MINIMUM.pdf
  25. [quote]The difference in solar radiative forcing between Maunder Minimum levels and current solar activity is estimated between 0.17 W/m2 (Wang 2005) to 0.23 W/m2 (Krivova 2007).[/quote] Solar radiative forcing is not the only change to account for. Solar minimum may also mean less solar wind and solar cosmic rays and geo-magnetic interaction. There is a correlation between solar cycles and the number of galactic cosmic rays, wich can cause more or less cloud formation that can increase the albedo reflecting a significative part of the total sun power. So when we talk about a solar cycle influence we should include also this issue.

1  2  3  4  5  6  7  8  9  10  11  12  13  14  15  16  17  Next

Post a Comment

Political, off-topic or ad hominem comments will be deleted. Comments Policy...

You need to be logged in to post a comment. Login via the left margin or if you're new, register here.

Link to this page


The Consensus Project Website

THE ESCALATOR

(free to republish)


© Copyright 2024 John Cook
Home | Translations | About Us | Privacy | Contact Us