The hottest days in 120,000 years
Posted on 5 August 2024 by Guest Author
This is a re-post from the Climate Brink by Andrew Dessler
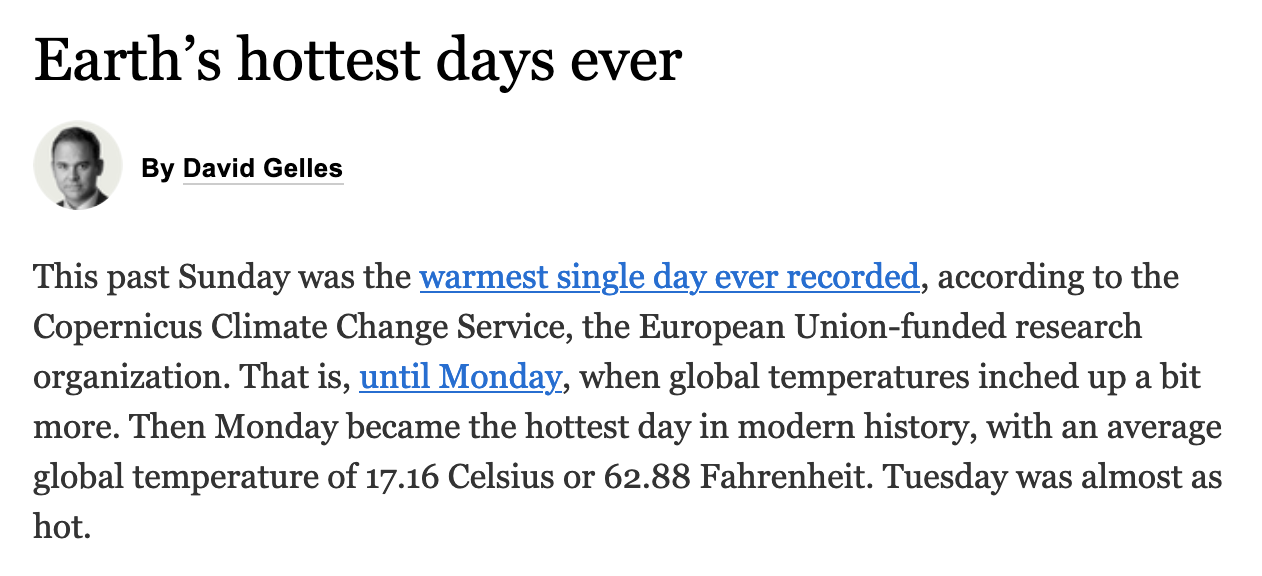
Last week we set a record: we experienced the hottest day in the observational record. That record stood for 24 hours, when the next day took the record. In fact, these may have been the hottest days in the last 120,000 years.

To understand this latter claim, let’s work backwards. We know that the record breaking days last week are the hottest in the observational record, which goes back about 150 years.
Now, let’s look at the last 10,000 years. We used to think that the period about 7,000 years ago, a period sometimes referred to as the Holocene Optimum, was warmer. However, scientists have revised their estimates of the temperature at that time and it is probably the case that temperatures today are warmer than anytime over the last 10,000 years.
Beyond 10,000 years, we were in an ice age, so last week was clearly warmer than that. That ice age extended back to around 120,000 years ago, when the previous interglacial ended. That interglacial was a few degrees warmer than today, due to differences in the Earth’s orbit.
Voila, this week likely had the hottest days in the last 120,000 years. The word likely here indicates our imprecise knowledge of temperatures before the instrumental record. For example, the proxies used to estimate temperatures over the last 10,000 years are century scale, so we can’t rule out a single crazy hot day as a result of an exceptionally large El Nino or some other driver of variability.
Is this important?
Considering the entire history of the Earth, it has been both much warmer and much colder than today. So the fact that the Earth is warmer today than anytime over the last 120,000 years is not really important — other than for shock value.
What is important is that the planet is warmer than it was 30, 40, 50, 100 years ago. That matters because much of the infrastructure that we rely on was built in the last century — and for a climate that no longer exists. If you live in a city that has a sewer system that was built in the middle of the 20th century, then that sewer system was not designed for the intense rain events that we’re getting today. Similarly, if you live in a city on the coast, then it was built for a sea level that no longer exists.
We can update our infrastructure for the climate of the 21st century, or course, but it’s going to be an absolute nightmare.
Absolute temperature vs. anomalies
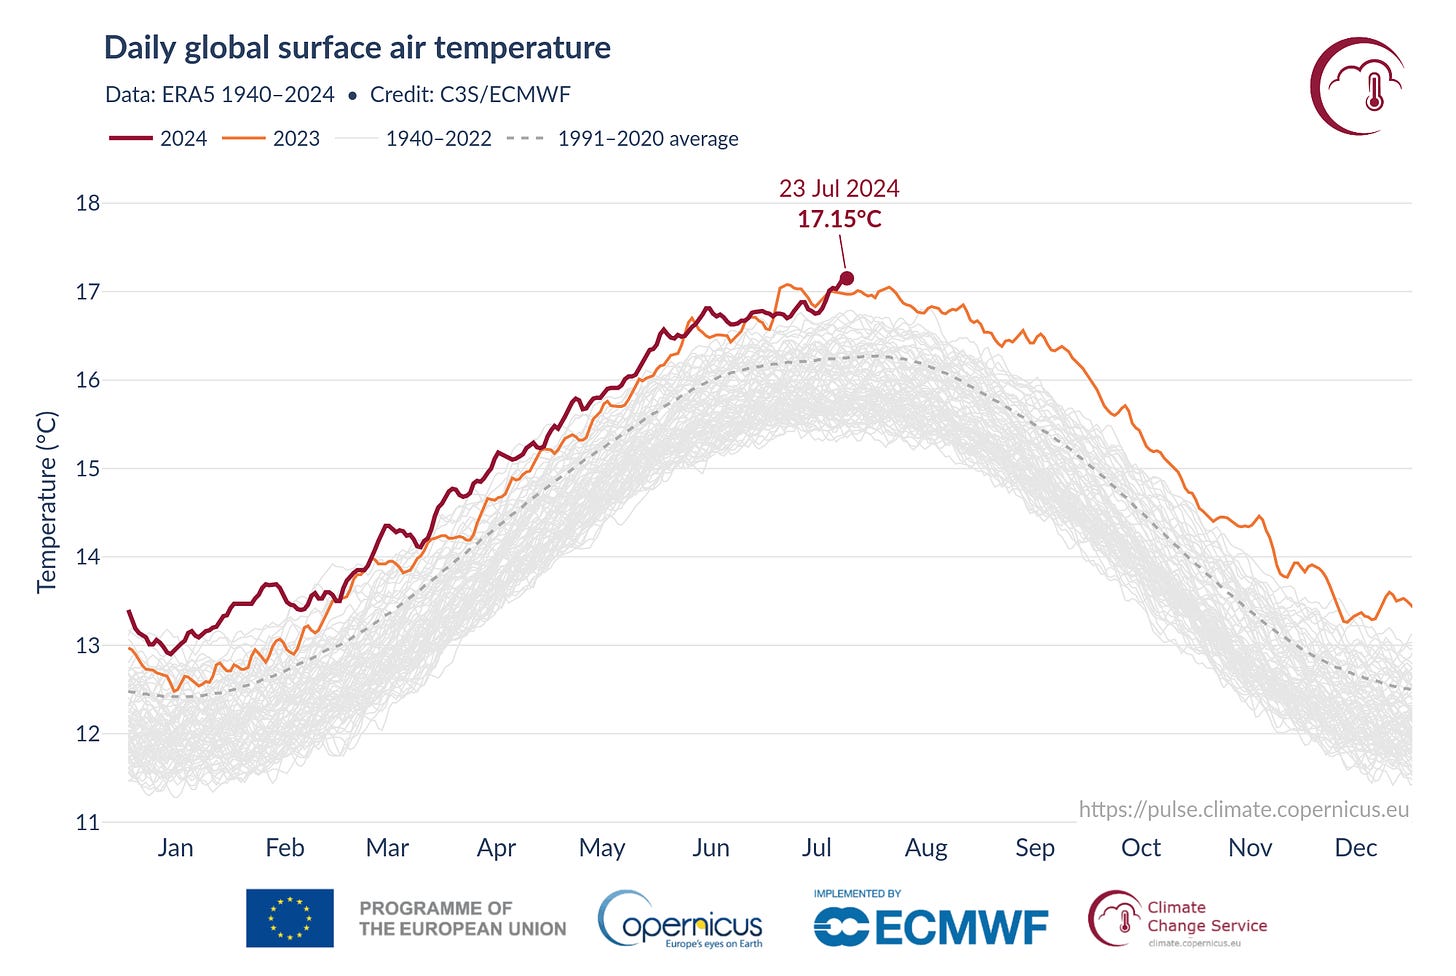
One interesting thing is that this statistic is based on absolute temperatures:

The data clearly shows a seasonal cycle, with global temperatures during the northern hemisphere's summer higher than the southern hemisphere's summer. This difference occurs because the northern hemisphere has more landmass, which heats up more quickly than the oceans.
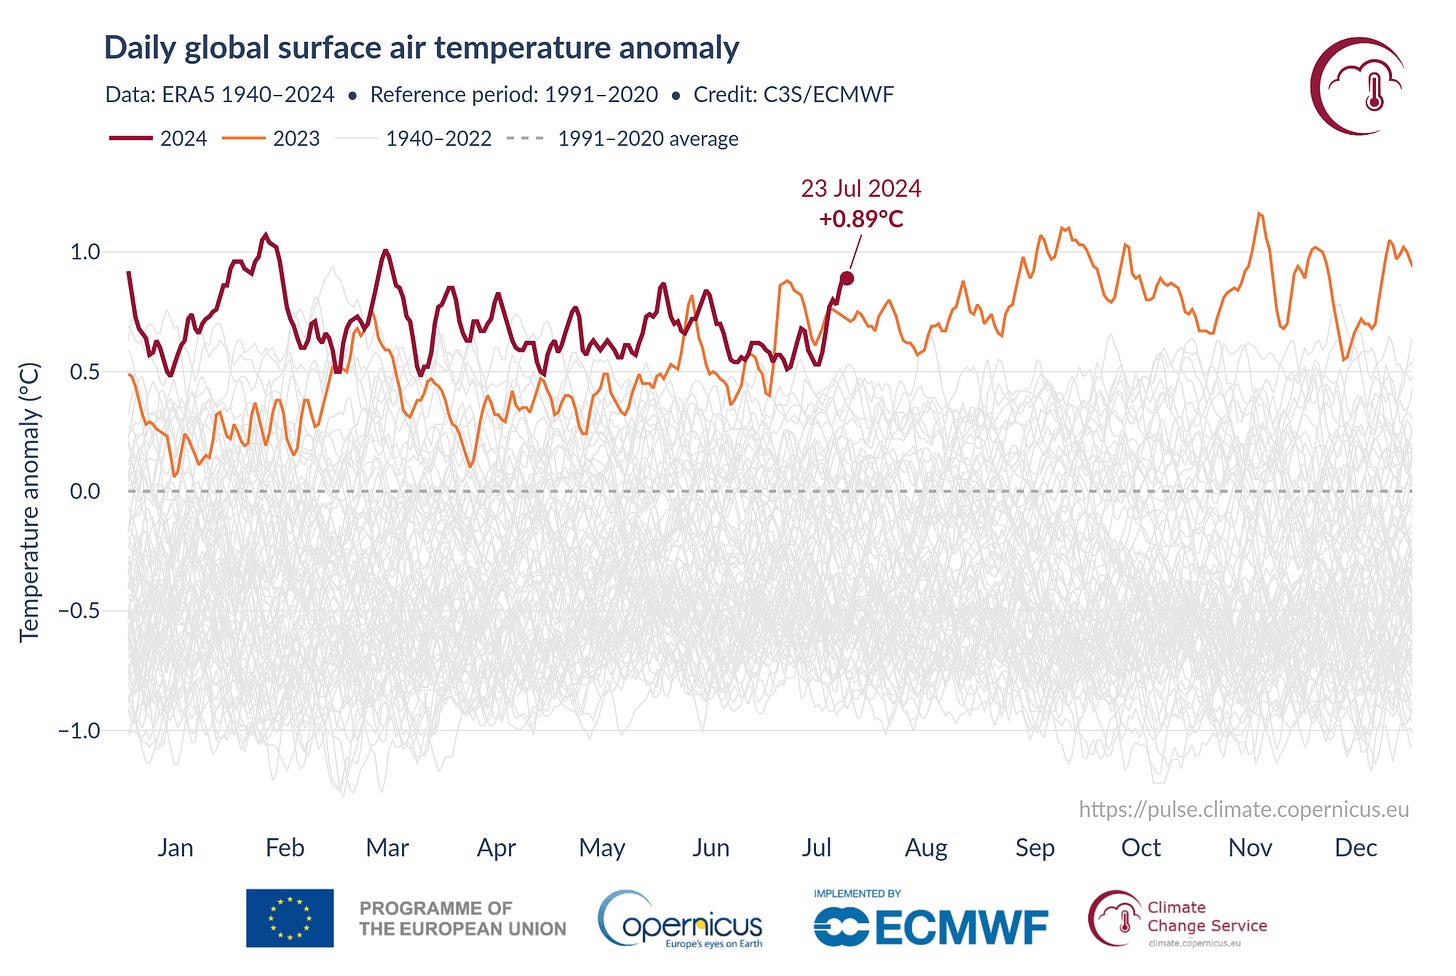
This is an unusual way of looking at the problem. Most climate data you see are anomalies: the difference between the absolute temperature and the average temperature of a reference period. Here’s what the temperatures look like in anomaly space:

In anomaly space, last week was not a record. The reason is that the seasonal cycle is removed when the anomaly is calculated, so July temperatures do not get the boost from the seasonal cycle that they do when looking at absolute temperatures. In anomaly space, the hottest days occurred last Fall. Ultimately, it’s a nit: either the hottest temperatures were a either few days ago or a few months ago, but in either case humanity is in uncharted territory.
If you want to know more about anomalies, or if you’re curious why we use anomalies rather than absolute temperatures, you’re in luck! I put together a video for my class on this very subject.
Bonus content
I did an interview with Fox Live Now last week about this record.


 Arguments


Comments