IEA CO2 Emissions Update 2011 - the Good News and the Bad
Posted on 30 May 2012 by dana1981, John Cook
This post has also been published on The Conversation, which is a website devoted exclusively to articles written by academics. SkS highly recommends The Conversation as a high quality site in general.
The numbers are just in. At a time when we need to be urgently reducing our CO2 emissions, we are now emitting more CO2 than any time in human history. However, it's not too late to turn things around.
Last year we examined the 2010 annual fossil fuel CO2 emissions report from the International Energy Agency (IEA). The news was not good - 2010 saw the largest single year increase in these emissions, growing 1.6 billion tonnes (gigatonnes [Gt]) from 2009, to 30.6 Gt (the previous record annual increase was 1.2 Gt). Energy intensity (the ratio of primary energy use to Gross Domestic Product) rose in 2010 for the first time since 1990, possibly because of relatively subuded fossil fue prices and economic stimulus funding for construction projects. For these reasons, the 2010 CO2 emissions growth may not be repeated (Jotzo et al. 2012).
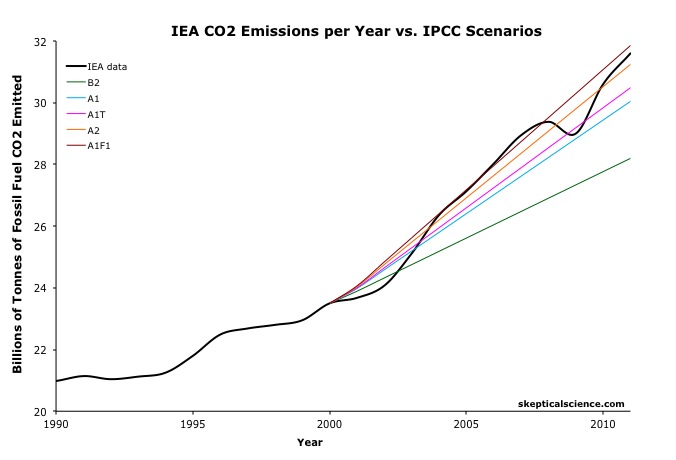
The 2011 IEA estimate is now out, and includes some good news and some bad news. In 2011, global fossil fuel CO2 emissions set yet another record, increasing a further 1.0 Gt to 31.6 Gt (Figure 1). Last year, we emitted more CO2 into the atmosphere than any time in human history. However, in a valiant effort to take a glass-half-full approach, we can point out that the increase was smaller than in 2010, as Jotzo et al. expected, and only the fourth-largest annual emissions increase on record.
Figure 1: IEA fossil fuel CO2 emissions estimates vs. IPCC SRES emissions scenarios.
The Organisation for Economic Co-operation and Development (OECD) nations managed to decrease their emissions by 0.6% as compared to 2010, but non-OECD nation emissions increased by 1.6% last year. The largest single contribution to the increase came from China (0.72 Gt) primarly due to rising coal consumption; however, China's ratio of CO2 emissions per Gross Domestic Product also fell 15% between 2005 and 2011. Without that move towards lower carbon intensity, China's emissions in 2011 would have been 1.5 Gt higher. As IEA Chief Economist Fatih Birol noted,
"What China has done over such a short period of time to improve energy efficiency and deploy clean energy is already paying major dividends to the global environment"
CO2 emissions in the United States fell 1.7%, due primarily to a transition away from coal power to natural gas. European emissions fell 1.9% due to a slow economy and a warm winter reducing heating needs. Japan's emissions rose 2.4% due to fossil fuels replacing the nuclear energy production lost during the Fukushima disaster.
Last year in terms of both cumulative and annual emissions, we were on track with Intergovernmental Panel on Climate Chage (IPCC) Special Report on Emissions Scenarios (SRES) Scenario A2, the description of which matches what's happening in the real world fairly accurately thus far:
- Relatively slow end-use and supply-side energy efficiency improvements (compared to other scenarios).
- Delayed development of renewable energy.
- No barriers to the use of nuclear energy.
2011 emissions have now moved us slightly above the Scenario A2 track (see Figure 1), which corresponds to about 4°C global warming above pre-industrial levels by 2100.
Leading up to its forthcoming Fifth Assessment Report, the IPCC has developed new emissions scenarios called Representative Concentration Pathways (RCPs). The number associated with each RCP represents the associated greenhouse gas radiative forcing. For example, RCP 4.5 represents a 4.5 Watt per square metre (W/m2) forcing in 2100. Radiative forcing is a measure of a global energy imbalance, for example how much heat is trapped by increasing greenhouse gases. The radiative forcing from a doubling of atmospheric CO2 is about 4 Watts per square metre.
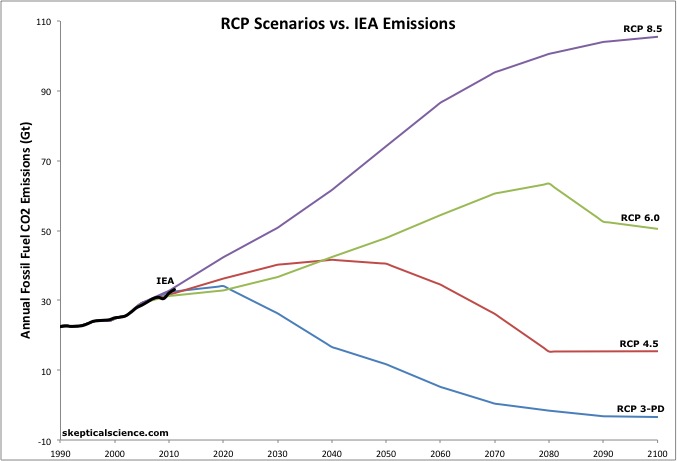
Figure 2 compares IEA emissions estimates the these RCPs.
Figure 2: IEA fossil fuel CO2 emissions estimates vs. IPCC RCPs
Since the RCPs are new and account for observed CO2 emissions through 2005, the various scenarios do not diverge significantly until after 2011. Therefore, the good news is that we still have time to decide which path to take.
RCP 3-PD (3 W/m2 peak forcing followed by a decline) represents a path in which the greenhouse gas radiative forcing drops to 2.6 W/m2 by 2100. This emissions path corresponds to a global surface warming of approximately 2°C above pre-industrial levels, which is the internationally accepted "danger limit" beyond which global warming has been deemed an unacceptable risk.
In its recent report, The Critical Decade, the Australian government's Climate Commission outlined a budgetary approach to avoid surpassing the danger limit. The Commission estimated that humanity can emit not more than 1 trillion tonnes of CO2 between 2000 and 2050 to have a 75% probability of avoiding the danger limit.
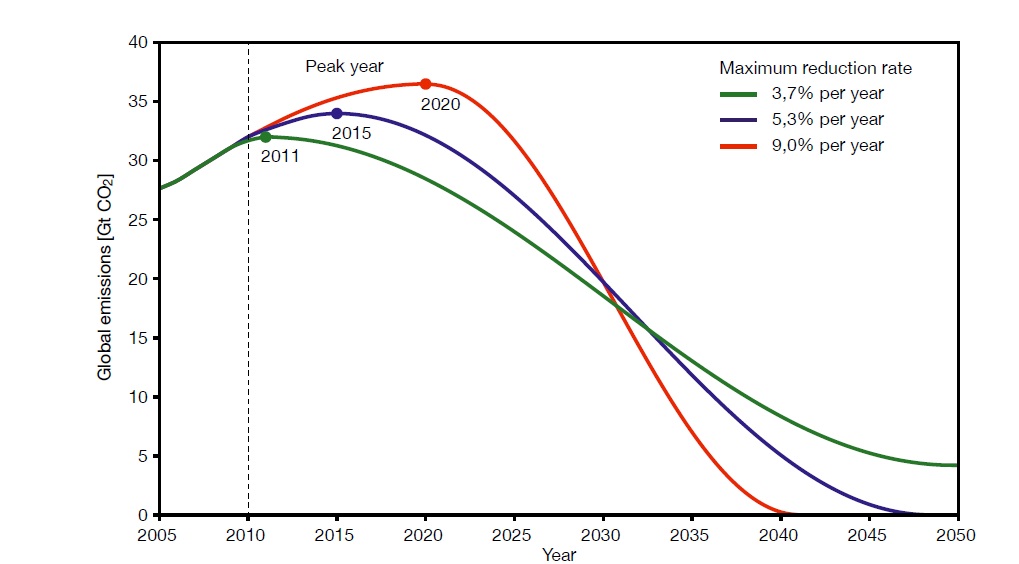
Currently we are 22% of the way through the budgetary timeline, but we have emitted 328 Gt of fossil fuel CO2, burning through nearly 33% of the budget. Thus we need to change our path soon from one of rising to decreasing annual emissions. Richard Somerville and Susan Joy Hassol created the 'ski slopes' graphic, which depicts three possible scenarios to achieve the necessary emissions cuts (Figure 3).
Figure 3: Three scenarios, , each of which would limit the total global emission of carbon dioxide from fossil-fuel burning and industrial processes to 750 Gt over the period 2010–2050.
The longer it takes us to reach peak emissions, the more aggressively we will have to reduce our emissions down the track. If emissions don't peak until 2020, our emissions cuts will have to be as large as 9% per year in 2030, and drop to zero net emissions in 2040.
Hence the title of the Australian Climate Commission report - the next decade is a critical one. The IEA has its own 2°C scenario, in which emissions peak at 32.6 Gt no later than 2017. Although emissions increased by 1.6 Gt in 2010 and 1.0 Gt in 2011, they can increase no more than 1.0 Gt (total, not annual increase) between 2011 and 2017 to meet the IEA scenario. The IEA notes that deploying the policies and the technologies that we need will take time to bear fruit, and that the poor infrastructure choices we make today will be with us for many years. In order to achieve the necessary emissions reductions, the IEA scenario envisages developed-country carbon taxes in the range $20-45 per tonne in 2020, rising to $95-120 for all countries by 2035.
The good news is that we are making some progress. Despite its rapid development, China's per capita emissions are still just 63% of the OECD average, thanks in large part to its efforts to improve energy efficiency and deploy clean energy. OECD emissions declined in 2011, albeit by a small amount. And there is still time to reduce our emissions sufficiently to avoid dangerous global warming.
The bad news is that time is running out, and the longer we wait, the more difficult and expensive it will be to achieve the necessary emissions cuts. The elusive binding international agreement to reduce global CO2 emissions approximately 80% by 2050 must be signed, and soon, or the necessary emissions cuts will become too steep to be practically achievable.


 Arguments


[DB] You have previously received moderation for being off-topic. The scope of this current comment far exceeds that of the OP of this thread. You are welcome to resubmit the applicable portions on applicable threads, separately. Note also that when engaging multiple participants at SkS it is considered good form to post separate comments to them. This prevents "dog piling".
Please take the time to review the Comments Policy and ensure future comments are in full compliance with it. Thanks for your understanding and compliance in this matter.
Note that future comments constructed as this one will be summarily deleted.