Lessons from Past Predictions: Hansen 1981
Posted on 3 May 2012 by dana1981
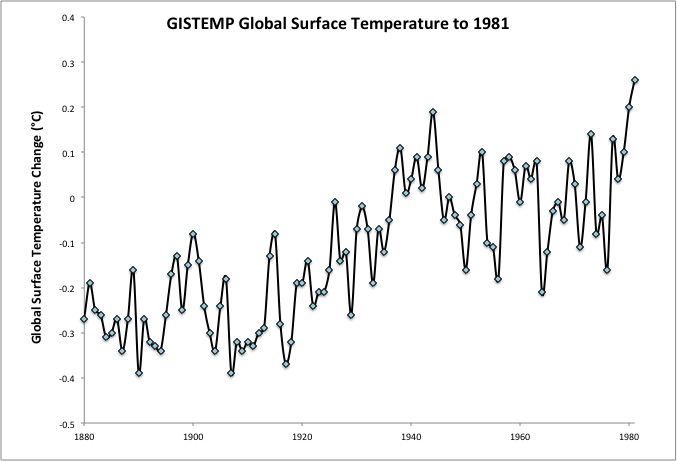
 In previous Lessons from Past Predictions entries we examined Hansen et al.'s 1988 global warming projections (here and here). However, James Hansen was also the lead author on a previous study from the NASA Goddard Institute for Space Studies (GISS) projecting global warming in 1981, which readers may have surmised from my SkS ID, is as old as I am. This ancient projection was made back when climate science and global climate models were still in their relative infancy, and before global warming had really begun to kick in (Figure 1).
Figure 1: Annual global average surface temperatures from the current NASA GISS record through 1981
As Hansen et al. described it,
"The global temperature rose by 0.2°C between the middle 1960's and 1980, yielding a warming of 0.4°C in the past century. This temperature increase is consistent with the calculated greenhouse effect due to measured increases of atmospheric carbon dioxide. Variations of volcanic aerosols and possibly solar luminosity appear to be primary causes of observed fluctuations about the mean trend of increasing temperature. It is shown that the anthropogenic carbon dioxide warming should emerge from the noise level of natural climate variability by the end of the century, and there is a high probability of warming in the 1980's."
This analysis from Hansen et al. (1981) shows a good understanding of the major climate drivers, even 31 years ago. The study was also correct in predicting warming during the remainder of the 1980s. The Skeptical Science Temperature Trend Calculator reveals that the trend from 1981 to 1990 was 0.09 +/- 0.35°C per decade - not statistically significant because this is such a short timeframe, but most likely a global warming trend nonetheless.
Global Warming Skeptics Stuck in 1981?
Hansen et al. noted that the human-caused global warming theory had difficulty gaining traction because of the mid-century cooling, which ironically is an argument still used three decades later to dispute the theory:
"The major difficulty in accepting this theory has been the absence of observed warming coincident with the historic CO2 increase. In fact, the temperature in the Northern Hemisphere decreased by about 0.5°C between 1940 and 1970, a time of rapid CO2 buildup."
However, as we will see in this post, despite these doubts, the global warming projections in Hansen et al. (1981), based on the human-caused global warming theory, were uncannily accurate.
Climate Sensitivity
Hansen et al. discussed the range of climate sensitivity (the amount of global surface warming that will result in response to doubled atmospheric CO2 concentrations, including feedbacks):
"The most sophisticated models suggest a mean warming of 2° to 3.5°C for doubling of the CO2 concentration from 300 to 600 ppm"
This is quite similar to the likely range of climate sensitivity based on current research, of 2 to 4.5°C for doubled CO2. Hansen et al. took the most basic aspects of the climate model and found that a doubling of CO2 alone would lead to 1.2°C global surface warming (a result which still holds true today).
"Model 1 has fixed absolute humidity, a fixed lapse rate of 6.5°C km-1 in the convective region, fixed cloud altitude, and no snow/ice albedo feedback or vegetation albedo feedback. The increase of equilibrium surface temperature for doubled atmospheric CO2 is ?Ts ~1.2°C. This case is of special interest because it is the purely radiative-convective result, with no feedback effects."
They then added more complexity to the model to determine the feedbacks of various effects in response to that CO2-caused warming.
"Model 2 has fixed relative humidity, but is otherwise the same as model 1. The resulting ?T, for doubled CO2 is ~1.9°C. Thus the increasing water vapor with higher temperature provides a feedback factor of ~1.6."
"Model 3 has a moist adiabatic lapse rate in the convective region rather than a fixed lapse rate. This causes the equilibrium surface temperature to be less sensitive to radiative perturbations, and ?T ~1.4°C for doubled CO2."
"Model 4 has the clouds at fixed temperature levels, and thus they move to a higher altitude as the temperature increases. This yields ?T ~2.8°C for doubled CO2, compared to 1.9°C for fixed cloud altitude. The sensitivity increases because the outgoing thermal radiation from cloudy regions is defined by the fixed cloud temperature, requiring greater adjustment by the ground and lower atmosphere for outgoing radiation to balance absorbed solar radiation."
"Models 5 and 6 illustrate snow/ice and vegetation albedo feedbacks. Both feedbacks increase model sensitivity, since increased temperature decreases ground albedo and increases absorption of solar radiation."
Overall Hansen et al. used a one-dimensional model with a 2.8°C climate sensitivity in this study. In today's climate models, water vapor is generally a stronger feedback than modeled by Hansen et al. (i.e. see Dessler et al. 2008) and clouds generally weaker (i.e. see Dessler 2010), but their overall model sensitivity was very close to today's best estimate of 3°C for doubled CO2.
Natural Temperature Influences
Hansen et al. discussed the effects of solar and volcanic activity on temperatures, which are the two main natural influences on global surface temperature changes. Solar activity in particular posed a difficult challenge for climate modelers three decades ago, because it had not been precisely measured.
"for small changes of solar luminosity, a change of 0.3 percent would modify the equilibrium global mean temperature by 0.5°C, which is as large as the equilibrium warming for the cumulative increase of atmospheric CO2 from 1880 to 1980. Solar luminosity variations of a few tenths of 1 percent could not be reliably measured with the techniques available during the past century, and thus are a possible cause of part of the climate variability in that period."
"Based on model calculations, stratospheric aerosols that persist for 1 to 3 years after large volcanic eruptions can cause substantial cooling of surface air...Temporal variability of stratospheric aerosols due to volcanic eruptions appears to have been responsible for a large part of the observed climate change during the past century"
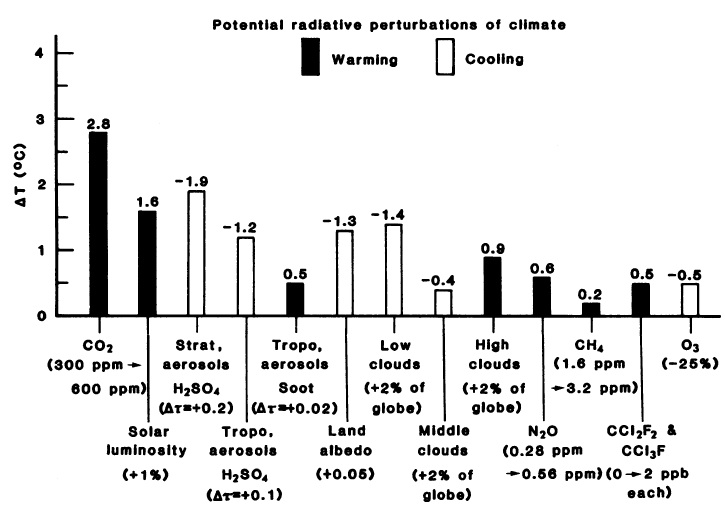
The study compared the various potential global temperature influences of both natural and human effects in Figure 2 below.
Figure 2: Surface temperature effect of various global radiative perturbations, based on the one-dimensional model used in Hansen et al. Aerosols have the The ?T for stratospheric aerosols is representative of a very large volcanic eruption. From Hansen et al. (1981)
Hansen et al. ran their model using combinations of the three main effects on global temperatures (CO2, solar, and volcanic), and concluded:
"The general agreement between modeled and observed temperature trends strongly suggests that CO2 and volcanic aerosols are responsible for much of the global temperature variation in the past century."
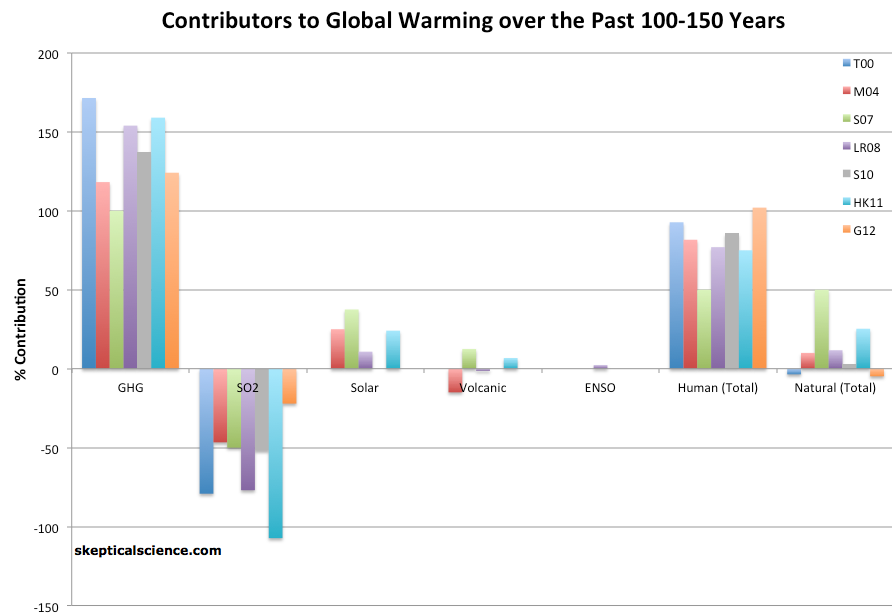
Due to the uncertainty regarding solar activity changes, they may have somewhat underestimated the solar contribution (Figure 3), but nevertheless achieved a good model fit to the observed temperature changes over the previous century.
Figure 3: Percent contributions of various effects to the observed global surface warming over the past 100-150 years according to Tett et al. 2000 (T00, dark blue), Meehl et al. 2004 (M04, red), Stone et al. 2007 (S07, green), Lean and Rind 2008 (LR08, purple), Stott et al. 2010 (S10, gray), Huber and Knutti 2011 (HR11, light blue), and Gillett et al. 2012 (G12, orange).
Projected Global Warming
Now we arrive at the big question - how well did Hansen et al. project the ensuing global warming? Evaluating the accuracy of the projections is something of a challenge, because Hansen et al. used scenarios based on energy growth, but did not provide the associated atmospheric CO2 concentrations resulting as a consequence of that energy growth. Nevertheless, we can compare their modeled energy growth scenarios to actual energy growth figures.
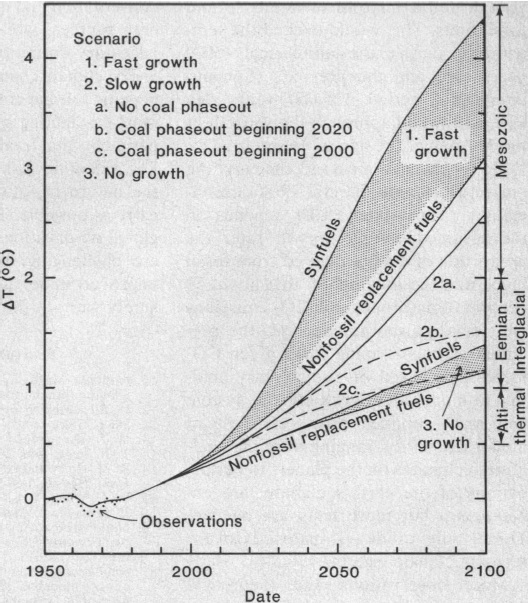
Figure 4 shows the projected warming based on various energy growth scenarios. The fast scenario assumes 4% annual growth in global energy consumption from 1980 to 2020, and 3% per year overall from 1980 through 2100. The slow scenario assumed a growth of annual global energy rates half as rapid as in the fast growth scenario (2% annual growth from 1980 to 2020). Hansen et al. also modeled various scenarios involving fossil fuel replacement starting in 2000 and in 2020.
Figure 4: Hansen et al. (1981) projections of global temperature. The diffusion coefficient beneath the ocean mixed layer is 1.2 cm2 per second, as required for best fit of the model and observations for the period 1880 to 1978. Estimated global mean warming in earlier warm periods is indicated on the right.
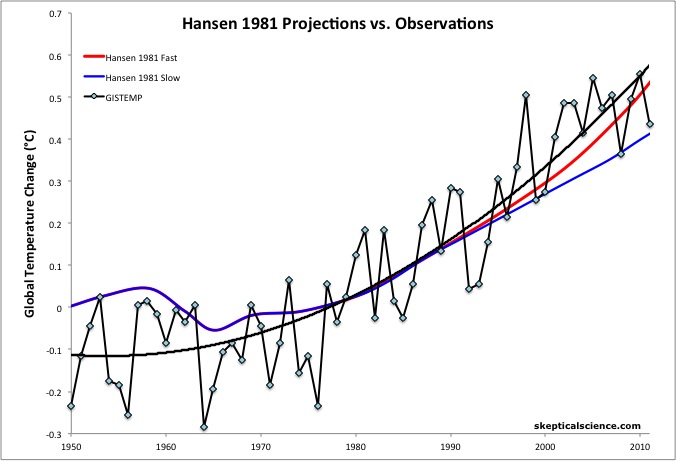
Since 1981, global fossil fuel energy consumption has increased at a rate of approximately 3% per year, falling between the Hansen et al. fast and slow growth scenarios. Thus we have plotted both and compared them to the observed global surface temperatures from GISTEMP (Figure 5).
Figure 5: Hansen et al. (1981) global warming projections under a scenario of high energy growth (4% per year from 1980 to 2020) (red) and slow energy growth (2% per year from 1980 to 2020) (blue) vs. observations from GISTEMP with a 2nd-order polynomial fit (black). Actual energy growth has been between the two Hansen scenarios at approximately 3% per year. Baseline is 1971-1991.
The global surface temperature record has improved since 1981, at which time the warming from 1950 to 1981 had been underestimated. Thus Figure 5 uses a baseline of 1971 to 1991 (sets the average temperature anomaly between 1971 and 1991 at zero), because we are most interested in how well the model projected the warming since 1981. As the figure shows, the model accuracy has been very impressive.
The linear warming trends from 1981 through 2011 are approximtely 0.17°C per decade for Hansen's Fast Growth scenario, 0.13°C per decade for the Slow Growth scenario, vs. 0.17°C per decade for the observed global surface temperature from GISTEMP. Estimating that the actual energy growth and greenhouse gas emissions have fallen between the Fast and Slow Growth scenarios, the observed temperature change has been approximately 15% faster than the projections of the Hansen et al. model.
If the model-data discrepancy were due solely to the model climate sensitivity being too low, it would suggest a real-world climate sensitivity of approximately 3.2°C for doubled CO2, although there are other factors to consider, such as human aerosol emissions, which are not accounted for in the Hansen et al. model, and the fact that we don't know the exact atmospheric greenhouse gas concentrations associated with their energy growth scenarios.
Predicted Climate Impacts
Hansen et al. also discussed several climate impacts which would result as consequences of their projected global warming:
"Potential effects on climate in the 21st century include the creation of drought-prone regions in North America and central Asia as part of a shifting of climatic zones, erosion of the West Antarctic ice sheet with a consequent worldwide rise in sea level, and opening of the fabled Northwest Passage."
We can check off all of these predictions.
- The southwestern United States and Central Asia have experienced frequent droughts in recent years;
Christy's Poor Critique
Climate "skeptic" John Christy, whose poor analysis of Hansen et al. (1988) we previously discussed, has also recently conducted a poor analysis of Hansen et al. (1981), posted on Pielke Sr.'s blog. Christy attempts to compare the warming projections of Hansen et al. with his lower atmosphere temperature record from the University of Alabama at Huntsville (UAH). However, Christy is comparing modeled surface temperatures to lower atmosphere temperature measurements; this is not an apples-to-apples comparison.
Christy's justification for this comparison is that surface temperature records and UAH show a similar rate of warming over the past several decades, but according to climate models, the lower atmosphere should warm approximately 20% faster than the surface. Christy believes the discrepancy is due to a bias in the surface temperature record, but on the contrary, the surface temperature record's accuracy has been confirmed time and time again (i.e. Peterson et al. 2003, Menne et al. 2010, Fall et al. 2011 [which includes Anthony Watts as a co-author!], Muller et al. 2011 [the BEST project], etc.). There are good reasons to believe the discrepancy is primarily due to problems in the atmospheric temperature record, but regardless, a surface temperature projection should be compared to surface temperature data.
In addition, Christy removes the influence of volcanic eruptions (which have had a modest net warming effect over the past 30 years due to a couple of volcanic eruptions causing cooling during the early part of that timeframe) before comparing UAH record to the Hansen model projections, but he fails to remove other short-term effects like the El Niño Southern Oscillation (ENSO) and solar activity (as was done by Foster & Rahmstorf [2011]), which have had cooling effects over that period. As a result, Christy's analysis actually biases the data in the cool direction prior to comparing it to the model, and as a result he arrives at the incorrect conclusion, wrongly claiming that Hansen et al. had over-predicted the ensuing global warming.
From Intrigue to Concern
The concluding paragraph of Hansen et al. expresses fascination at the global experiment we are conducting with the climate:
"The climate change induced by anthropogenic release of CO2 is likely to be the most fascinating global geophysical experiment that man will ever conduct. The scientific task is to help determine the nature of future climatic effects as early as possible."
While the grand global experiment humans are running with the climate remains a fascinating one, climate scientists have concluded that the nature of future climatic effects will be predominantly bad if we continue on our current greenhouse gas emissions path, and potentially catastrophic. Over the decades James Hansen's tone has grown increasingly alarmed, as he and most of his fellow climate scientists worry about the consequences of human-caused climate change.
Hansen et al. (1981) demonstrates that we have every reason to be concerned, as three decades ago these climate scientists understood the workings of the global climate well enough to predict the ensuing global warming within approximately 15%, and accurately predict a number of important consequences. It's high time that we start listening to these climate experts and reduce our greenhouse gas emissions.


 Arguments




 0
0  0
0


Comments